气候与水文

基于贺兰山青海云杉(Picea crassifolia)树轮对过去202 a最低气温的重建

  • 张晶 ,
  • 马龙 ,
  • 刘廷玺 ,
  • 孙柏林 ,
  • 乔子戌
展开
  • 内蒙古农业大学水利与土木建筑工程学院,内蒙古 呼和浩特 010018
马龙(1978-),男,教授,主要从事水文及水资源、环境演变、气候变化及三者响应关系研究. E-mail:

张晶(1997-),女,硕士研究生,主要从事水文及水资源、环境演变、气候变化及三者响应关系研究. E-mail:

收稿日期: 2023-08-03

  修回日期: 2023-09-03

  网络出版日期: 2026-03-11

基金资助

中国季风-大陆过渡带树轮多指标的水文气候信号挖掘及其响应机制

国家自然科学基金(52069019)

国家自然科学基金(51669016)

“草原英才”滚动支持项目

Reconstruction of the minimum temperature over the past 202 years based on tree rings of Picea crassifolia in the Helan Mountains

  • Jing ZHANG ,
  • Long MA ,
  • Tingxi LIU ,
  • Bolin SUN ,
  • Zixu QIAO
Expand
  • College of Water Conservancy and Civil Engineering College, Inner Mongolia Agricultural University, Hohhot 010018, Inner Mongolia, China

Received date: 2023-08-03

  Revised date: 2023-09-03

  Online published: 2026-03-11

摘要

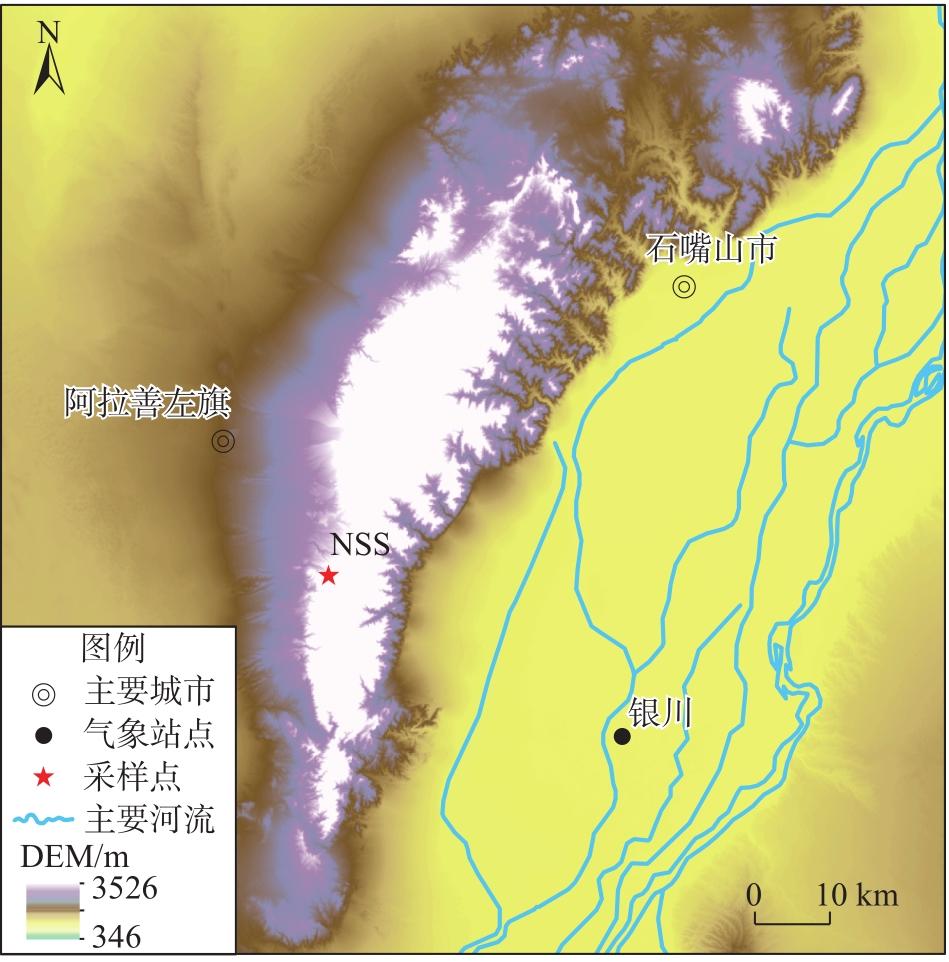
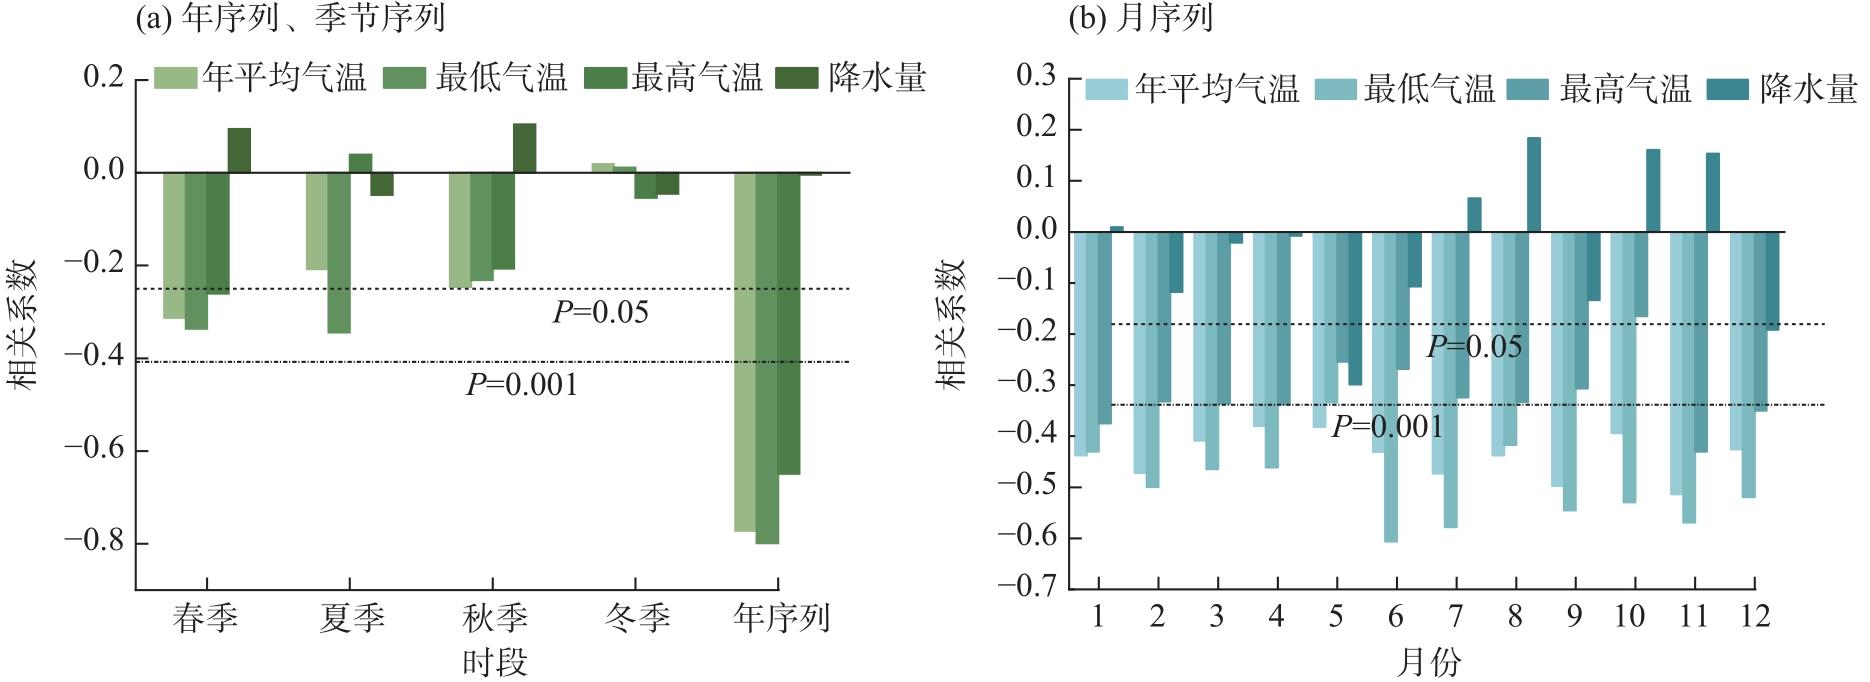
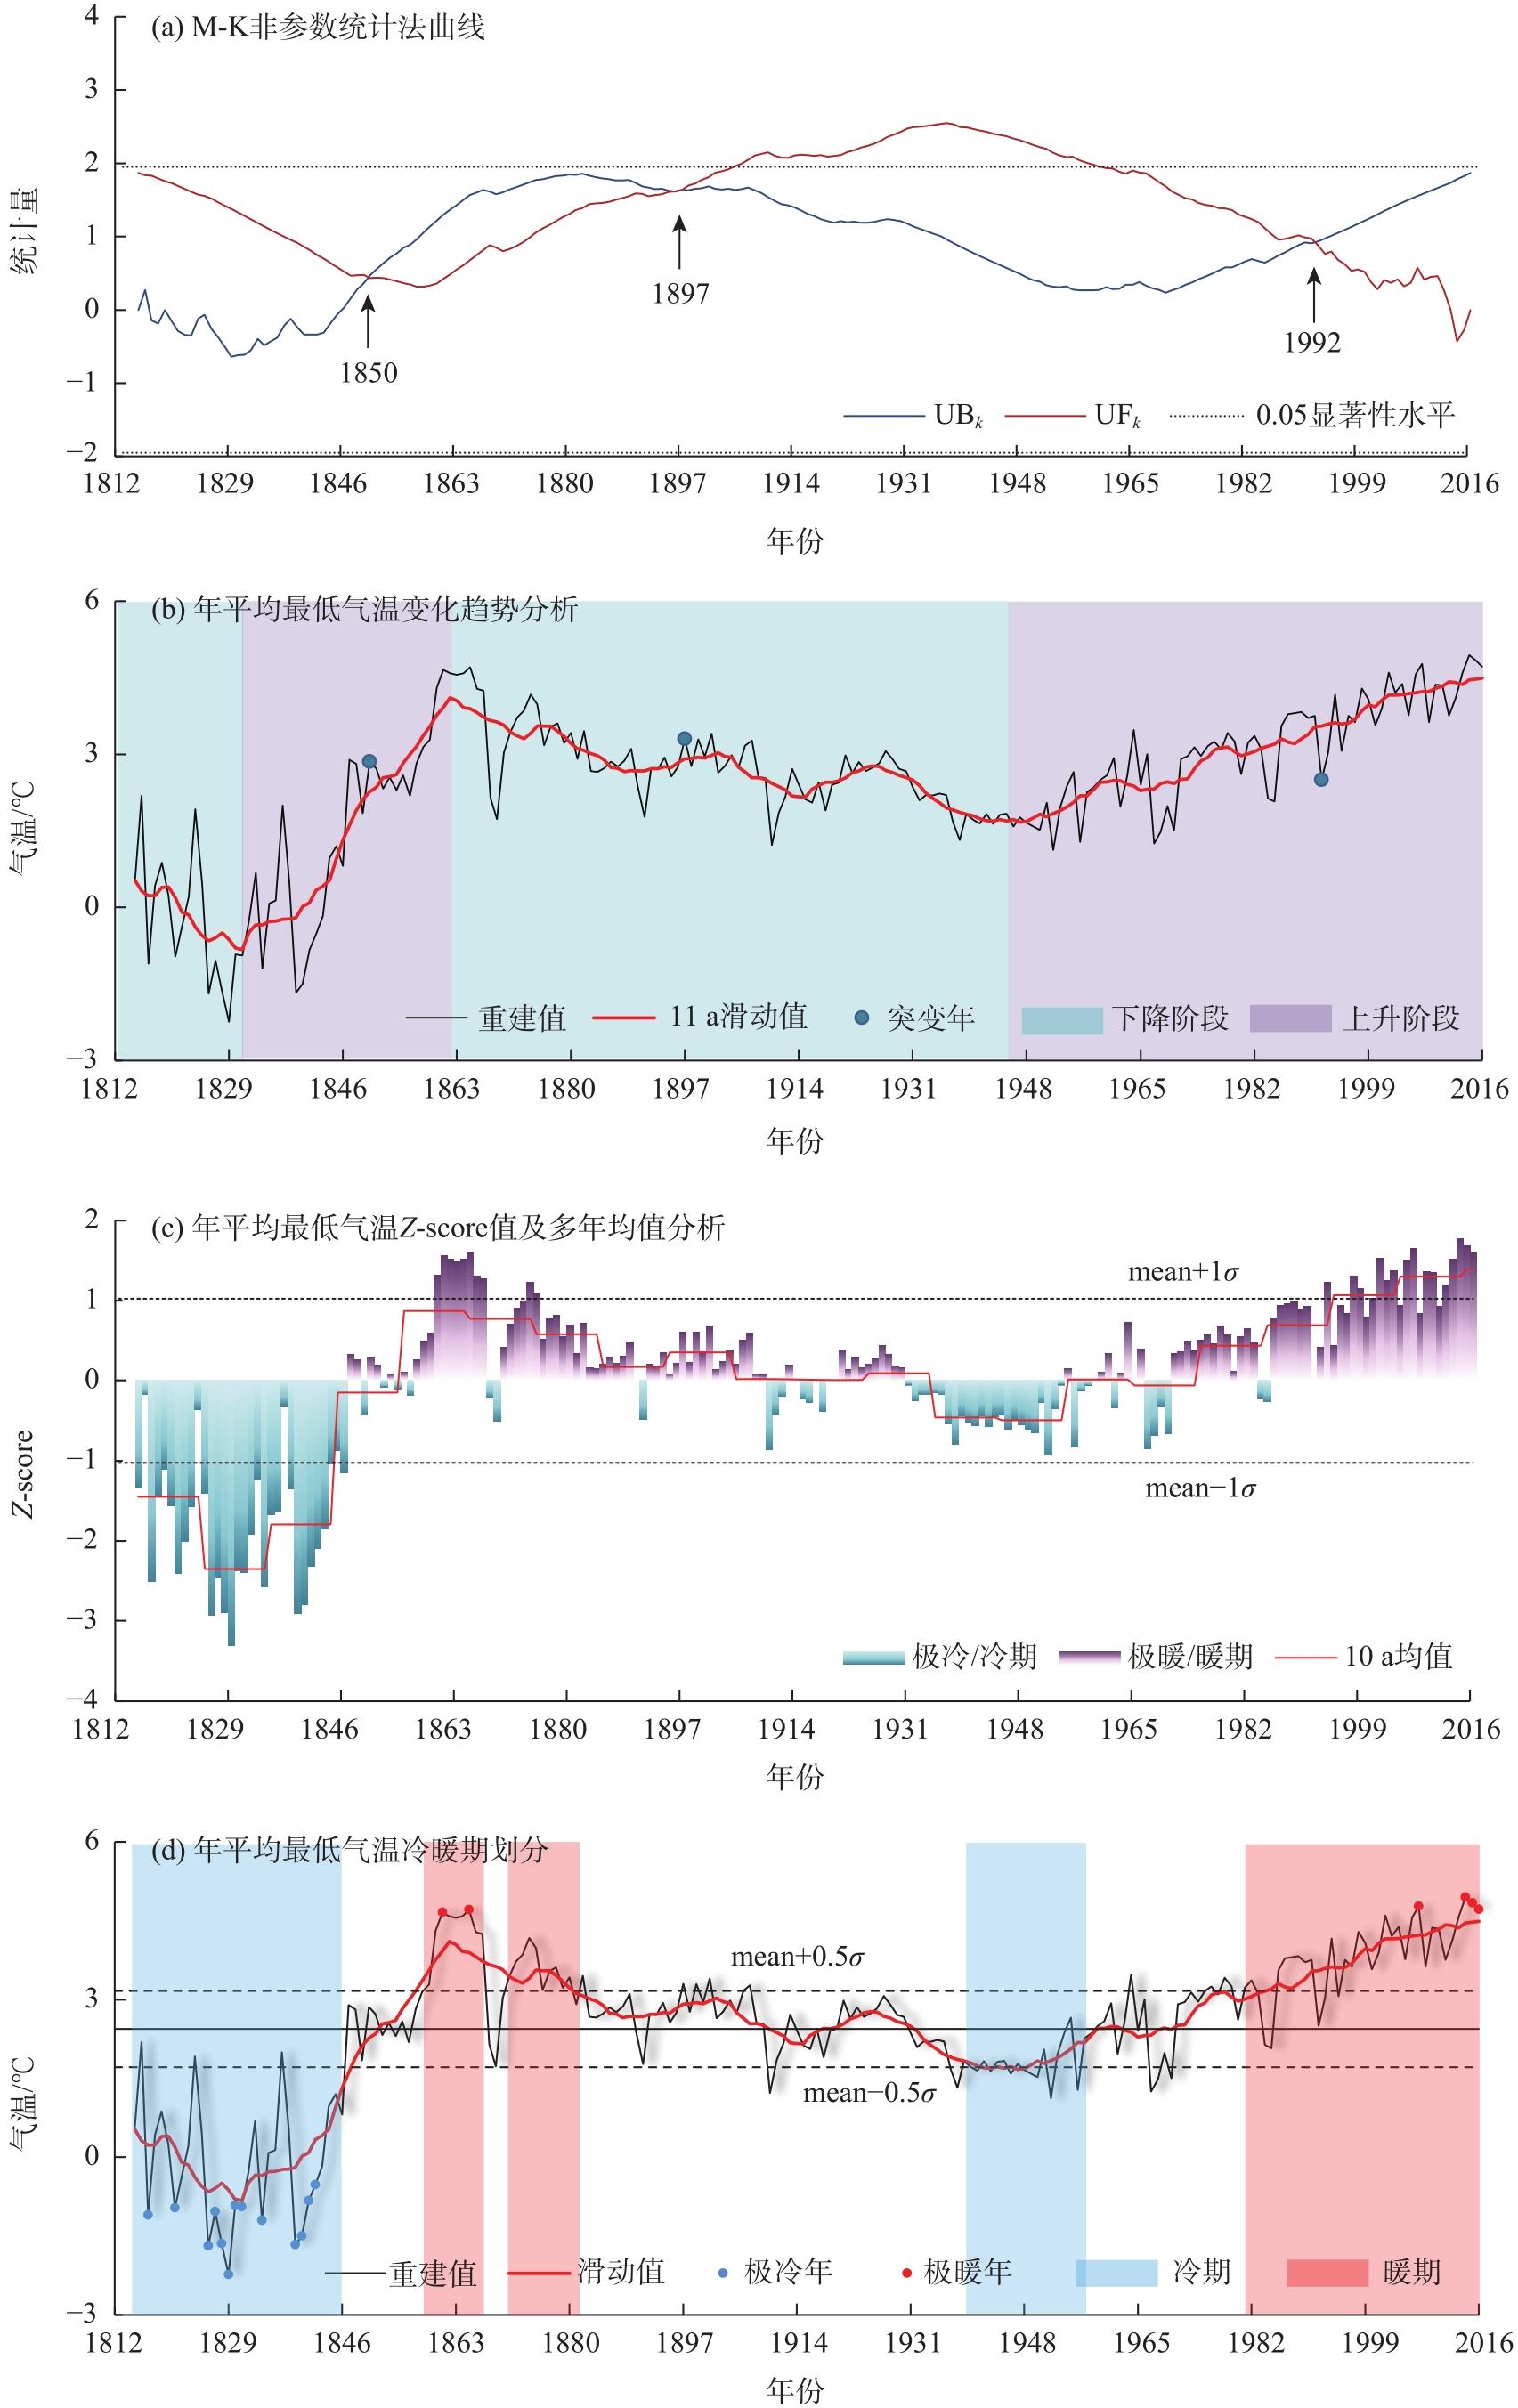
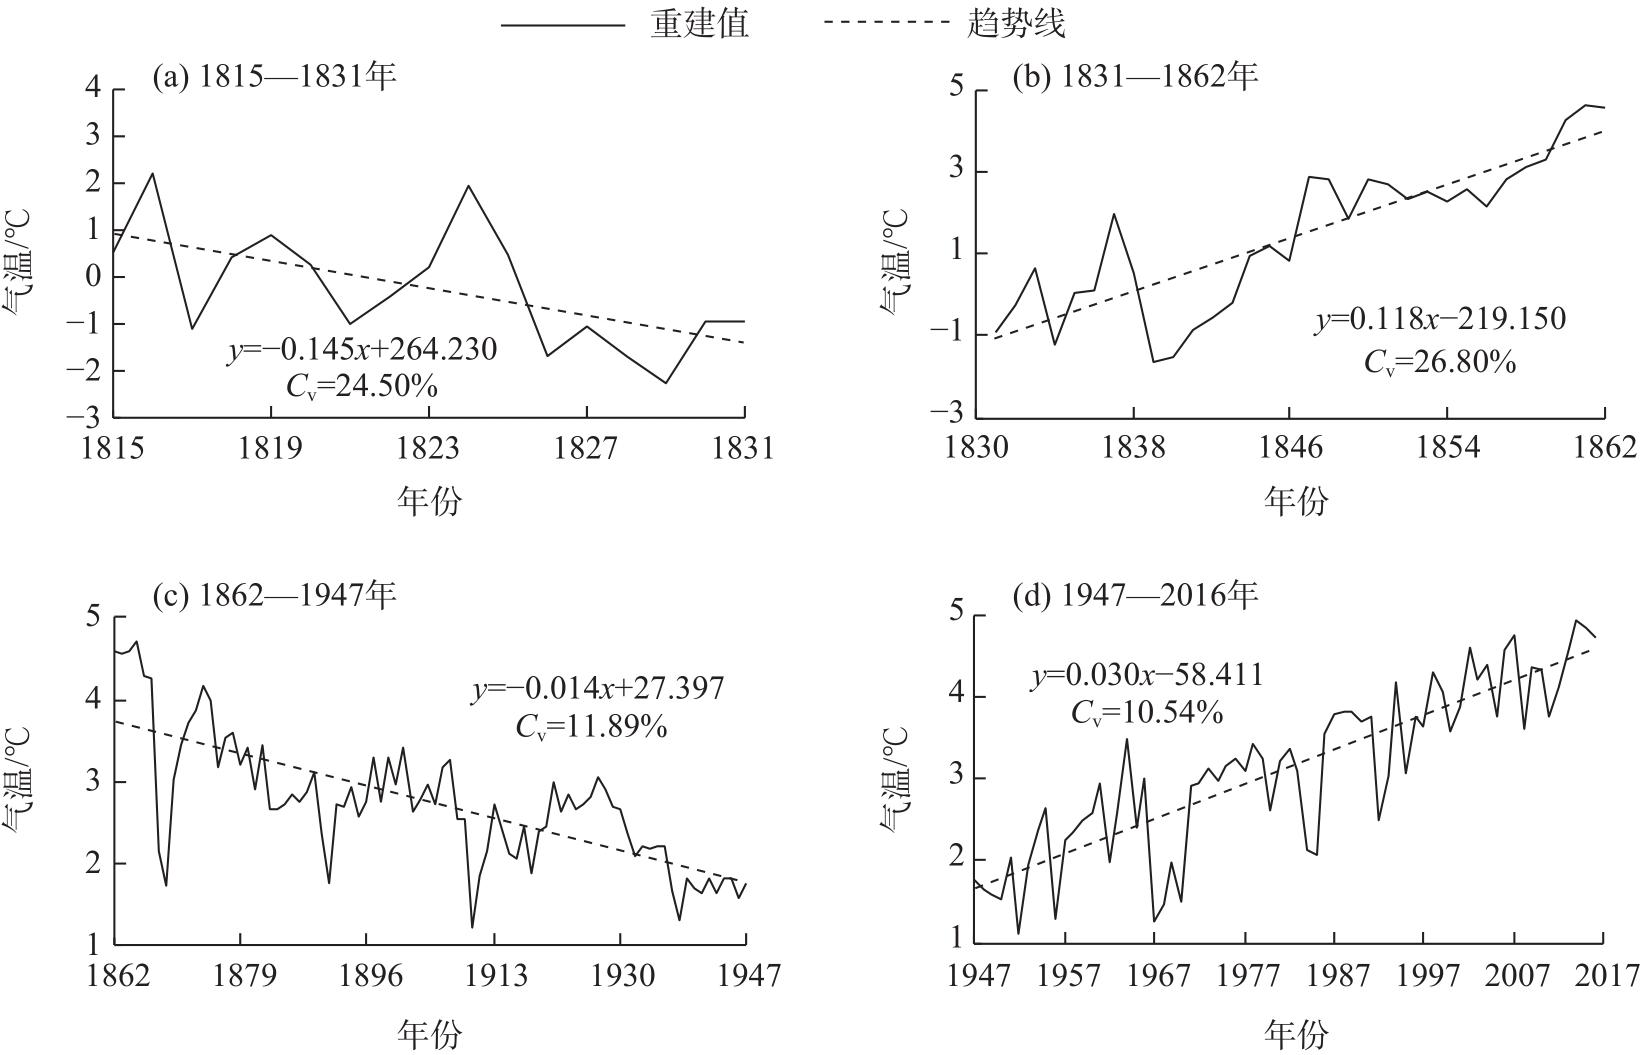
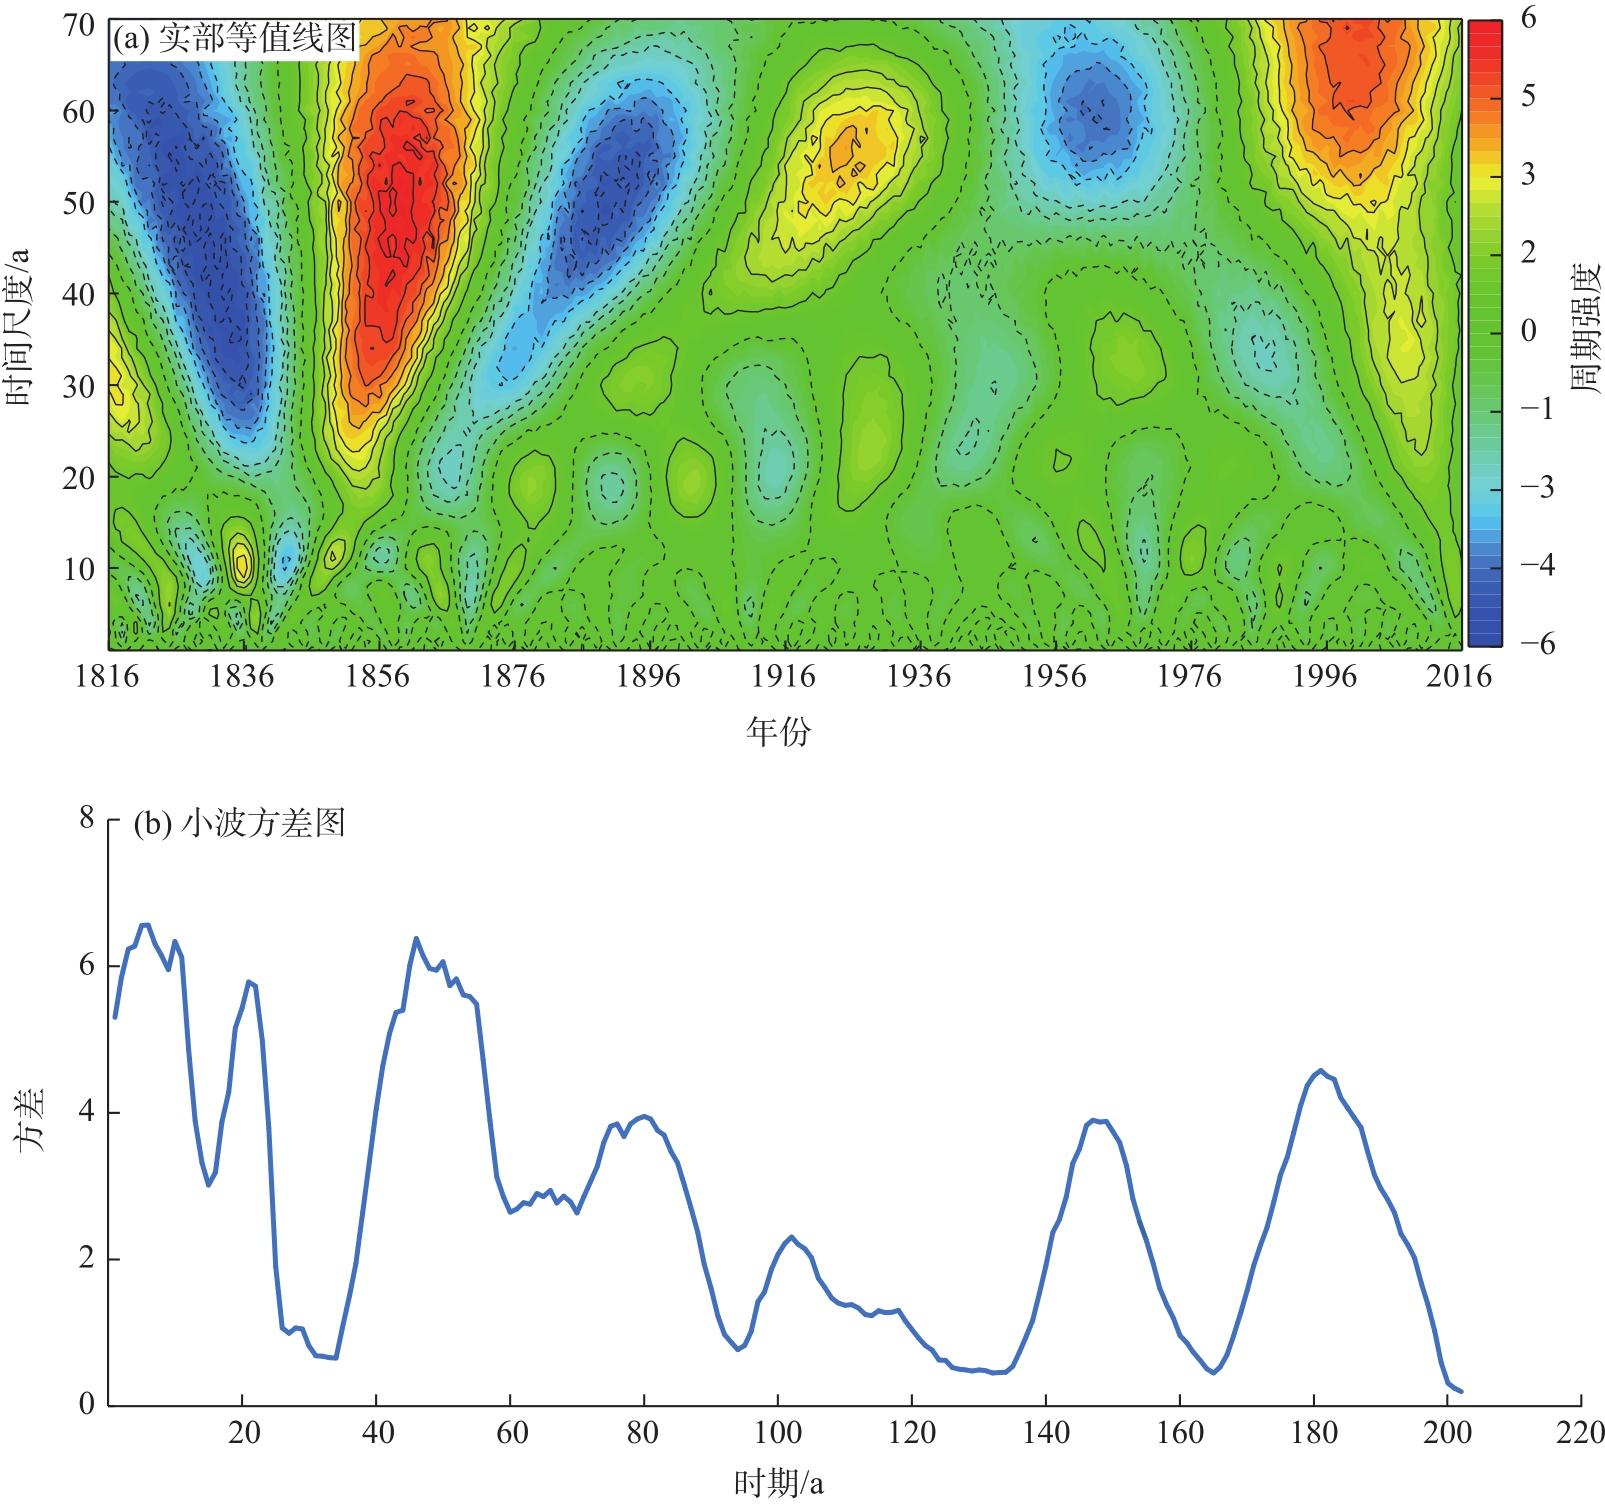
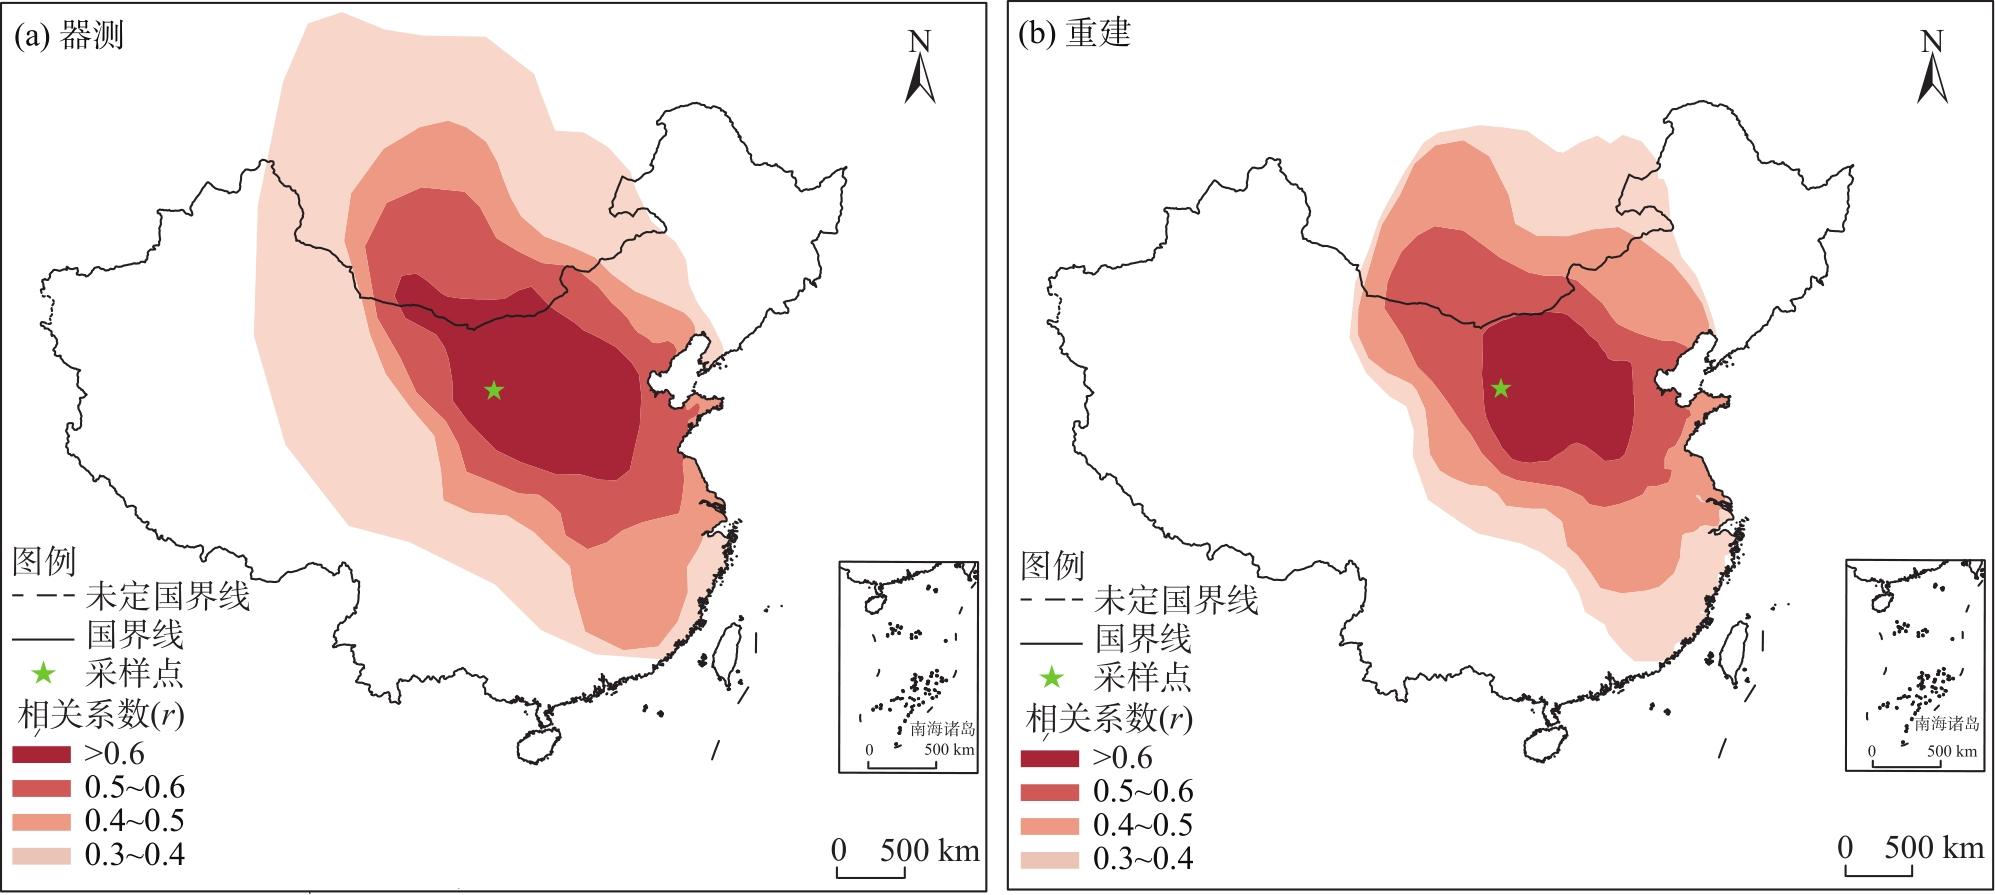
在全球变暖的影响下,全球水文气候发生深刻变化,而季风与非季风过渡带地区气候复杂多样,所以摸清该地区过去长期气候变化规律是亟待解决的问题。利用36棵青海云杉(Picea crassifolia)的66个树轮样芯建立了季风与非季风过渡带典型地区(中国贺兰山地区)1798—2016年(219 a)的青海云杉树轮宽度年表,并且通过皮尔逊相关法分析了树轮宽度年表与该地气候因子的相关性。结果表明:(1) 青海云杉径向生长与该地的年平均最低温(R2=0.638,P<0.001)关系密切,利用线性回归方程重建贺兰山1815—2016年年平均最低温序列,重建方程的缩减误差和有效系数分别为0.808、0.482。(2) 重建的年平均最低温序列在19世纪整体气温偏低,与学术界公认的“小冰期”一致,到19世纪后期,气温逐渐回升,并且气温序列出现了显著的暖期和极暖年,气温在19世纪50和90年代以及20世纪90年代发生3次气温突变。(3) Morlet小波分析显示了6 a、21 a和46~56 a的周期性分布特征。南方涛动、太平洋十年涛动和大西洋多年代际涛动是这种周期性变化的驱动因素。(4) 大尺度空间相关分析表明重建的气温序列对大尺度区域的气温变化具有较好的空间表征,如内蒙古大部和宁夏大部。进而重建的季风与非季风过渡带典型地区年平均最低气温序列揭示了该地的气候变化特征,为全球气候变化研究提供参考。

本文引用格式

张晶 , 马龙 , 刘廷玺 , 孙柏林 , 乔子戌 . 基于贺兰山青海云杉(Picea crassifolia)树轮对过去202 a最低气温的重建[J]. 干旱区地理, 2024 , 47(6) : 909 -921 . DOI: 10.12118/j.issn.1000-6060.2023.400

Abstract

Under the influence of global warming, profound changes are occurring in the global hydroclimatic system. Understanding the long-term climate patterns in monsoon and nonmonsoon transitional zones is crucial owing to their complex and diverse climates. Utilizing 66 tree-ring cores from 36 Picea crassifolia trees, a dendrochronological chronology from 1798 to 2016 (219 years) was established for a typical area in the transitional zone (Helan Mountains region, northwest China). The Pearson correlation method was used to analyze the relationship between tree-ring widths and local climatic factors. The results show that: (1) The radial growth of Picea crassifolia closely correlates with the area’s annual average minimum temperature (R2=0.638, P<0.001). A linear regression equation was used to reconstruct the annual average minimum temperature series for Helan Mountains from 1815 to 2016, with a reduction error and coefficient of efficiency of 0.808 and 0.482, respectively. (2) The reconstructed series generally indicates lower temperatures in the 19th century, consistent with the globally recognized “Little Ice Age”. From the late 19th century, temperatures gradually increased, showing significant warm periods and extremely warm years, with three abrupt temperature shifts in the 1850s, 1890s, and 1990s. (3) Morlet wavelet analysis shows the periodic distribution characteristics of 6 a, 21 a and 46-56 a. Southern Oscillation, Pacific Decadal Oscillation, and Atlantic Multidecadal Oscillation are the driving factors behind these periodic changes. (4) Large-scale spatial correlation analysis indicates that the reconstructed temperature series represents the temperature variations well in large regions like most of Inner Mongolia and Ningxia. The reconstructed annual average minimum temperature series for this typical monsoon and nonmonsoon transitional zone reveals its climatic characteristics, providing a reference for global climate change research.
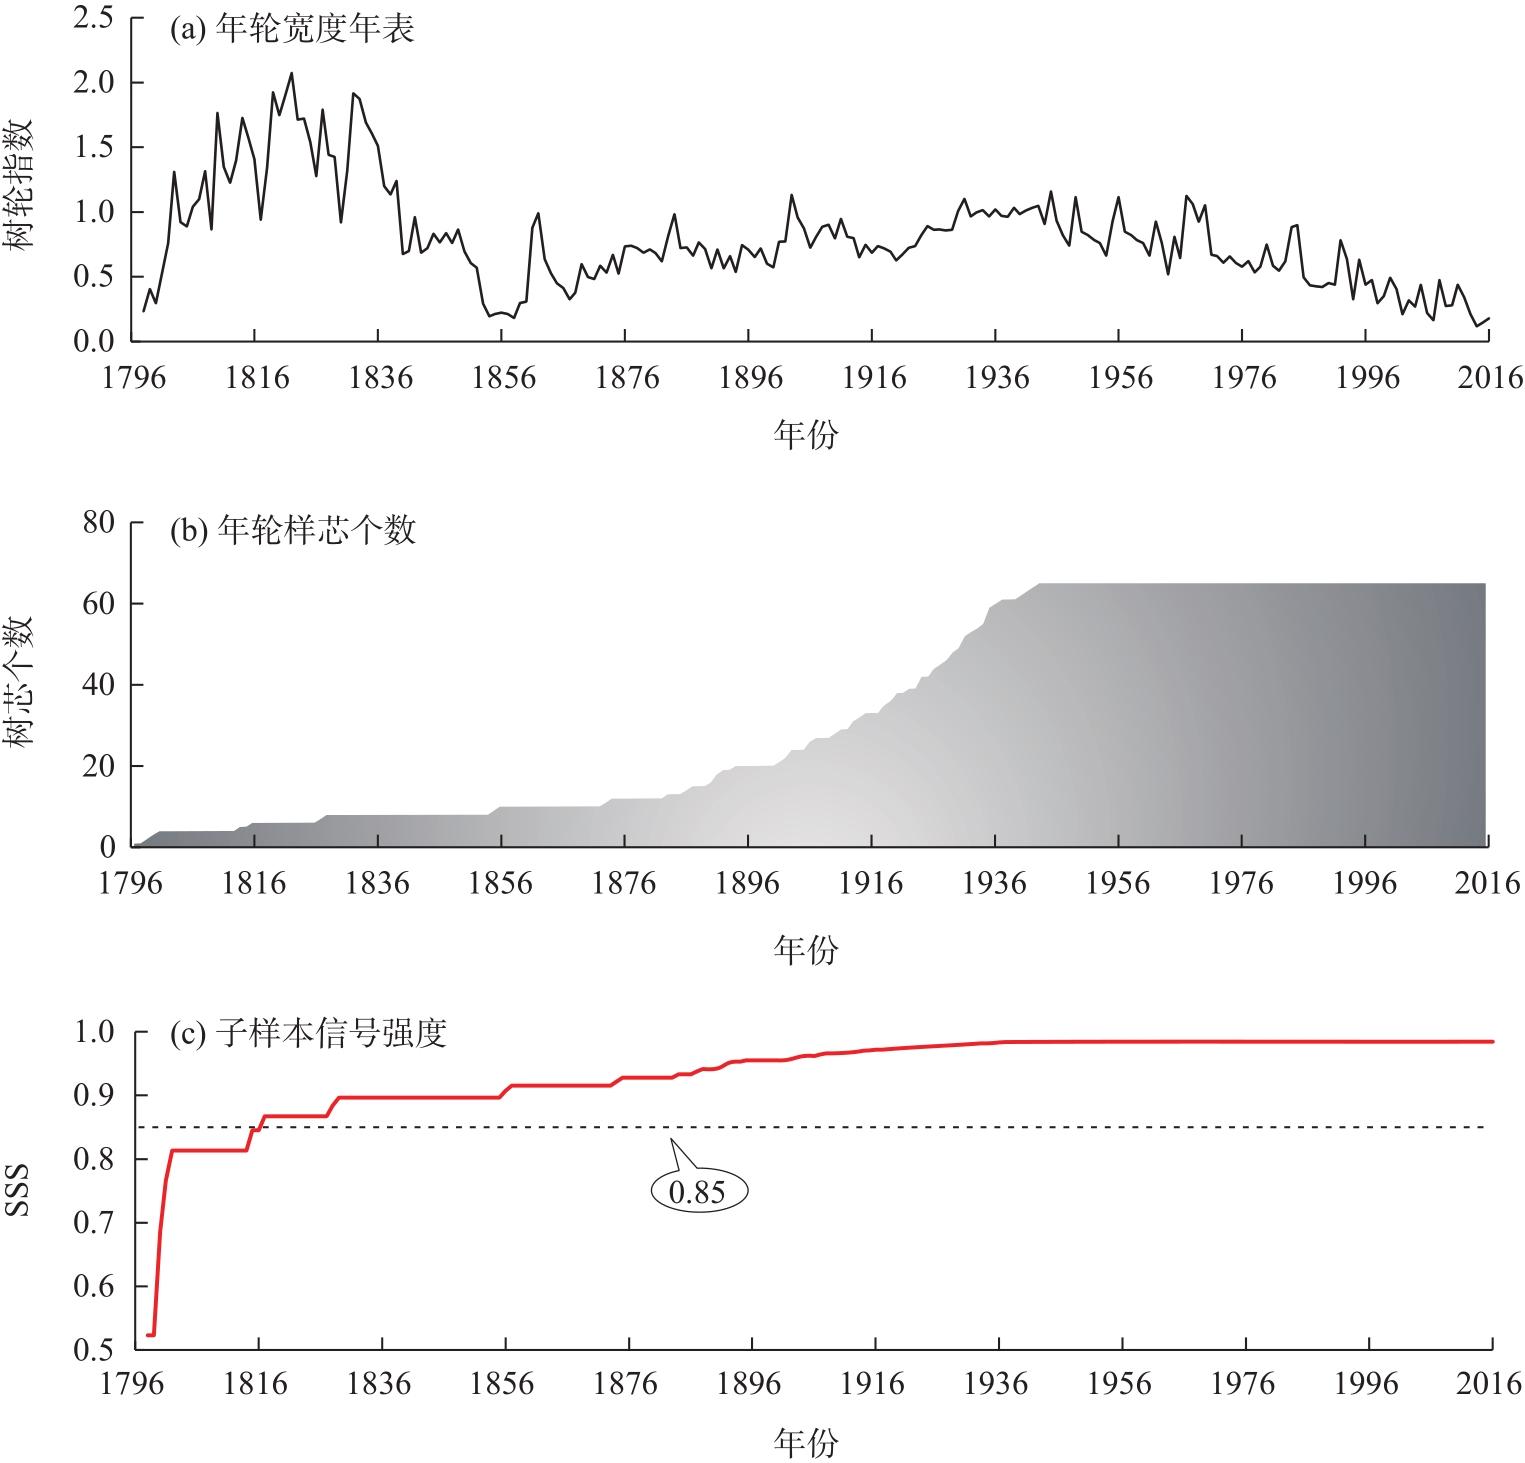
全球变暖已经成为一个无可争议的现象[1],1901—2012年全球平均气温上升0.89 ℃,全球变暖趋势增强。北半球中高纬度地区的年平均气温增幅最大[2]。为了更好地预测未来气候的发展,需要了解历史气候的变化规律和驱动机制,仪器记录时代数据时间序列较短、地质数据记录较为粗糙,相比较树木年轮可以反映出连续性强、分辨率高、地域分布范围广泛和复本量好的气象资料[3-4],所以在研究千年来气候变化时大多采用树木年代学方法。
近年来,树木径向生长和气候变化的研究引起学者的关注,在国际上取得了较大的进展。在20世纪曾有学者探索过树轮宽度与某种气候要素之间的响应关系[5],对后来的树木年轮气候学产生了一定影响[6]。随着科技的进步和新方法的出现及应用,目前树木年轮气候学得到了迅速的发展。研究成果显示,对针叶类树种研究较为广泛,如喜马拉雅冷杉[7]、长叶松[8]、兴安落叶松[9]、油松[10]。从研究区域来看,树木年轮气候重建研究主要集中在美洲、欧洲、亚洲,其中在美洲树木年轮与气候重建中,根据雪松[11]、松树[12]、白杉[13]等树轮资料,揭示了美洲典型气候区的极端气象事件、气温变化以及干湿变化。而在欧洲的树轮气候研究热点地区,通过欧洲橡树[14]、落叶松[15]、山毛榉[16]等树轮资料显示了树木径向生长与太阳周期、极端气候事件、气温和降水总量的关系。亚洲的树木年轮气候学研究不仅记载了极端气候事件与“小冰期”时间相一致,而且发现全球变暖对研究区水文气候变化有显著影响[17-19];我国的树木年轮与气候重建研究主要集中在西部、北部和青藏高原地区,研究表明树木生长的主要限制因子是气温、降水、干旱指数等[20-22]
贺兰山脉不仅属于我国200 mm等降水量线地区,而且位于季风气候和非季风气候的分界线上;其北部地区处于东亚季风区西北边缘和沙漠黄土交界带上,气候干旱,降水稀少[23],生态环境复杂多样。中国学者借助树轮反演贺兰山地区过去水文气候变化特征和规律,并且取得较多成果;截至目前,贺兰山地区的树轮研究工作重点在于降水、干湿指数以及最高气温重建[23-26],在最低气温重建方面缺乏研究成果。基于此,选择在贺兰山保护区内分布最为广泛的青海云杉(Picea crassifolia)为研究树种,构建了219 a青海云杉树木年轮宽度年表,在分析和检验年表与气候因子关系稳定性的基础上,重建了贺兰山过去202 a年平均最低气温。研究结果丰富了国际树木年轮数据库,掌握了贺兰山年平均最低气温的历史变化趋势,特别是在全球气候变暖的背景下,对于了解季风和非季风过渡地区气候变化规律以及应对未来气候变化具有一定意义。
综上所述,本次研究的目的是:(1) 构建贺兰山青海云杉树轮宽度年表;(2) 确定与当地青海云杉生长关系最密切的气候要素,并进行历史重建;(3) 分析气候要素重建序列过去长历史时期的变化规律。

1 资料与方法

1.1 研究区概况

研究区位于宁夏回族自治区与内蒙古自治区交界处贺兰山脉(图1),是中国西北地区的重要地理界线。该研究区西侧平缓,没入阿拉善高原,东侧陡峭险峻,峰峦重叠;主峰敖包疙瘩位于贺兰山中部,海拔约3555 m。贺兰山中森林资源较为丰富,以青海云杉、油松为主。由于研究区位于季风气候与非季风气候的过渡带,地势险峻,所以该地区气候复杂多变,其1956—2016年平均气温为9 ℃,一年中最暖的月份是7月(25.79 ℃),最冷的月份是1月(-9.98 ℃);多年平均降水量为108 mm,降水主要集中在6—8月,占全年60%~80%(以银川气象站数据为准,数据来源于国家气象信息中心, http://data.cma.cn/)。
图1 研究区概况

Fig. 1 Overview of the study area

1.2 树种选取

青海云杉属松科、云杉属,主要分布在中国西部地区,其耐阴、耐寒,喜欢凉爽湿润的气候和肥沃深厚、排水良好的微酸性沙质土壤,生长缓慢,属浅根性树种[27];其树轮边界较为明显,可以通过打磨和扫描处理后精确地测出年轮宽度,是极好的气候记录代用工具[28-30]

1.3 树轮采样及其数据处理

在贺兰山针叶林的林片边缘或上树线附近(海拔约为2075 m)采集了青海云杉树木年轮样本,采样时间为2017年7月。采样时严格按照国际树木年轮数据库(ITRDB)中的采样标准进行采样,本次采样共采集了37棵树、74个样芯。将所取样芯放在已打孔的塑料管中并进行编号,带回到室内自然晾干,再用颗粒由粗到细的砂纸进行打磨,直到其轮界清晰为止。处理好的样芯经过高清扫描仪(分辨率为:1200 dpi)扫描后,用测量精度为0.001 mm的WinDENDRO软件对样芯进行交叉定年,对每个样品的树轮宽度逐年进行测量。然后利用国际通用COFECHA程序[31]检验交叉定年的质量,剔除掉与主序列严重不符的样芯,最终选用66个青海云杉树芯用于年表的构建(图2b)。使用ARSTAN程序中的负指数函数进行去趋势,然后用双权重平均法合成去趋势的结果,得到常规的标准化(STD)年表(图2a)。年表的最低副本量是通过子样本信号强度(SSS)来确定的,在本研究中使用SSS>0.85的树轮宽度年表作为可靠区间,以保证重建序列的可靠性和最大长度(图2c)。为了评估年表的质量,基于标准化年表计算出平均敏感度、信噪比、样本间相关系数等统计特征值。结果表明(表1),统计特征值均在较高的水平,研究区青海云杉年轮指数包含了强烈的气候信号,所选用的树种适合进行树木年轮气候重建分析。
图2 贺兰山青海云杉标准化年表及样本量

注:SSS为子样本信号强度。

Fig. 2 Standardized chronology and sample size of Picea crassifolia in Helan Mountains

表1 贺兰山青海云杉标准化年表统计指标及统计值

Tab. 1 Statistical indices and values of Picea crassifolia standardized chronology in Helan Mountains

统计指标 统计值
平均数 0.999
中位数 0.990
标准差 0.304
峰度 1.490
偏度 0.634
斜率 0.000
一阶自相关系数 0.782
各序列与主序列间平均相关系数 0.524
树间平均相关系数 0.454
信噪比 18.210
样本总体代表性 0.948
平均敏感度 0.452
子样本系数>0.85的第一年 1815

1.4 气候数据

本次研究收集了银川气象站(38°29′N,106°13′E,海拔1111.4 m)1956—2016年的平均气温、平均最低气温、平均最高气温和平均降水的年、月数据(图3),数据来源于中国国家气象信息中心(http://data.cma.cn/)。
图3 1956—2016年银川气象站逐月平均3类气温及降水量分布

Fig. 3 Monthly average of three categories of temperature and prepcipitation distribution at Yinchuan meteorological station from 1956 to 2016

1.5 数据分析方法

采用皮尔逊相关法[32]分析上述气象资料和STD年表的相关性,并利用线性回归法[33]重建研究区气温序列。用分周期检定试验split-sample[34]检验模型的完整性和可靠性,该检验是年轮气象学中常用的方法,计算的统计参数有相关系数(r)、R-squared(R2)、符号检验(ST)等。对于气温重建序列的突变检验,采用Mann-Kendall非参数统计法[35]。为研究气温变化趋势,用Z-score法[36]进行重建气温序列的标准化:
Z-score=(T-MN)/SD
式中:T为重建值;MN为平均值;SD为标准差。使用变异系数(Cv[37]表示气温变化剧烈程度:
Cv=|SD/MN|
Cv值越大,表明气温变化越剧烈。已知重建序列的均值(mean)和标准差(σ),将气温超过mean+0.5σ的年份定义为暖期,低于mean-0.5σ的年份定义为冷期;将气温超过mean+2σ的年份定义为极暖年,低于mean-2σ的年份定义为极冷年。利用MATLAB软件进行Morlet小波分析[38],以探究重建序列的变化周期及其具体分布年代。

2 结果与分析

2.1 树木径向生长与气候的关系

通过对树木生长与气候因子的相关分析和响应分析,确定所要重建的气候要素,其良好的相关性是保证重建序列可靠性的前提。根据银川气象站1956—2016年的气象资料与青海云杉树轮宽度指数标准年表进行Pearson相关分析,各气象因子与树轮宽度标准年表的相关性如图4a~b所示,从整体上看,年表序列与气温因子的相关系数高于降水量因子,青海云杉标准年表与年平均最低气温的相关性(r=-0.80)通过99%的置信水平;与3类气温月序列呈显著负相关(P<0.05),其中6—12月最低气温序列对树木径向生长的响应强于其他月份;春夏两季最低气温对青海云杉生长的限制作用较强,相关系数通过95%的显著性检验,而秋冬两季气温对树木生长的响应较弱,相关性未达到95%的置信水平。降水量年、季、月序列与树木年轮的相关性不显著,表明水分不是树木生长的限制因子;综上所述,青海云杉径向生长的主要促进因子是年平均最低气温。
图4 青海云杉年轮指数与1956—2016年年、季、月气象要素相关性

Fig. 4 Correlation between Picea crassifolia tree-ring index and meteorological elements on annual, seasonal, and monthly basis from 1956 to 2016

2.2 年平均最低气温的重建与特征分析

2.2.1 年平均最低气温的重建

通过对青海云杉树轮宽度指数和气候因子、降水的相关分析,最终选取相关性较好的年平均最低气温序列(r=-0.80,P<0.001)与标准年表重建线性回归方程。重建方程如下:
Tt=-3.669It+5.369
r=-0.80,N=61,R2=0.638,R2adj=0.635,
F=69.639,P<0.0001)
式中:Tt为第t年年平均最低温度(℃);It为第t年年轮指数。
在重建期内(1956—2016年),重建序列很好地反演了原始观测序列,二者在时间尺度上变化趋势具有较好的一致性(图5a);图5b进一步显示了1956—2016年期间实测最低气温和重建最低气温之间的密切关系。为了进一步检验重建方程的可靠性,我们使用分周期检定试验将序列平分为2个时段,即1956—1986年和1987—2016年,且这2个时段互为检验期和校准期,重建方程的校验结果见表2。结果表明在检验期内,误差缩减值检验(RE)和有效系数检验(CE)均为正值,一阶差符号检验(ST1)及原始值符号检验(ST)都达到了0.01显著水平,统计参数均证明重建方程的可靠性。因此,可以利用此方程重建研究区过去202 a的年平均最低气温。
图5 年平均最低气温重建序列与实测序列的对比

Fig. 5 Comparison of reconstructed and measured series of annual average minimum temperature

表2 年平均最低气温重建方程特征参数

Tab. 2 Characteristic parameters of the annual average minimum temperature reconstruction equation

校准期 检验期
年份 r R2 t 年份 r R2 RE CE ST ST1 t
1956—2016 0.799 0.638 7.465
1956—1986 0.707 0.565 5.420 1987—2016 0.883 0.780 0.345 0.760 23+/7- 19+/10- 5.377
1987—2016 0.839 0.780 4.543 1956—1986 0.752 0.565 0.941 0.494 22+/9- 22+/8- 5.758

注:r为相关系数;R2为决定系数;t为乘积平均值;RE为误差缩减值检验;CE为有效系数检验;ST为原始值符号检验;ST1为一阶差符号检验。

2.2.2 年平均最低气温的重建序列的特征分析

贺兰山年平均最低气温重建序列时间变化情况及特征分析如图6所示,采用Mann-Kendall非参数统计法对重建序列进行气温突变检验,结果显示年平均最低气温在1815—2016年间发生了3次突变,分别出现在1850、1897年和1992年(图6a),在气温下降和上升过程中交替出现;此外,本文通过计算Z-score多年均值来对比重建气温在不同年代的变化情况(图6c)。近2个世纪以来,该地区共经历了3个暖期(1859—1867年、1871—1882年、1981—2016年)以及2个冷期(1815—1846年、1937—1956年),分别占重建年份的23.6%和19.8%,并且出现了13个极冷年和6个极暖年(图6d表3)。
图6 贺兰山年平均最低气温重建序列变化特征

Fig. 6 Characteristics of the reconstructed series of annual average minimum temperature in Helan Mountains

表3 重建的年平均最低气温极暖、极冷出现年份及对应气温

Tab. 3 Years and corresponding temperatures of extremely warm and cold events in the reconstructed annual average minimum temperature series

极冷年 极暖年
年份 气温/℃ 年份 气温/℃ 年份 气温/℃
1817 -1.104 1831 -0.944 1861 4.656
1821 -0.966 1834 -1.205 1865 4.708
1826 -1.692 1839 -1.669 2007 4.769
1827 -1.038 1840 -1.502 2014 4.944
1828 -1.647 1841 -0.832 2015 4.837
1829 -2.241 1842 -0.526 2016 4.714
1830 -0.922 - - - -
将重建序列按变化趋势大致可划分为4个时期(图6b),各时期重建序列的变化率如图7所示;首先是1815—1831年,平均最低气温多年均值达到全序列最低值,极冷年在这一时期集中出现,序列波动较大(Cv=24.50%),人们将这一时期称为小冰期[39];从1831年开始,年平均最低气温进入快速上升阶段,序列变化剧烈程度达全序列的峰值(26.80%),气温迅速从冷期转变为暖期,并在1850年发生第一次突变,标志着首个冷期结束,亦标志着首个暖期开始,此过程共持续36 a;重建气温经过短暂的暖期后再次开始下降,但较之前序列波动不明显(Cv=11.89%),2个连续短暂暖期在这一时期出现,第二个暖期结束约15 a后,气温发生第二次突变(1897年),但气温没有回升趋势,直至20世纪50年代初期,年平均最低气温开始缓慢回升(Cv=10.54%),序列最后一次突变是在1992年,标志着最后一个暖期的开始,并21世纪初期出现多个极暖年。
图7 贺兰山年平均最低气温变化率分析

Fig. 7 Analysis of the change rate of annual average minimum temperature in Helan Mountains

利用Morlet连续小波变换对气温重建序列进行周期分析(图8),结果显示研究区年平均最低气温在不同时间尺上的周期震荡和突变特征。图中信号震荡的强弱通过小波系数的大小表示,实部等值线图中虚线表示小波系数实部<0,即气温降低;实线表示小波系数实部>0,即气温升高。由图8a可知,年平均最低气温序列存在多时间尺度特征,形成各种尺度正负相间的震荡中心,存在明显的年代际变化。结合小波方差图(图8b)分析得出重建序列存在3个明显的周期,依次对应6 a、46~56 a、21 a,6 a尺度周期能量波动贯穿于整个时期,气温高低交替频繁,1876年之后强度减弱;46~56 a的年代际尺度周期在1816—1936年和1976—2016年期间能量较强,其间经历了4次冷-暖交替,1815—1840年、1876—1956年为气温下降时段,1840—1866年、1990—2016年为气温上升时段;21 a的年代际尺度周期主要分布在1876—1956年,存在准6次震荡,即出现了6次明显且稳定的冷-暖交替变化。
图8 贺兰山年平最低气温重建序列的小波分析图和小波方差图

Fig. 8 Wavelet analysis and wavelet variance plots of the reconstructed series of annual average minimum temperature in Helan Mountains

由以上分析可知,贺兰山年平均最低气温受大、中、小多种尺度周期波动变化的共同作用,普遍存在6 a、21 a和46~56 a的周期变化。其中6 a周期与南方涛动(SO)比较吻合,21 a周期与太平洋十年涛动(PDO)有关,46~56 a周期与大西洋多年代际振荡(AMO)的周期接近。

2.3 年平均最低气温重建序列空间代表性分析

为了检验贺兰山重建气温序列的空间代表性,将CRU TS4.04格点观测数据集分别与观测及重建的年平均最低气温序列(1956—2016年)进行空间相关分析,结果分析表明(图9),年平均最低气温的重建序列同观测序列都有较好的空间一致性。根据年平均最低气温实测序列与相应CRU格点空间相关分析显示,内蒙古中部地区、宁夏大部分地区以及山西、河北多地都存在显著的(P<0.0.5)相关场,特别是研究区附近,它们在年际变化上具有显著相关性(r=0.62,n=70,P<0.001);此外,重建的年平均最低气温与相应格点气温在1956—2016年的空间相关分析表明,显著(P<0.05)的相关场同样覆盖了很大的区域,但与实测序列相比,显著相关程度大的区域范围较小;这一结果表明,本次重建序列可以跟踪贺兰山周围高频域的大尺度年际气温变化。
图9 贺兰山年平均最低气温的空间相关分析

注:该图基于国家测绘地理信息局标准地图服务网站下载的审图号为GS(2023)2767号的标准地图制作,底图边界无修改。

Fig. 9 Spatial correlation analysis of annual average minimum temperature in Helan Mountains

3 讨论

3.1 树木径向生长对气候的响应

基于树轮宽度资料的气候重建不仅使我们能够了解过去气候变化规律和机制,还可以推测未来气候变化的趋势。本文利用青海云杉年轮样本重建了贺兰山202 a平均最低气温,并对其变化规律及驱动因素进行了分析。
已有研究表明气温是树木径向生长的主控因子,其中树木生长对最低气温更为敏感[40];树木的某些生理过程受平均最低气温的调节,如呼吸、树木细胞分裂、养分吸收等[40-42]。最低气温通常发生在夜间,树木在此间进行形成层细胞分裂和木质部细胞的木质化,该过程消耗能量和O2[43];夜间气温降低,可减少呼吸作用对能量的消耗,有利于根的生长和细胞分裂素的合成[44];随着平均最低气温的升高,树木呼吸的养分消耗增加,对树木径向生长产生负面影响,形成窄轮[45];另一方面,气温的升高也会使土壤水分的蒸散量增加,容易使浅根青海云杉受到水分亏缺的影响。研究区最低气温在20世纪中期开始处于上升状态,高温抑制了树木径向生长,所以青海云杉径向生长对气温的响应在年、季、月尺度上呈现负相关关系。我们发现这一现象在乌拉山[46]、大兴安岭[47]、天山[48]等区域结论相似,均呈现出树木径向生长对气温的响应存在负效应,四者仅在时间上存在差异。

3.2 年平均最低气温的重建与其他重建结果及历史事件的比较

为进一步验证重建结果的可靠性,将本次重建序列与空间距离较近的乌拉山地区[45](年序列)和同一纬度的天山地区[49](5—9月)最低气温重建结果进行了对比分析。对3组最低气温重建序列进行冷暖期划分与比较,结果如图10所示,从整体来看,乌拉山和天山最低气温的重建结果与本次重建结果在总体变化趋势上、冷暖期分布上大致相同,尤其是在20世纪末期至今,三者同时捕捉到了气温快速上升这一特点,也表明全球变暖对研究区气候产生了影响。由于地理位置、重建序列、树种以及研究区气候类型等条件的不同,3个重建结果在某些时段内有差异,如在19世纪中期,三者虽均呈现出先降温后升温的趋势,但本次重建序列变化程度较大,并且伴随大量极暖年和极冷年出现,表明研究区由于季风与非季风过渡带气候的复杂性,导致其最低气温年际变化率大;同样,在20世纪初和20世纪30—60年代,三者都发生了气温上升到下降的过程,乌拉山地区和天山地区都处于冷、暖期,而研究区气温只出现小幅波动。
图10 本次重建结果与其他重建结果对比

Fig. 10 Comparison of current reconstruction results with other reconstructions

将重建结果与内蒙古气象灾害大典[50]进行对比,发现本次重建序列记录的2个冷期中有多个年份可以在其中找到相关记载[50],包括霜冻灾害、大雪灾害等,均有详细记录;如巴彦淖尔在1940、1947年和1951年分别发生了雪灾、冻灾、霜冻等气象灾害,造成大量牲畜和农作物死亡;呼和浩特在1935年和1948年分别发生了秋冻和春冻,种植的谷物遭受霜冻灾害,粮食减产;1812、1817、1833年和1836年,榆林、大同、山西朔州等地均发生了霜冻,大量农作物受损,粮食歉收;1952年5月底,中西部地区发生春霜冻,大量农作物损伤,同年10月初,中西部地区再次发生寒潮,其中西部地区出现强冷空气,在48 h之内快速降温,影响当地居民正常出行;在1951—2000年间内蒙古寒潮受灾地区以中部地区为主,其次是东部地区,出现频率最少的是西部地区,其中阿拉善盟几乎没有出现过寒潮现象,这与本次重建结果显示的冷期序列相吻合。综上所示,本次年平均最低气温重建结果是可靠的,且可以揭示该区域气候变化特征。

4 结论

(1) 本文利用青海云杉建立了1798—2016年的树木年轮宽度年表,探讨了树轮宽度与气温、降水的相关性。分析结果表明青海云杉径向生长与该地的年平均最低气温(r=-0.80,P<0.001)关系密切,具有明确的树木生理学意义。
(2) 用青海云杉标准年表重建1815—2016年贺兰山年平均最低气温序列,重建序列具有较好的可靠性(RE=0.808,CE=0.482)。重建结果表明,200 a来,贺兰山年平均最低气温经历了3个暖期(1859—1867年、1871—1882年、1981—2016年)以及2个冷期(1815—1846年、1937—1956年)。
(3) 重建气温序列在6 a、21 a和46~56 a的周期分布特征,南方涛动(SO)、太平洋十年涛动(PDO)和大西洋多年代际涛动(AMO)是其周期变化驱动因子。
(4) 本文建立的青海云杉树轮宽度年表丰富了全球年轮库,在季风与非季风分界线上重建了长历时平均最低气温序列,该序列对内蒙古自治区、宁夏回族自治区等地区的气温变化具有很好的空间代表性,揭示了两百年来贺兰山脉的气候变化特征,有助于更好地理解区域气候变化和为后续的研究提供参考。
[1]
王婷, 于丹, 李江风, 等. 树木年轮宽度与气候变化关系研究进展[J]. 植物生态学报, 2003, 27(1): 23-33.

DOI

[Wang Ting, Yu Dan, Li Jiangfeng, et al. Advances in research on the relationship between climatic change and tree-ring width[J]. Acta Phytoecologica Sinica, 2003, 27(1): 23-33.]

[2]
IPCC. Climate change 2021:The physical science basis. Contribution of working group I to the sixth assessment report of the intergovernmental panel on climate change[R/OL]. [2021-08-09]. https://report.ipcc.ch/ar6/wg1/IPCC_AR6_WGI_FullReport.pdf.

[3]
刘可祥, 张同文, 张瑞波, 等. 伊犁山区雪岭云杉(Picea schrenkiana)不同树干高度树木径向生长特征及其对气候响应[J]. 干旱区地理, 2022, 45(4): 1010-1021.

[Liu Kexiang, Zhang Tongwen, Zhang Ruibo, et al. Characteristics of radial growth at different trunk heights of Picea schrenkiana and its climate response in the mountainous area of the Ili Region[J]. Arid Land Geography, 2022, 45(4): 1010-1021.]

[4]
Liu Y. Amplitudes, rates, periodicities and causes of temperature variations in the past 2485 years and future trends over the central-eastern Tibetan Plateau[J]. Chinese Science Bulletin, 2011, 56(28-29): 2986-2994.

[5]
魏英楠, 马龙, 孙柏林, 等. 基于红皮云杉(Picea koraiensis)重建大兴安岭南麓历史径流量[J]. 干旱区地理, 2023, 46(8): 1269-1278.

[Wei Yingnan, Ma Long, Sun Bolin, et al. Reconstruction of historical runoff in the southern foothills of the Da Hinggan Ling Mountains based on Picea koraiensis[J]. Arid Land Geography, 2023, 46(8): 1269-1278.]

[6]
孙国华, 步之媛. 长历史时间尺度水文气候学研究进展[J]. 内蒙古水利, 2020(5): 10-11.

[Sun Guohua, Bu Zhiyuan. Research progress of hydroclimatology on long historical time scale[J]. Inner Mongolia Water Resources, 2020(5): 10-11.]

[7]
Malik R, Sukumar R. June-July temperature reconstruction of Kashmir valley from tree rings of Himalayan Pindrow Fir[J]. Atmosphere, 2021, 12(410): 1-12.

[8]
Stambaugh M C, Bigelow S W, Abadir E R. Linkages between forest growth, climate, and agricultural production are revealed through analysis of seasonally-partitioned longleaf pine (Pinus palustris Mill.) tree rings[J]. Dendrochronologia, 2020, 65: 125801, doi: 10.1016/j.dendro.2020.125801.

[9]
王丽丽. 利用兴安落叶松树轮最大晚材密度重建大兴安岭北部5—8月气温变化[J]. 科学通报, 2012, 57: 2007-2014.

[Wang Lili. Reconstructing mean maximum temperatures of May-August from tree-ring maximum density in north Da Hinggan Mountains, China[J]. Chinese Science Bulletin, 2012, 57: 2007-2014.]

[10]
华亚伟, 张红娟, 刘康. 基于油松树轮重建陕西省镇安县165年以来3—4月平均最高气温[J]. 应用生态学报, 2020, 31(2): 381-387.

DOI

[Hua Yawei, Zhang Hongjuan, Liu Kang. Reconstruction of the March-April average maximum air temperature over 165 years based on Pinus tabuliformis tree-rings of Zhen’an County, Shaanxi Province, China[J]. Chinese Journal of Applied Ecology, 2020, 31(2): 381-387.]

DOI

[11]
Lopez L, Stahle D, Villalba R, et al. Tree ring reconstructed rainfall over the southern Amazon Basin[J]. Geophysical Research Letters, 2017, 44(14): 7410-7418.

[12]
Pearl J K, Anchukaitis K J, Donnelly J P, et al. A late Holocene subfossil Atlantic white cedar tree-ring chronology from the northeastern United States[J]. Quaternary Science Reviews, 2020, 228(C): 106104, doi: 10.1016/j.quascirev.2019.106104.

[13]
Buckley B M, Wilson R J, Kelly P E, et al. Inferred summer precipitation for southern Ontario back to AD 610, as reconstructed from ring widths of Thuja occidentalis[J]. Canadian Journal of Forest Research, 2004, 34(12): 2541-2553.

[14]
Pritzkow C, Wazny T, Heuner K U, et al. Minimum winter temperature reconstruction from average earlywood vessel area of European oak (Quercus robu) in N-Poland[J]. Palaeogeography, Palaeoclimatology, Palaeoecology, 2016, 449: 520-530.

[15]
Gregory C W, Olga S, Rosanne D A, et al. Reconstructed summer temperatures over the last 400 years based on larch ring widths: Sakhalin Island, Russian Far East[J]. Climate Dynamics Observational Theoretical & Computational Research on the Climate System, 2014, 45(1-2): 397-405.

[16]
Imnek V, Vacek Z, Vacek S, et al. Tree rings of European Beech (Fagus Sylvatica L.) Indicate the relationship with solar cycles during climate change in central and southern Europe[J]. Forests, 2021, 12(3): 259, doi: 10.3390/F12030259.

[17]
Mohsen A, Jassi G, Kambiz P, et al. Multi-centennial reconstruction of drought events in south-western Iran using tree rings of Mediterranean cypress (Cupressus sempervirens L.)[J]. Palaeogeography, Palaeoclimatology, Palaeoecology, 2021(21): 110296, doi: 10.1016/j.palaeo.2021.110296.

[18]
Ünal A, Nesibe K, Arailym K, et al. October to July precipitation reconstruction for Burabai region (Kazakhstan) since 1744[J]. International Journal of Biometeorology, 2020, 64(5): 803-813.

DOI PMID

[19]
Hiroyuki T, Takeshi N, Koji Y, et al. Summer relative humidity in northern Japan inferred from δ18O values of the tree ring in (1776—2002 AD): Influence of the paleoclimate indices of atmospheric circulation[J]. Journal of Geophysical Research, 2008, 113: D18103, doi: 10.1029/2007JD009080.

[20]
Huang R, Zhu H, Liang E, et al. A tree ring-based winter temperature reconstruction for the southeastern Tibetan Plateau since 1340 CE[J]. Climate Dynamics, 2019, 53(5): 3221-3233.

[21]
赵晓恩, 岳伟鹏, 高志鸿, 等. 河谷澜沧黄杉指示的青藏高原东南地区过去205年干湿变化[J]. 应用生态学报, 2021, 32(10): 3643-3652.

DOI

[Zhao Xiao’en, Yue Weipeng, Gao Zhihong, et al. Changes of wet and dry climate in the past 205 years indicated by Pseudotsuga forrestii of river valley from southeastern Tibetan Plateau, China[J]. Chinese Journal of Applied Ecology, 2021, 32(10): 3643-3652.]

DOI

[22]
Keyimu M, Li Z, Zhang G, et al. Tree ring-based minimum temperature reconstruction in the central Hengduan Mountains, China[J]. Theoretical and Applied Climatology, 2020, 141(1/2): 359-370.

[23]
Liu Y, Cai Q, Shi J, et al. Seasonal precipitation in the south-central Helan Mountain region, China, reconstructed from tree-ring width for the past 224 years[J]. Canadian Journal of Forest Research, 2005, 35(10): 2403-2412.

[24]
陈峰, 袁玉江, 魏文寿, 等. 树轮记录的贺兰山北部5—7月PDSI变化[J]. 气候变化研究进展, 2010, 6(5): 344-348.

[Chen Feng, Yuan Yujiang, Wei Wenshou, et al. Long-term drought severity variations recorded in tree rings in the northern Helan Mountains[J]. Advances in Climate Change Research, 2010, 6(5): 344-348.]

[25]
Li J, Chen F, Cook E R, et al. Drought reconstruction for north central China from tree rings: The value of the Palmer drought severity index[J]. International Journal of Climatology, 2007, 27(7): 903-909.

[26]
陈峰, 袁玉江, 魏文寿, 等. 树轮记录的贺兰山北部近208年5—7月温度变化[J]. 应用气象学报, 2011, 22(4): 463-471.

[Chen Feng, Yuan Yujiang, Wei Wenshou, et al. May-July temperature variability since 1801 infered from tree rings of Pinus tabuliformis of Helan Mountains in China[J]. Journal of Applied Meteorological Science, 2011, 22(4): 463-471.]

[27]
Malcolm K H, Alexander O, Andrew G B, et al. Different climate responses of spruce and pine growth in northern European Russia[J]. Dendrochronologia, 2019, 56: 125601, doi: 10.1016/j.dendro.2019.05.005.

[28]
詹思敏, 王可逸, 张凌楠, 等. 祁连山东部不同树种径向生长对气候因子的响应[J]. 生态学杂志, 2019, 38(7): 2007-2014.

[Zhan Simin, Wang Keyi, Zhang Lingnan, et al. Species-specific growth responses to climatic factors in the eastern Qilian Mountains[J]. Chinese Journal of Ecology, 2019, 38(7): 2007-2014.]

[29]
Zhang R B, Yuan Y J, Yu S L, et al. Past changes of spring drought in the inner Tianshan Mountains, China, as recorded by tree rings[J]. Boreas, 2017, 46(4): 688-696.

[30]
Huang R, Zhu H, Liang E, et al. A tree-ring-based summer (June-July) minimum temperature reconstruction for the western Kunlun Mountains since AD 1681[J]. Theoretical and Applied Climatology, 2019, 138(1-2): 673-682.

DOI

[31]
Shen C C, Wang L L, Li M Y. The altitudinal variability and temporal instability of the climate-tree-ring growth relationships for Changbai larch (Larix olgensis Henry) in the Changbai Mountains area, Jilin, Northeastern China[J]. Trees, 2016, 30(3): 901-912.

[32]
Keyimu M, Li Z S, Zhang G S, et al. Tree ring-based minimum temperature reconstruction in the central Hengduan Mountains, China[J]. Theoretical and Applied Climatology, 2020, 141(1/2): 359-370.

[33]
Liu Y, Wang L, Li Q, et al. Asian summer monsoon-related relative humidity recorded by tree ring δ18O during last 205 years[J]. Journal of Geophysical Research: Atmospheres, 2019, 124(17/18): 9824-9838.

[34]
Wang T, Bao A, Xu W Q, et al. Tree-ring-based assessments of drought variability during the past 400 years in the Tianshan Mountains, arid Central Asia[J]. Ecological Indicators, 2021, 126: 107702, doi: 10.1016/j.ecolind.2021.107702.

[35]
Zhao Y J, Keyimu M, Li Z S, et al. Summer mean temperature reconstruction during the past 285 years based on tree-ring in northern Gaoligong Mountains, northwestern Yunnan of China[J]. Geografiska Annaler: Series A, Physical Geography, 2021, 103(1): 69-82.

[36]
肖健宇, 张文艳, 牟玉梅, 等. 树木年轮揭示的东灵山主要树种间干旱耐受性差异[J]. 应用生态学报, 2021, 32(10): 3487-3496.

DOI

[Xiao Jianyu, Zhang Wenyan, Mou Yumei, et al. Differences of drought tolerance of the main tree species in Dongling Mountain, Beijing, China as indicated by tree rings[J]. Chinese Journal of Applied Ecology, 2021, 32(10): 3487-3496.]

DOI

[37]
张辉, 张芸, 胡亚楠, 等. 气候变暖背景下杉木年轮密度对气候因子的响应[J]. 生态学报, 2021, 41(4): 1551-1563.

[Zhang Hui, Zhang Yun, Hu Ya’nan, et al. Response of tree ring density to climatic factors of Cunninghamia lanceolata under climate warming[J]. Acta Ecologica Sinica, 2021, 41(4): 1551-1563.]

[38]
Zhang Y, Shao X M, Yin Z Y, et al. Millennial minimum temperature variations in the Qilian Mountains, China: Evidence from tree rings[J]. Climate of the Past, 2014, 10(5): 1763-1778.

[39]
White P B, Soulé P, Van D G S. Impacts of human disturbance on the temporal stability of climate-growth relationships in a red spruce forest, southern Appalachian Mountains, USA[J]. Dendrochronologia, 2014, 32(1): 71-77.

[40]
Shi C, Masson-Delmotte V D, Li Z S, et al. Unprecedented recent warming rate and temperature variability over the east Tibetan Plateau inferred from alpine treeline dendrochronology[J]. Climate Dynamics, 2015, 45(5-6): 1367-1380.

[41]
Nagavciuc V, Ionita M, Kern Z, et al. A 700 years perspective on the 21st century drying in the eastern part of Europe based on δ18O in tree ring cellulose[J]. Communications Earth & Environment, 2022, 3(1): 277, doi: 10.1038/s43247-022-00605-4.

[42]
Isabella A, Christine L, María E F, et al. A network for advancing dendrochronology, dendrochemistry and dendrohydrology in south America[J]. Tree-Ring Research, 2020, 76(2): 94-101.

[43]
Hosoo Y, Yoshida M, Imai T, et al. Diurnal difference in the amount of immunogold-labeled glucomannans detected with field emission scanning electron microscopy at the innermost surface of developing secondary walls of differentiating conifer tracheids[J]. Planta, 2002, 215: 1006-1012.

PMID

[44]
Jiang Y G, Cao Y T, Zhang J H, et al. A 168-year temperature recording based on tree rings and latitude differences in temperature changes in northeast China[J]. International Journal of Biometeorology, 2021, 65(11): 1-12.

[45]
Yu D P, Wang Q W, Wang Y, et al. Climatic effects on radial growth of major tree species on Changbai Mountain[J]. Annals of Forest Science, 2011, 68(5): 921-933.

[46]
Sun B L, Ma L, Liu T X, et al. Temperature reconstruction based on 361 year old dendrochronology of Platycladus orientalis (L.) franco in the Wula Mountains, China[J]. Quaternary International, 2020, 583: 94-102.

[47]
Jiang Y, Wang Y, Zhang J, et al. Tree-ring reconstruction of June-July mean temperatures in the northern Daxing’an Mountains, China[J]. Geochronometria, 2020, 47(1): 13-22.

[48]
Li T, Liu Y, Cai Q F, et al. Water stress-induced divergence growth of Picea schrenkiana in the western Tianshan and its forcing mechanisms[J]. Forests, 2023, 14(2): 354, doi: 10.3390/f14020354.

[49]
Jiao L, Wang S J, Jiang Y, et al. A 333-year record of the mean minimum temperature reconstruction in the western Tianshan Mountains, China[J]. Geochronometria, 2019, 46(1): 37-48.

[50]
沈建国. 中国气象灾害大典·内蒙古卷[M]. 北京: 气象出版社, 2008.

[Shen Jianguo. China meteorological disaster encyclopedia: Inner Mongolia volume[M]. Beijing: China Meteorological Press, 2008.]

文章导航

/