
|
火红(1995-),女,硕士研究生,主要从事遥感与GIS等方面的研究. E-mail: huohong@idm.cn |
收稿日期: 2023-10-26
修回日期: 2024-03-04
网络出版日期: 2026-03-11
基金资助
第三次新疆综合科学考察项目(2022xjkk0602)
Spatiotemporal distribution characteristics and impact assessment of snow disasters in the Ili region of Xinjiang from 1990 to 2020
Received date: 2023-10-26
Revised date: 2024-03-04
Online published: 2026-03-11
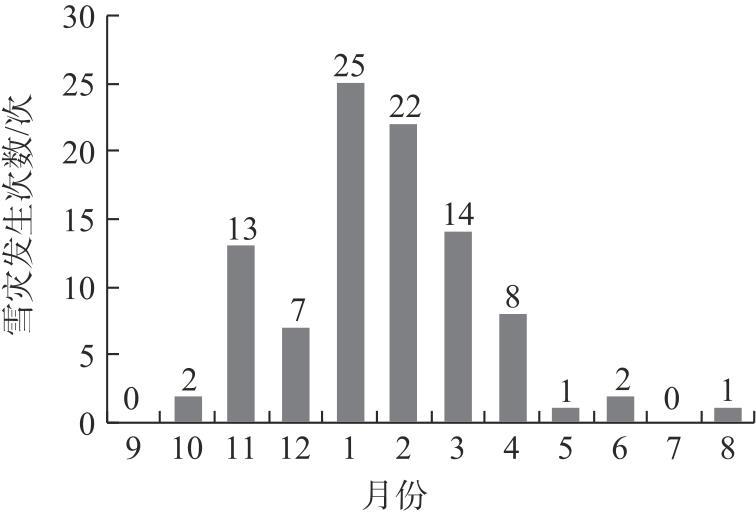
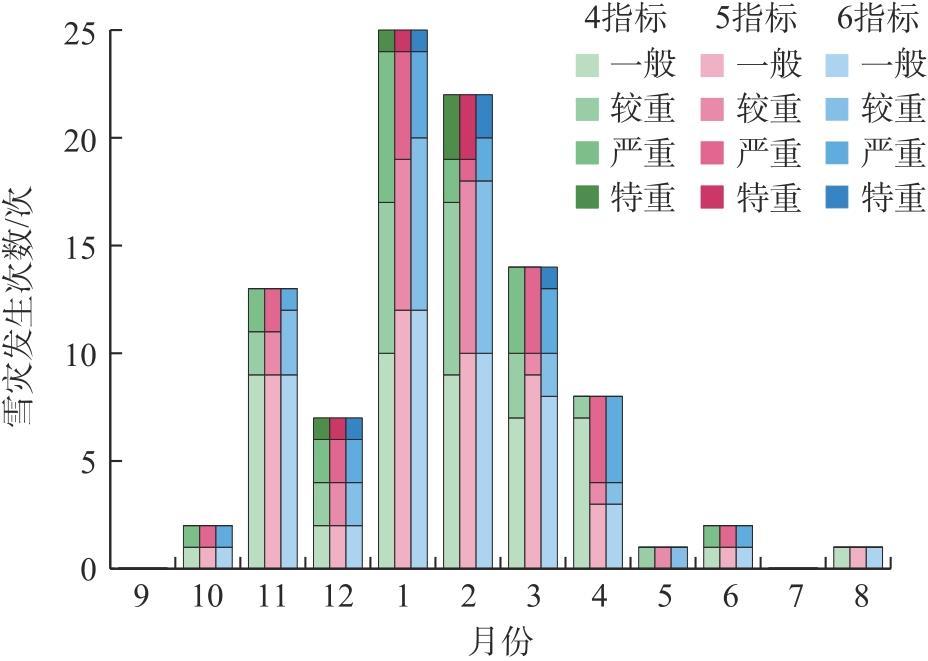
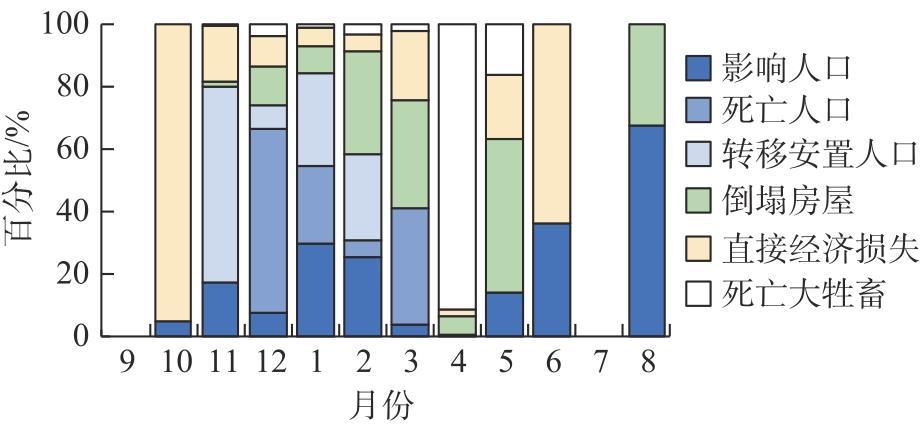
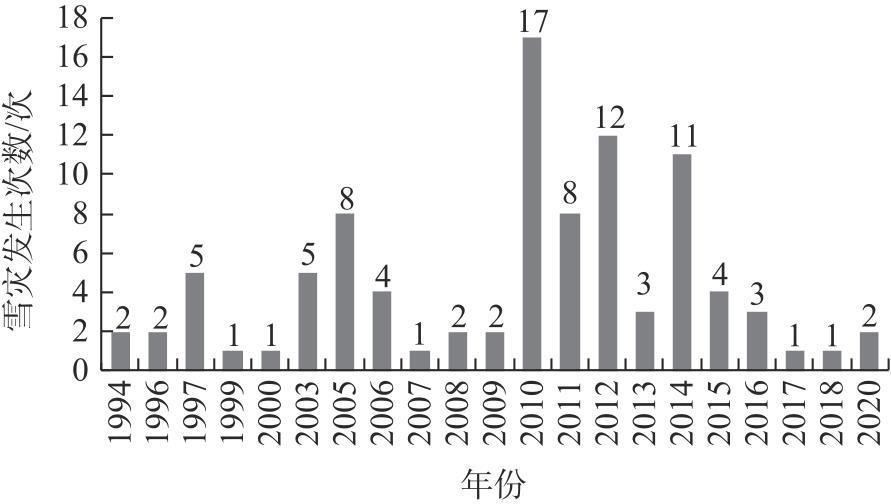
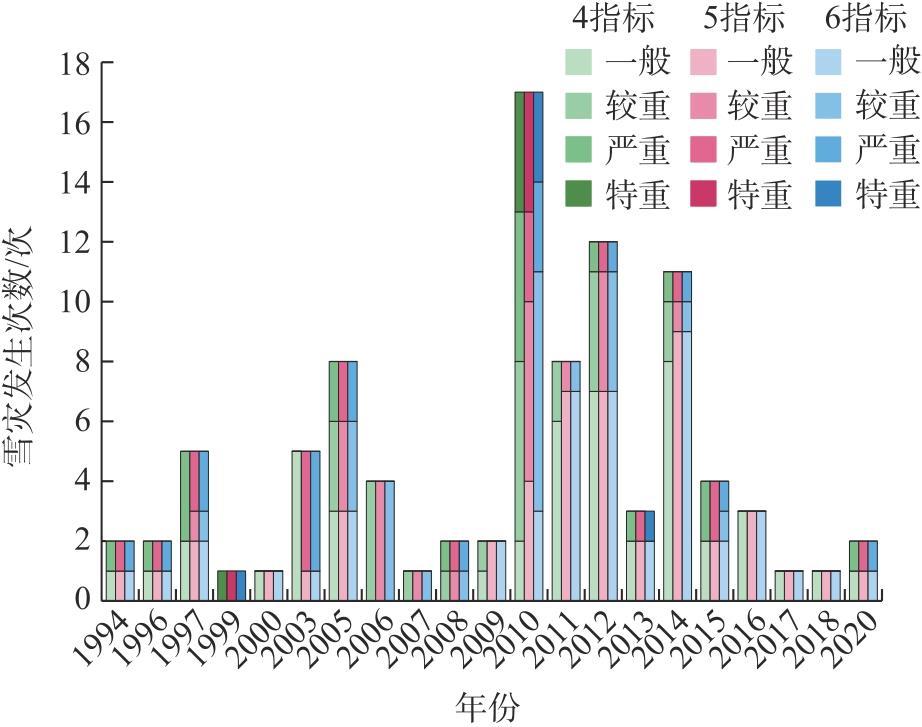
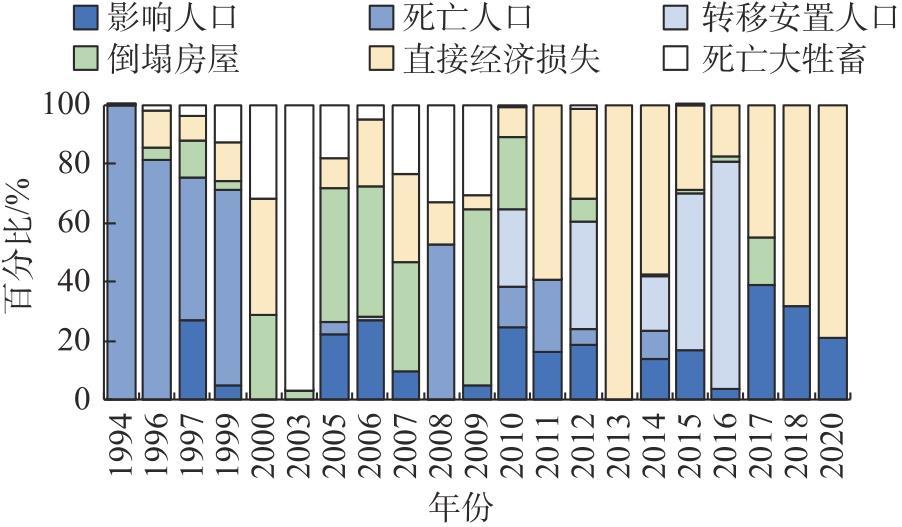
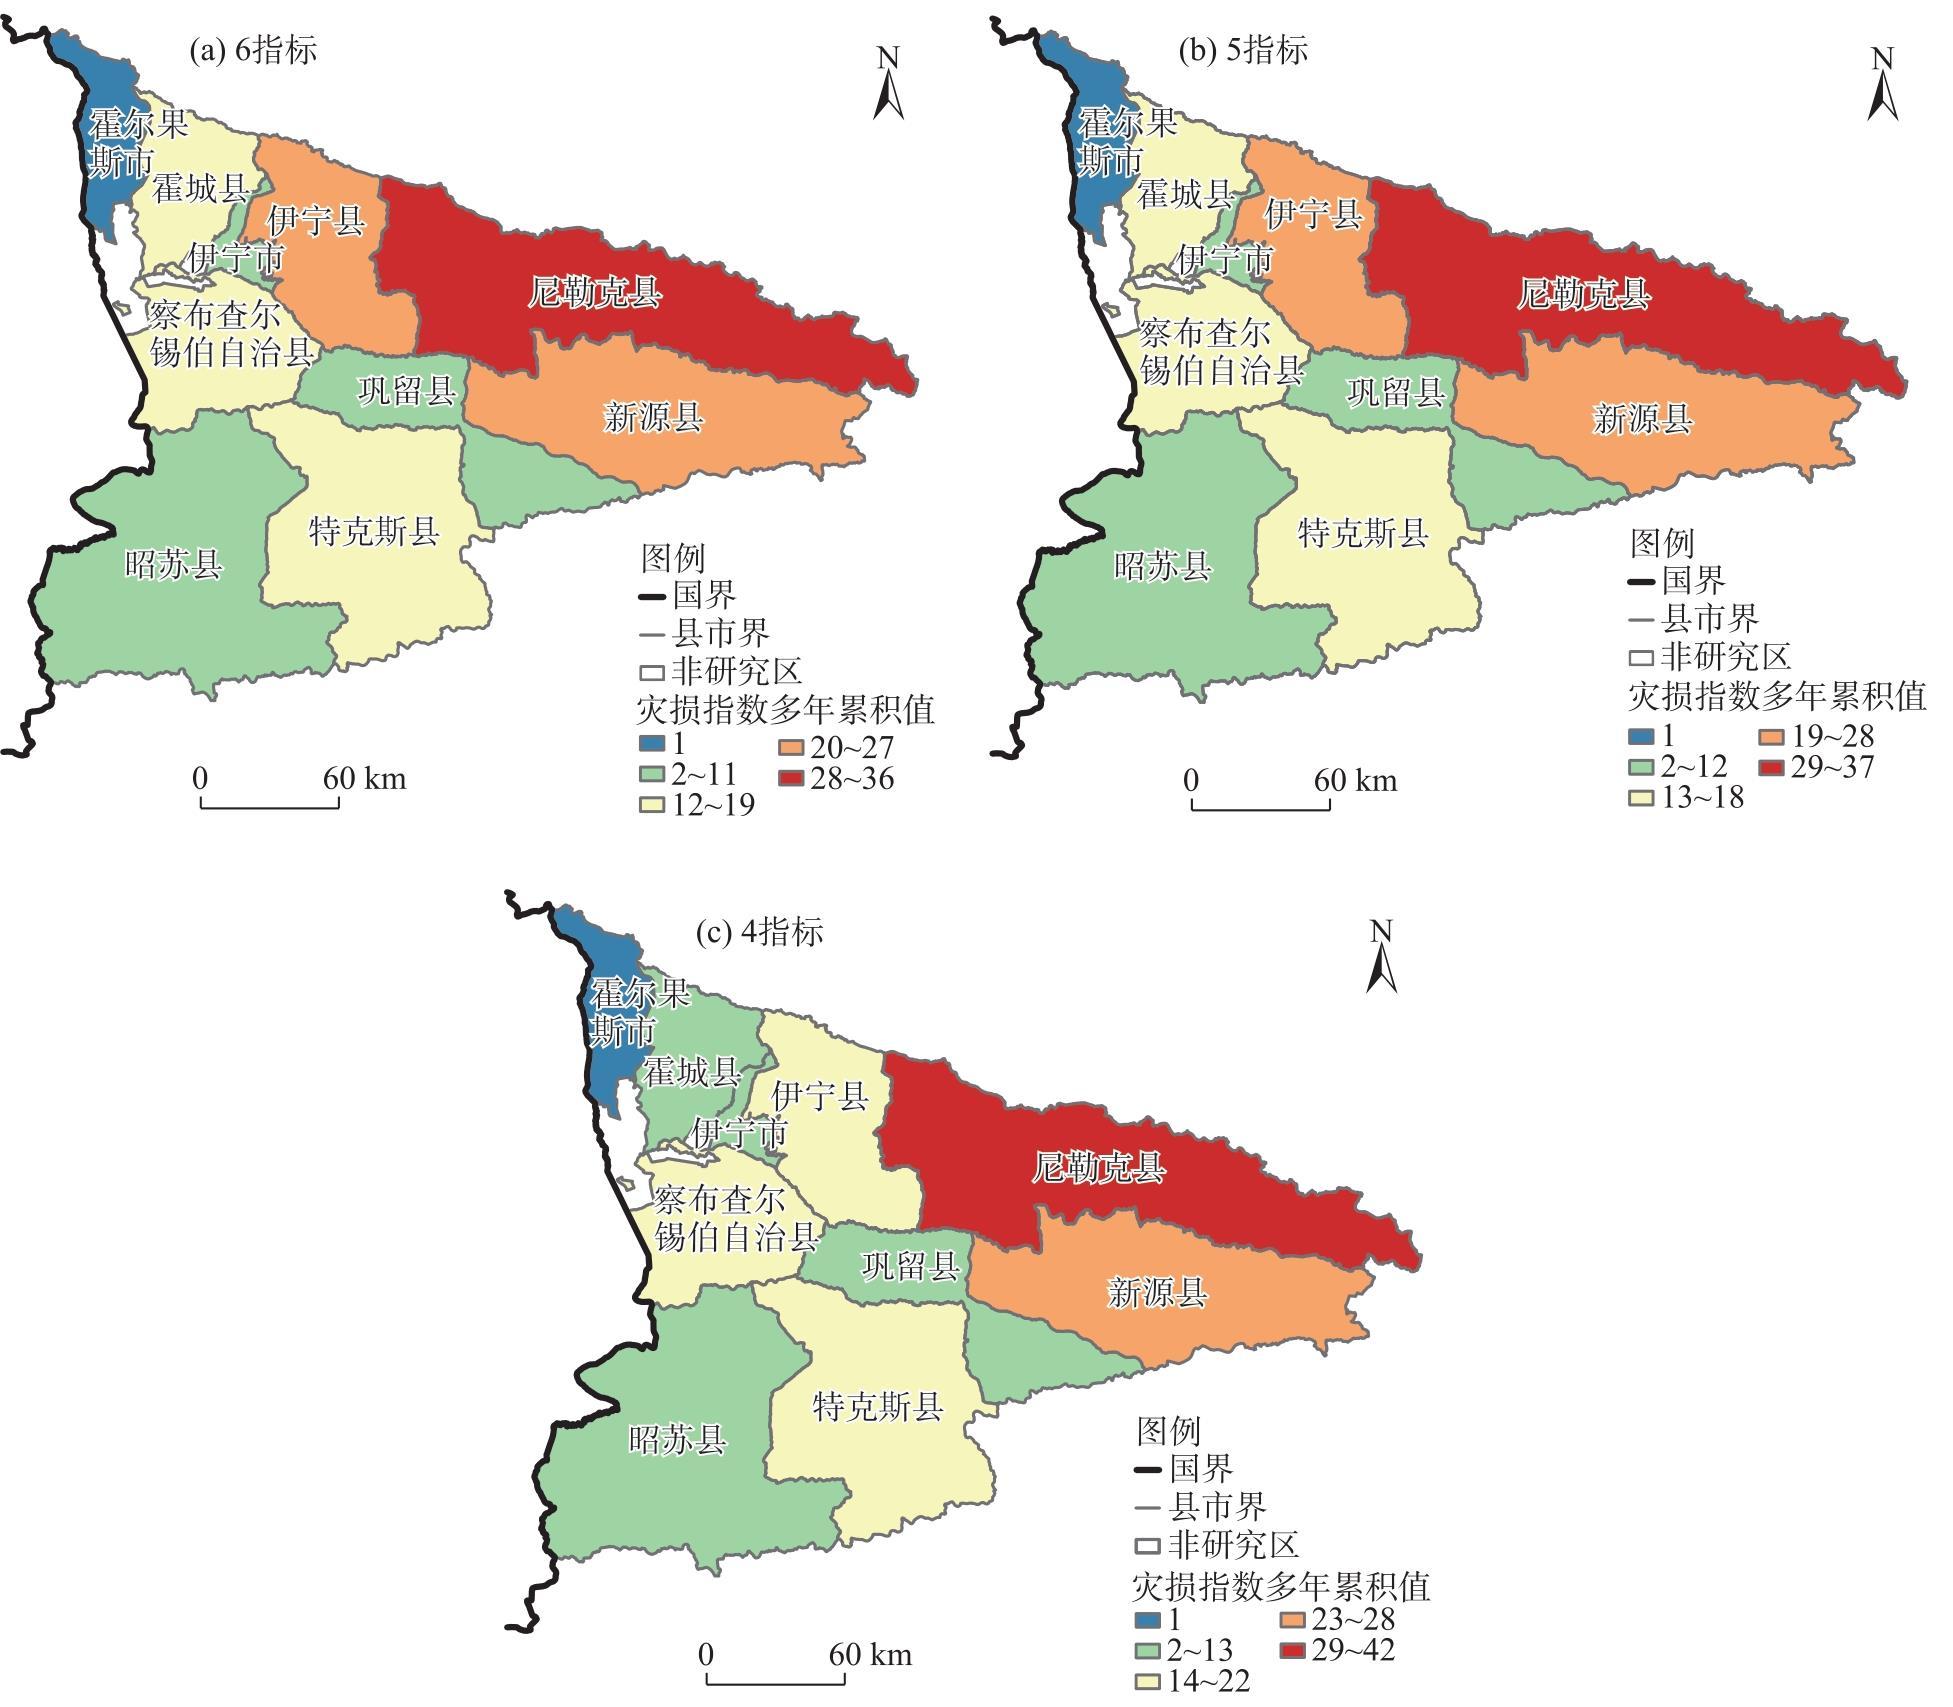
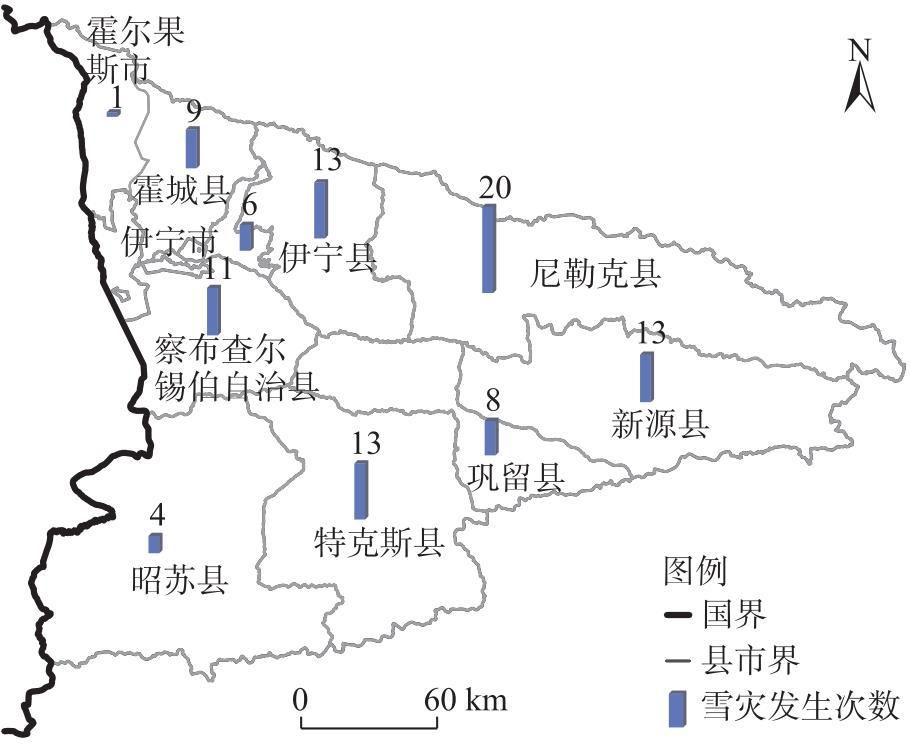
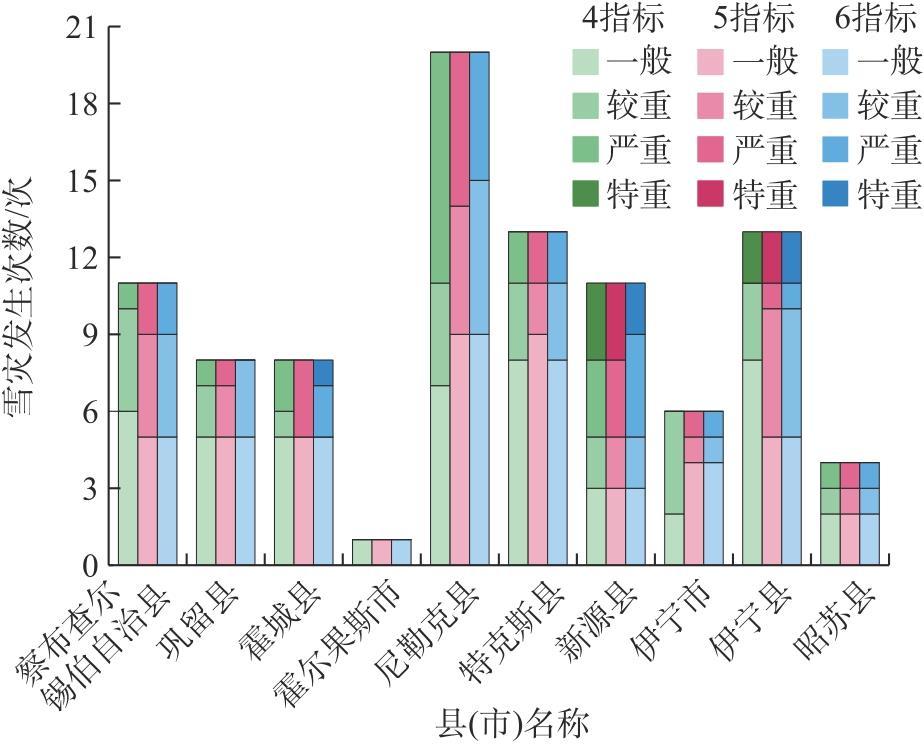
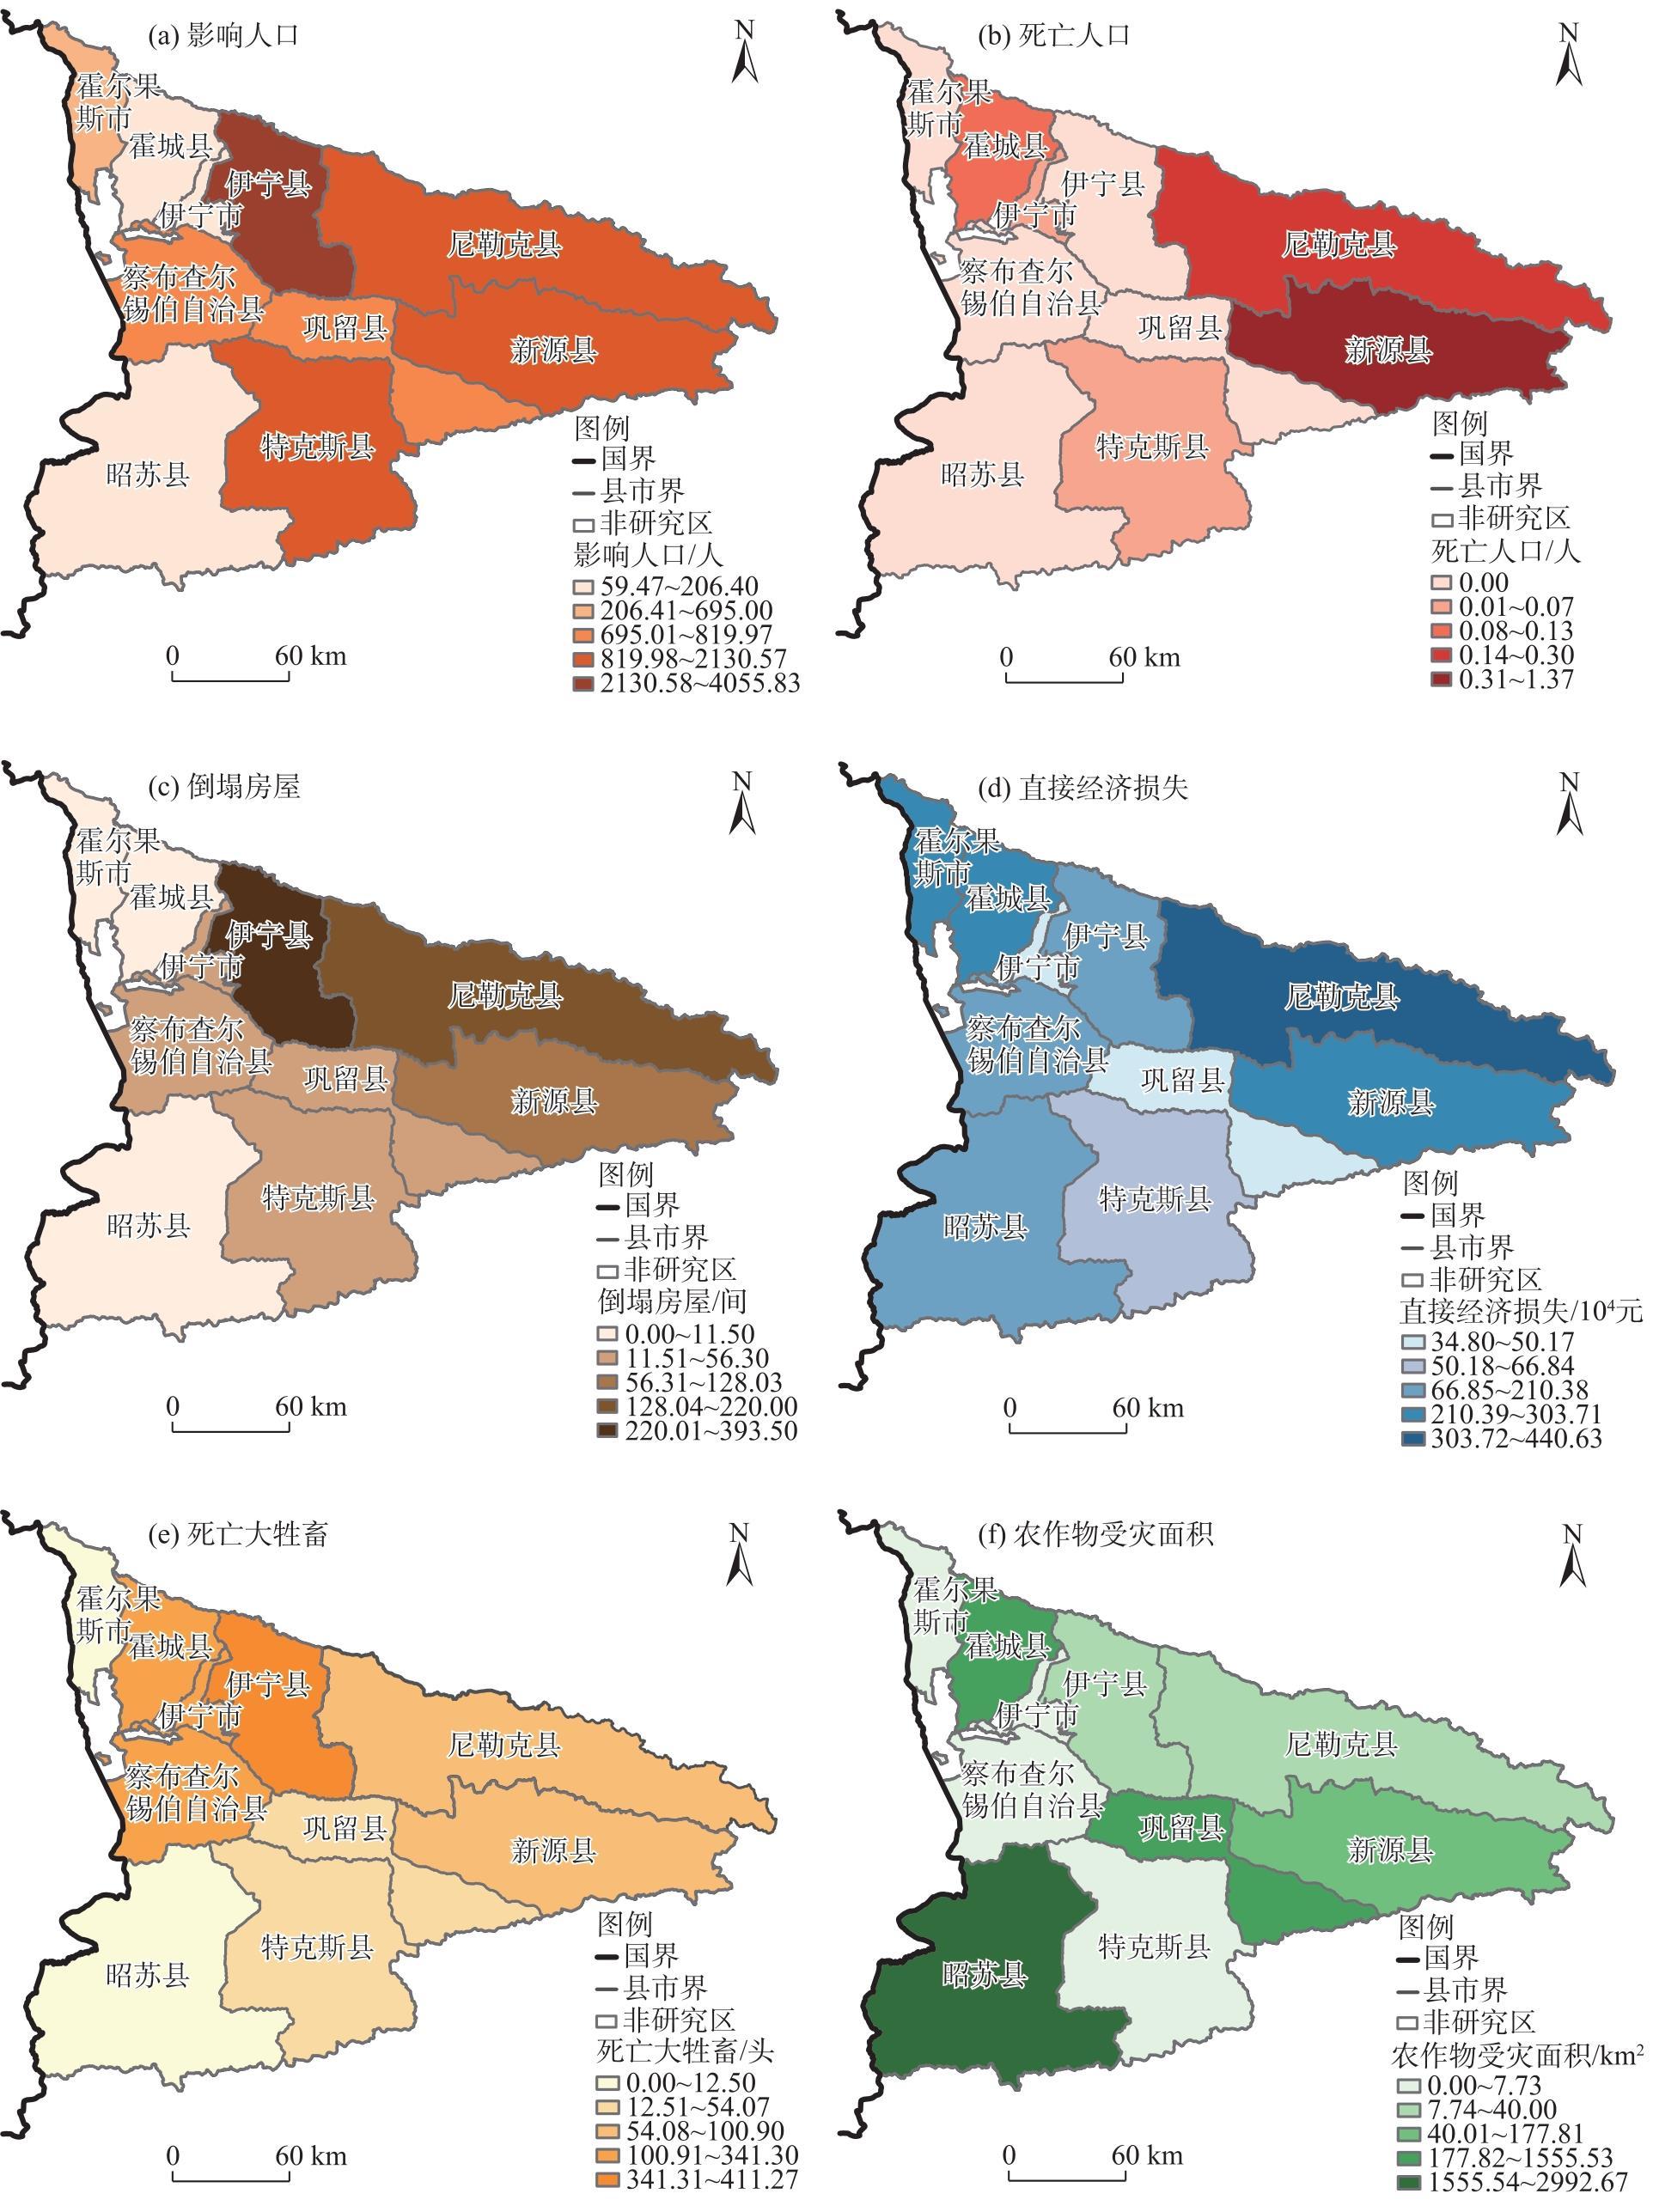
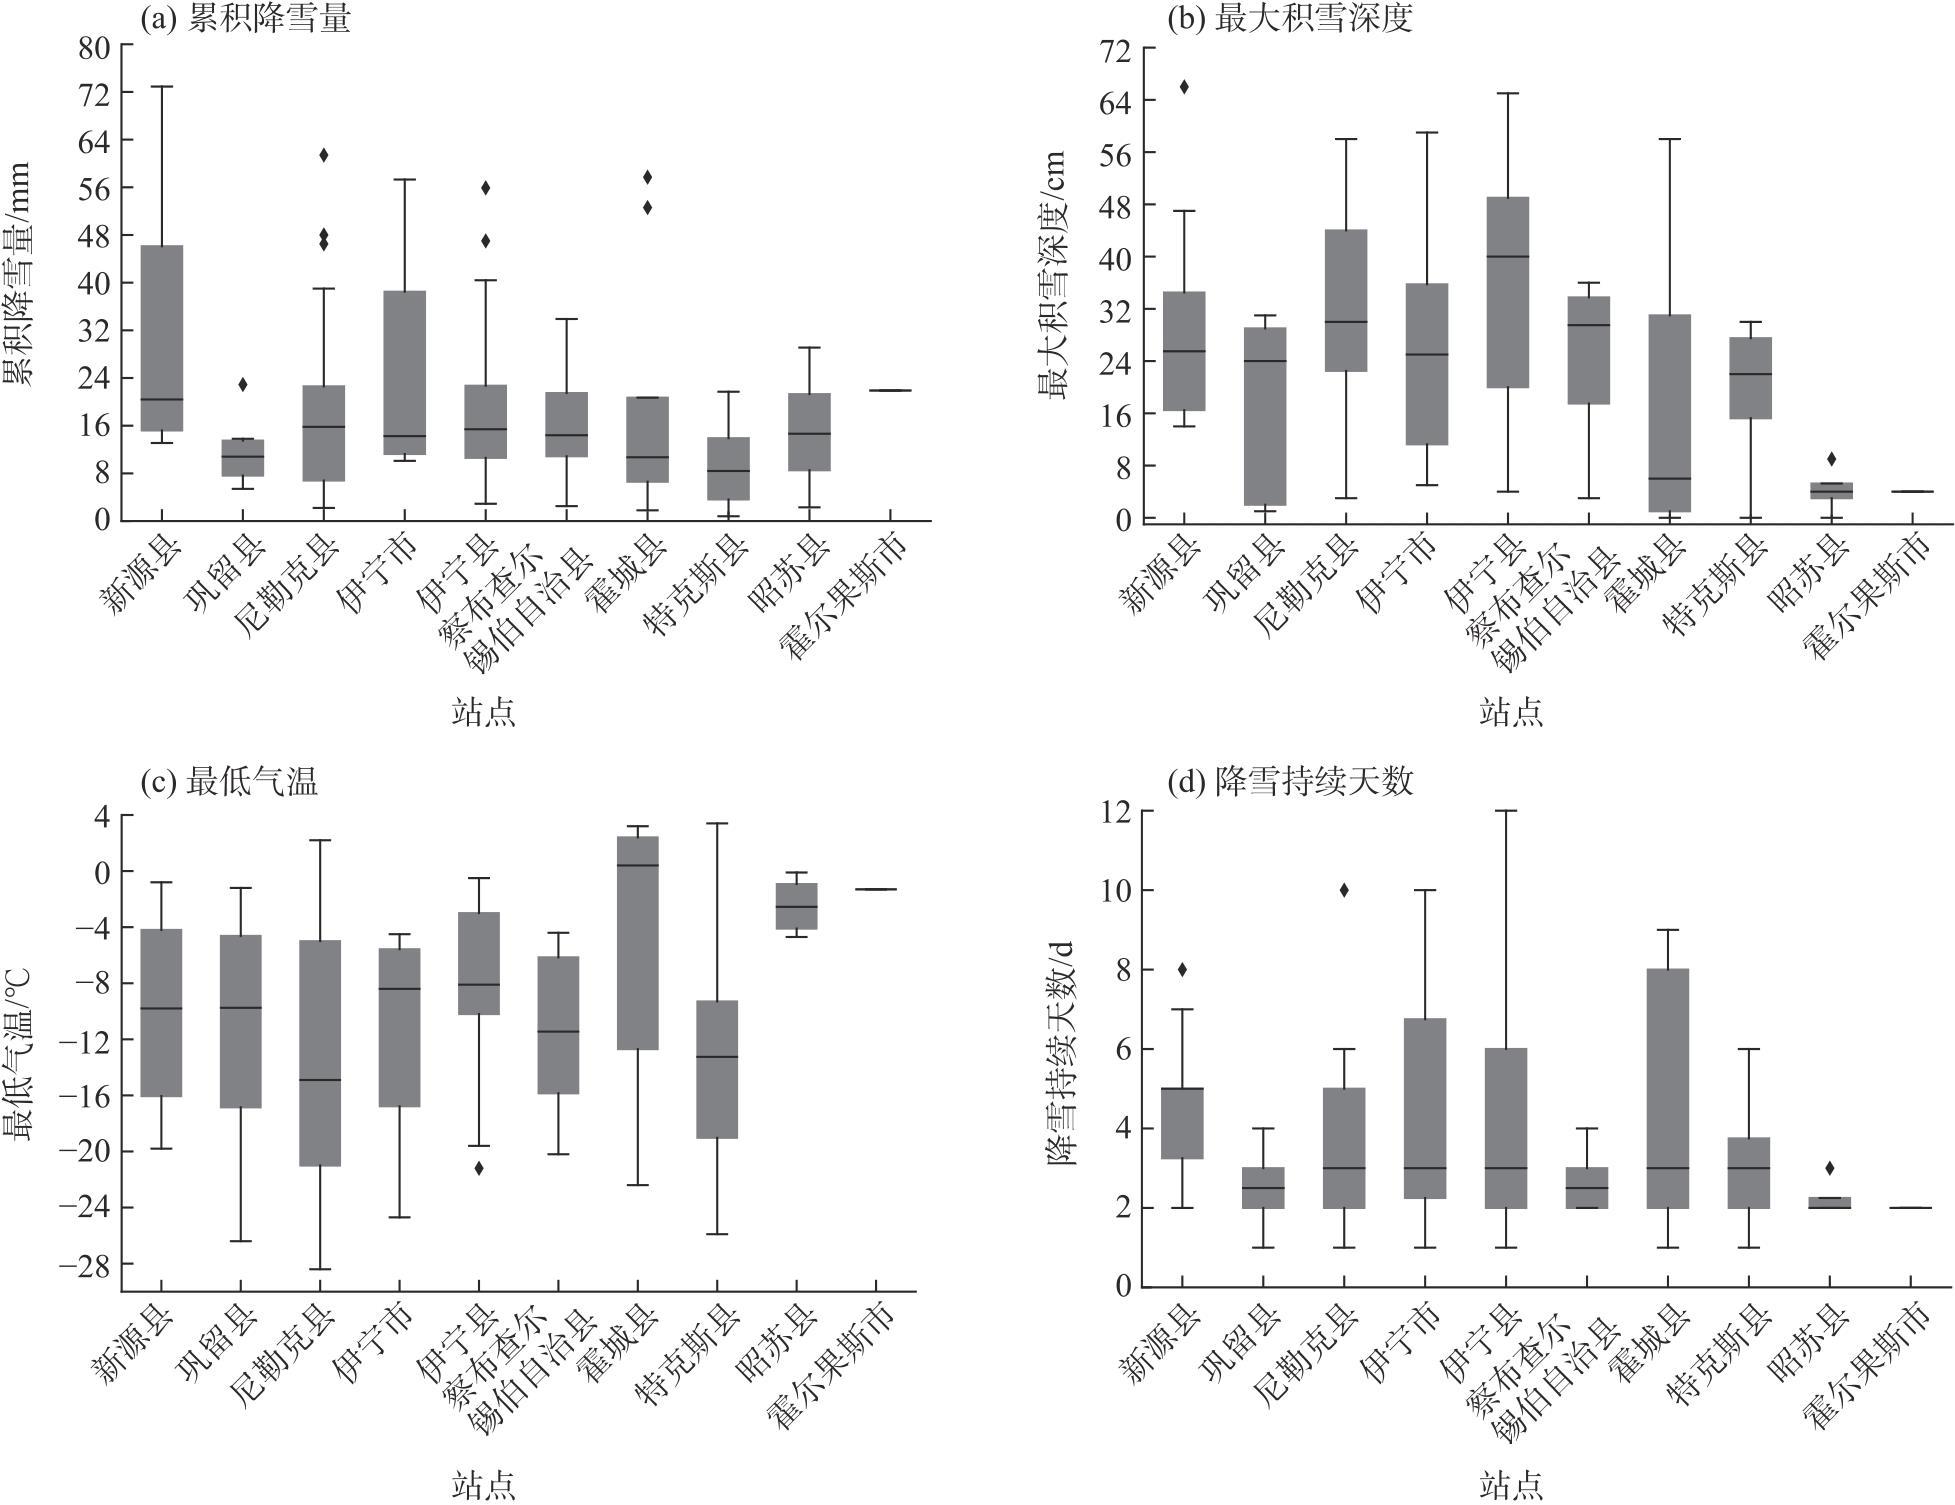
雪灾给伊犁地区带来了重大的经济和社会影响,主要表现在农业生产的减少和生态系统的破坏等方面。为量化和评估雪灾对伊犁地区的影响,基于1990—2020年伊犁地区的95次雪灾事件,通过指标选择、无量纲化处理以及权重分配,计算了灾损指数,并依据百分位数法,将雪灾严重性划分为一般、较重、严重和特重4个等级。结果表明:(1)1990—2020年伊犁地区雪灾次数呈双峰型分布,11月和1—2月为高发期,与季节性气候特征相关。自2014年以来,雪灾的发生次数显著下降。(2)1990—2020年伊犁地区一般等级雪灾最为常见,占比49.4%,较重、严重和特重等级占比分别为23.2%、24.2%和5.0%。(3)尼勒克县的灾损最严重,其次是新源县和伊宁县,昭苏县受影响最小。(4)雪灾发生及其严重性受累积降雪量、最大积雪深度、最低气温和降雪持续天数等气象要素影响。这些要素在县域间差异显著但整体趋势集中。研究结果可以为伊犁地区雪灾风险评估和管理提供科学依据。
火红 , 刘艳 , 买吾拉夏·木巴热克 . 1990—2020年新疆伊犁地区雪灾时空分布特征及其影响评估[J]. 干旱区地理, 2024 , 47(11) : 1828 -1840 . DOI: 10.12118/j.issn.1000-6060.2023.609
The snow disasters in the Ili region of Xinjiang, China, have led to significant economic and social impacts, mainly through reduced agricultural production and ecosystem damage. To quantify and evaluate the impact of snow disasters in this region, this study analyzed 95 snow disaster events that occurred between 1990 and 2020. A disaster loss index was calculated using selected indicators, dimensionless processing, and weight assignment. The severity of snow disasters was categorized into four levels (mild, moderate, severe, and extreme) using the percentile method. The key findings are as follows: (1) Snow disasters in the Ili region exhibited a bimodal distribution, with peak occurrences in November and January-February, aligning with the region’s seasonal climatic characteristics. Since 2014, the frequency of snow disasters has notably decreased. (2) Mild snow disasters were the most frequent, accounting for 49.4% of events, while moderate, severe, and extreme snow disasters represented 23.2%, 24.2%, and 5.0%, respectively. (3) The most severe disaster losses were observed in Nilka County, followed by Xinyuan County and Yining County, whereas Zhaosu County was the least affected. (4) Key meteorological factors influencing snow disasters, including cumulative snowfall, maximum snow depth, minimum temperature, and snowfall duration, displayed regional variations. Areas with high snow disaster incidence had higher mean values of maximum snow depth compared to other regions. This study provides a scientific foundation for risk assessment and management of snow disasters in the Ili region.
表1 伊犁地区雪灾关键灾情指标统计Tab. 1 Statistics of key disaster indicators of snow disaster in the Ili region |
| 灾情指标 | 影响 人口/人 | 死亡 人口/人 | 倒塌 房屋/间 | 直接 经济损失/104元 | 死亡 大牲畜/头 | 农作物 受灾面积/km2 | |
|---|---|---|---|---|---|---|---|
| 统计值 | 平均值 | 3602.19 | 0.73 | 288.81 | 552.21 | 533.66 | 1813.27 |
| 最大值 | 50557.00 | 9.00 | 5852.00 | 8000.00 | 9500.00 | 86666.67 | |
| 无量纲求和 | 6.84 | 6.53 | 4.74 | 6.63 | 2.36 | 2.01 | |
| 6指标 | 权重 | 0.21 | 0.20 | 0.15 | 0.21 | 0.17 | 0.06 |
| 与灾损指数的相关系数 | 0.69 | 0.51 | 0.58 | 0.52 | 0.29 | 0.20 | |
| 5指标 | 权重 | 0.23 | 0.22 | 0.16 | 0.22 | 0.18 | - |
| 与灾损指数的相关系数 | 0.72 | 0.52 | 0.59 | 0.47 | 0.29 | - | |
| 4指标 | 权重 | 0.28 | 0.26 | 0.19 | 0.27 | - | - |
| 与灾损指数的相关系数 | 0.78 | 0.56 | 0.63 | 0.54 | - | - | |
注:“-”表示该因素不参与灾损指数计算。下同。 |
表2 伊犁地区雪灾等级划分标准与灾情指标平均值对比Tab. 2 Comparison between snow disaster classification standards and average values of disaster indicators in the Ili region |
| 灾情 指标 | 百分位 数/% | 灾损指数 阈值 | 危害等级 | 出现次数 | 影响人口/人 | 死亡人口/人 | 倒塌房屋/间 | 直接经济损失/104元 | 死亡大牲畜/头 | 农作物受灾面积/km2 |
|---|---|---|---|---|---|---|---|---|---|---|
| 6指标 | (-∞, 25] | (-∞, 0.02] | 1 | 47 | 3658.15 | 0.68 | 298.22 | 534.34 | 551.00 | 1863.07 |
| (25, 50] | (0.02, 0.09] | 2 | 25 | 3912.57 | 0.65 | 334.90 | 550.61 | 621.26 | 1768.47 | |
| (50, 75] | (0.09, 0.24] | 3 | 18 | 3640.51 | 0.74 | 291.88 | 556.81 | 539.34 | 1832.53 | |
| (75, 100] | (0.24, ∞) | 4 | 5 | 4330.55 | 0.60 | 407.06 | 550.02 | 780.84 | 883.93 | |
| 5指标 | (-∞, 25] | (-∞, 0.02] | 1 | 48 | 3640.45 | 0.67 | 291.88 | 557.91 | 539.24 | - |
| (25, 50] | (0.02, 0.09] | 2 | 22 | 4310.03 | 0.68 | 376.18 | 518.19 | 698.46 | - | |
| (50, 75] | (0.09, 0.23] | 3 | 20 | 3640.51 | 0.74 | 291.88 | 356.81 | 539.34 | - | |
| (75, 100] | (0.23, ∞) | 4 | 5 | 6471.79 | 0.82 | 636.77 | 507.47 | 1274.92 | - | |
| 4指标 | (-∞, 25] | (-∞, 0.02] | 1 | 47 | 3640.45 | 0.67 | 291.89 | 557.91 | - | - |
| (25, 50] | (0.02, 0.08] | 2 | 24 | 4390.75 | 0.50 | 390.98 | 534.77 | - | - | |
| (50, 75] | (0.08, 0.28] | 3 | 19 | 3640.51 | 0.74 | 291.88 | 556.81 | - | - | |
| (75, 100] | (0.28, ∞) | 4 | 5 | 6471.79 | 0.82 | 636.77 | 507.47 | - | - |
表3 基于不同灾情指标的伊犁地区特重等级雪灾事件评估Tab. 3 Evaluation of heavy snow disaster events in the Ili region based on different disaster indicators |
| 县名 | 雪灾发生地名称 | 雪灾开始日期 (年-月-日) | 雪灾结束日期 (年-月-日) | 灾情指标数 | ||
|---|---|---|---|---|---|---|
| 4指标 | 5指标 | 6指标 | ||||
| 新源县 | 全县范围 | 1999-12-29 | 2000-01-04 | 符合 | 符合 | 符合 |
| 新源县 | 坎苏乡、那拉提镇 | 2010-01-09 | 2010-01-26 | 符合 | 符合 | 符合 |
| 新源县 | 那拉提镇 | 2010-02-24 | 2010-02-24 | 符合 | 符合 | 符合 |
| 伊宁县 | 伊宁县县域 | 2010-02-26 | 2010-03-31 | 符合 | 符合 | 符合 |
| 伊宁县 | 伊宁县各乡镇 | 2010-02-26 | 2010-03-03 | 符合 | 不符合 | 符合 |
| 霍城县 | 61团、62团 | 2013-03-31 | 2013-04-01 | 不符合 | 不符合 | 符合 |
注:“符合”表示该指标中此次雪灾事件为特重等级雪灾,符合实际情况;“不符合”表示该指标中此次雪灾事件不是特重等级雪灾,不符合实际情况。 |
| [1] |
|
| [2] |
|
| [3] |
杨登兴, 刘峰贵, 延军平, 等. 青藏铁路沿线雪灾风险评估[J]. 地理研究, 2021, 40(5): 1223-1238.
[
|
| [4] |
|
| [5] |
|
| [6] |
韩燕丽. 苏尼特草原雪灾时空分布特征[J]. 现代盐化工, 2023, 50(1): 89-91.
[
|
| [7] |
李兴, 李金凤, 陈宏松, 等. 青海海西地区近41年雪灾时空分布特征[J]. 青海环境, 2022, 32(2): 90-95.
[
|
| [8] |
葛海燕. 赤峰地区近60年雪灾时空分布特征分析[J]. 农业技术与装备, 2022(1): 146-148.
[
|
| [9] |
彭英超, 陈晶, 唐仲涛. 近60年黄南州南部牧区雪灾特征研究[J]. 农业灾害研究, 2021, 11(9): 84-86.
[
|
| [10] |
王秀琴, 卢新玉, 马禹, 等. 基于灾情数据的新疆雪灾的评估与区划[J]. 冰川冻土, 2019, 41(4): 836-844.
[
|
| [11] |
肖鹏峰. 2022年美国雪灾应对工作分析及建议[J]. 中国减灾, 2023(3): 36-39.
[
|
| [12] |
2006年全国低温冷冻和雪灾情况[J]. 中国减灾, 2007(2): 16.
[2006 national situation on low-temperature freeze and snow disasters[J]. Disaster Reduction in China, 2007(2): 16.]
|
| [13] |
王旭, 储长江, 牟欢. 新疆雪灾空间格局和年际变化特征分析[J]. 干旱区研究, 2020, 37(6): 1488-1495.
[
|
| [14] |
安莹, 李生才. 2014年9—10月国内环境事件[J]. 安全与环境学报, 2014, 14(6): 348-351.
[
|
| [15] |
马恒, 张钢锋, 史培军. 畜牧业雪灾致灾成害过程和风险评估研究进展与展望[J]. 地理科学进展, 2021, 40(12): 2116-2129.
[
|
| [16] |
赵慧霞, 周立隆, 袁慧敏, 等. 东北地区强降雪过程综合评估模型初探[J]. 气象与环境科学, 2021, 44(3): 1-7.
[
|
| [17] |
刘兴元, 梁天刚, 郭正刚, 等. 阿勒泰地区草地畜牧业雪灾的遥感监测与评价[J]. 草业学报, 2003(6): 115-120.
[
|
| [18] |
庄晓翠, 周鸿奎, 王磊, 等. 新疆北部牧区雪灾评估指标及其成因分析[J]. 干旱区研究, 2015, 32(5): 1000-1006.
[
|
| [19] |
许剑辉, 舒红, 刘艳. 2000—2010年新疆雪灾时空自相关分析[J]. 灾害学, 2014, 29(1): 221-227.
[
|
| [20] |
魏娟娟, 万瑜, 张俊兰, 等. 近20 a塔城地区暖区暴雪环流分型及成因分析[J]. 干旱区地理, 2022, 45(6): 1718-1728.
[
|
| [21] |
李彦华, 高明华, 肖继东, 等. 伊犁地区近35年冬季积雪变化特征分析[J]. 沙漠与绿洲气象, 2007(2): 26-28.
[
|
| [22] |
王秀琴, 王昀, 王旭. 1990—2019年新疆不同等级风灾变化特征[J]. 气象科技, 2022, 50(2): 273-281.
[
|
| [23] |
李凡, 侯光良, 鄂崇毅, 等. 基于乡镇单元的青海高原果洛地区雪灾致灾风险评估[J]. 自然灾害学报, 2014, 23(6): 141-148.
[
|
| [24] |
郭帷, 谢海涛, 王旭, 等. 1981—2019年北疆暴雨洪涝灾害的时空变化特征分析[J]. 暴雨灾害, 2022, 41(1): 101-108.
[
|
| [25] |
常秉松, 许东蓓, 丁艺涵, 等. 青海省洪涝灾害及致洪降雨特征综合分析[J]. 高原气象, 2023, 42(5): 1194-1206.
[
|
| [26] |
陈颖, 马禹. 新疆不同等级暴雨洪涝灾害的时空变化特征[J]. 干旱区地理, 2021, 44(6): 1515-1524.
[
|
| [27] |
韩孺村, 张莹, 李占玲. 两种不确定性来源对干旱指数SPEI及干旱评估的影响[J]. 干旱区地理, 2022, 45(5): 1392-1401.
[
|
/
| 〈 |
|
〉 |