
内蒙古光伏开发空间适宜性及减排效益研究
|
徐伟(1970-),女,工学博士,教授,主要从事城乡建设与可持续发展等方面的研究. E-mail: btxuwei2006@126.com |
收稿日期: 2023-05-18
修回日期: 2023-07-18
网络出版日期: 2024-06-20
基金资助
国家社会科学基金项目(22XJY001)
内蒙古自治区哲学社会规划项目(2022NDC220)
Spatial suitability and emission reduction benefits of photovoltaic development in Inner Mongolia
Received date: 2023-05-18
Revised date: 2023-07-18
Online published: 2024-06-20
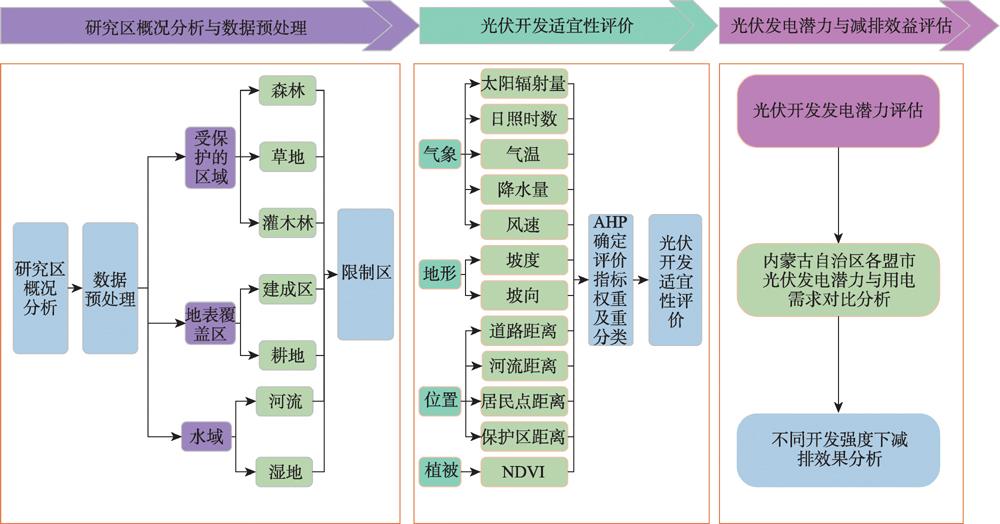
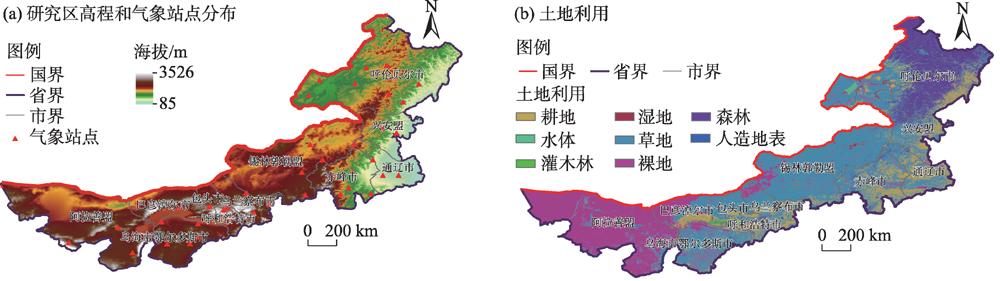
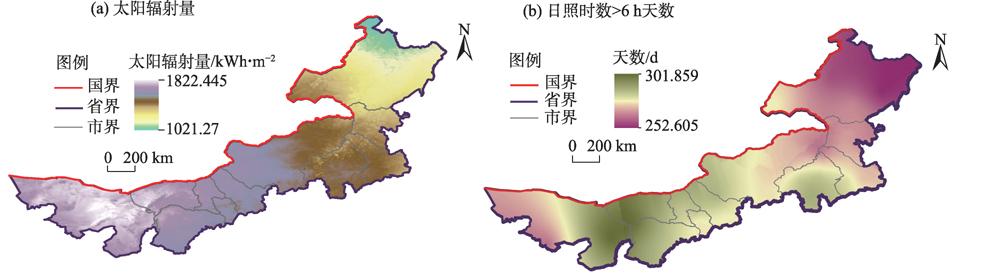
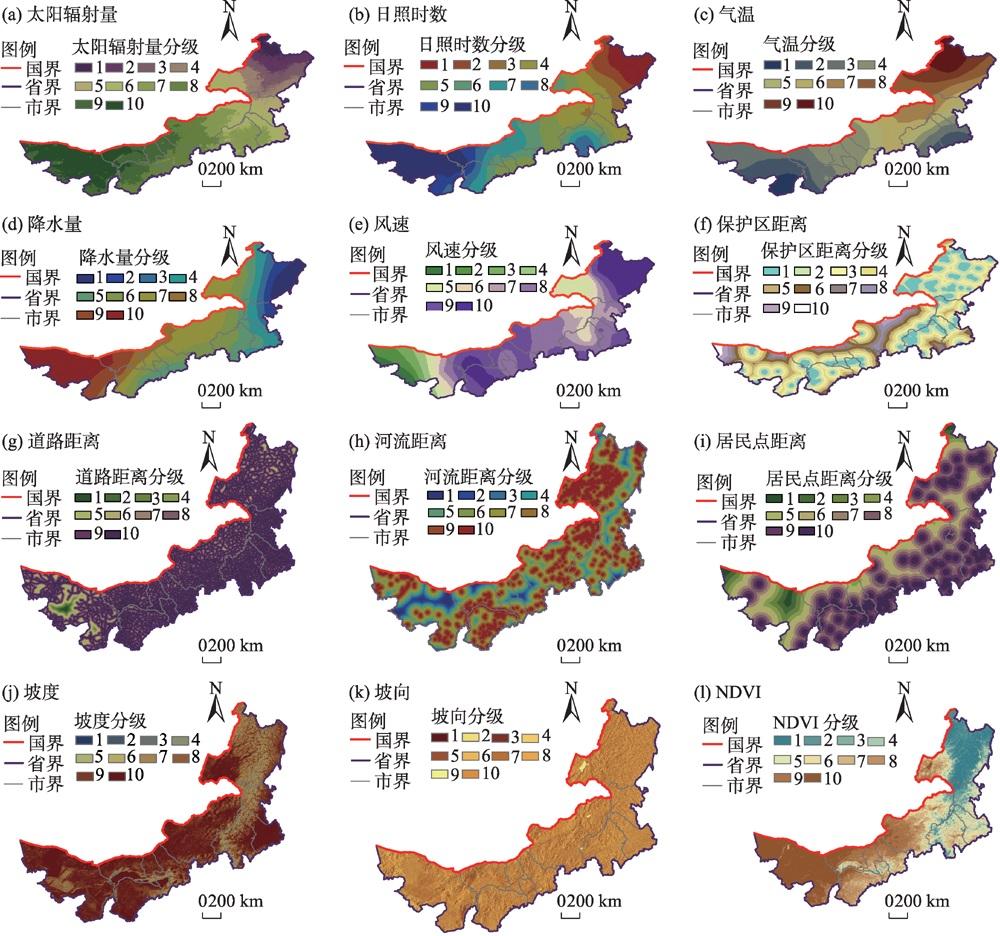
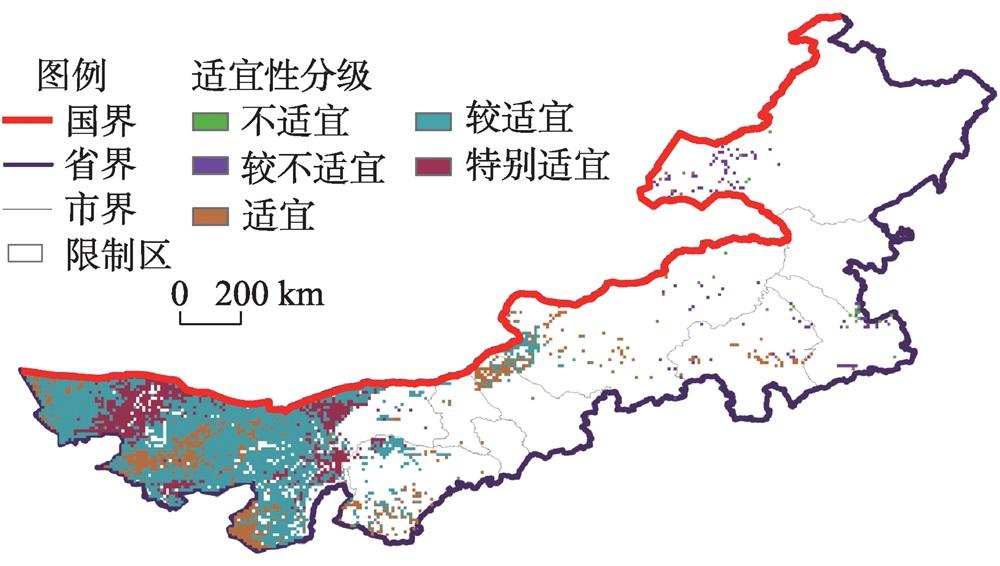
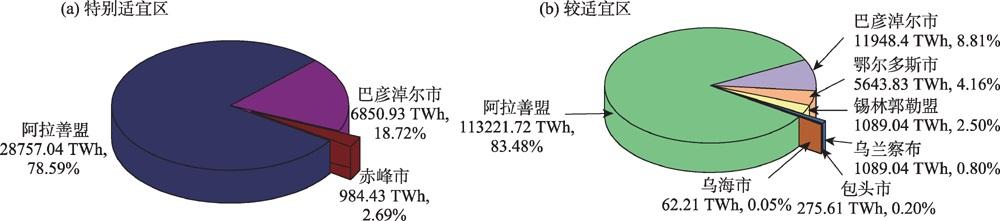
内蒙古自治区作为中国重要的光伏发电基地,近年来盲目建设光伏电站的问题日益突出,掌握区域光伏开发的适宜性、发电潜力和减排效益对光伏产业的健康发展具有重要意义。为了探讨内蒙古自治区光伏开发适宜性与减排效益,综合利用气象、自然地理和经济社会数据,通过构建“气象-地形-位置-植被”光伏开发适宜性综合评价指标体系,利用层次分析法确定评价指标的权重,借助地理信息系统工具对内蒙古自治区光伏开发适宜性进行空间显性评价,进而定量评估在不同开发强度下的光伏发电潜力与减排效益,并对各盟市光伏发电潜力与电力需求进行对比分析。结果表明:(1) 内蒙古自治区西部的光伏开发适宜性大于中部和东部,各类适宜区主要分布在西部的阿拉善盟和巴彦淖尔市,光伏开发特别适宜、较适宜和适宜区域的面积占内蒙古自治区总面积的23.66%。(2) 内蒙古自治区光伏发电潜力巨大,特别适宜的区域开发12.57%即可满足内蒙古自治区2021年用电量。(3) 内蒙古自治区光伏发电潜力与电力需求分布有着较强的空间异质性,空间格局特征显著。(4) 内蒙古自治区光伏发电的节能减排效果显著,与传统燃煤火力发电相比,若特别适宜区全部开发,年碳减排量约2.947×10⁹ t,是2021年内蒙古自治区碳排放总量的4.46倍,占我国2021年碳排放总量的21.20%。研究结果为内蒙古自治区光伏电站选址和光伏产业的健康发展提供科学参考和指导建议。
徐伟 , 刘振领 . 内蒙古光伏开发空间适宜性及减排效益研究[J]. 干旱区地理, 2024 , 47(4) : 684 -694 . DOI: 10.12118/j.issn.1000-6060.2023.234
As an important photovoltaic (PV) power generation base, the Inner Mongolia Autonomous Region (IMAR), China has seen the problem of blindly constructing PV power stations become more prominent in recent years. It is of great significance to grasp the suitability of regional PV development, power generation potential, and emission reduction benefits for the healthy development of the PV industry. To explore the suitability of PV development in the IMAR and the benefits of emission reduction, this study makes comprehensive use of meteorological, natural geographic, economic, and social data, constructs a comprehensive evaluation index system of PV development suitability in the form of meteorology-terrain-location-vegetation, uses an analytic hierarchy process to determine the weights of the evaluation indexes, and performs a spatially explicit evaluation of the suitability of PV development in the IMAR with the aid of a geographic information system tool to quantitatively assess the potential of PV power generation and emission reduction benefits under different development intensities. The PV power generation potential of the leagues and cities and the demand for electric power are compared. The results are as follows: (1) The suitability of PV development in the western part of the IMAR is greater than that in the central and eastern parts, and the various suitable areas are mainly located in the western Alagxa League and Bayannur City, with particularly suitable areas for PV development accounting for 23.66% of the total area of the IMAR. (2) The IMAR PV power generation potential is enormous, especially for regional development, where 12.57% of it can meet the IMAR 2021 electricity consumption. (3) The distribution of PV power generation potential and electricity demand in the IMAR has strong spatial heterogeneity, and the spatial pattern is characterized by significant features. (4) The energy saving and emission reduction effect of PV power generation in the IMAR is remarkable. Compared with conventional coal-fired thermal power generation, the annual carbon emission reduction is approximately 2.947×10⁹ t if the development of a special suitable area is performed, which is 4.46 times the total carbon emission of the IMAR in 2021 and accounts for 21.20% of China’s total carbon emission in 2021. These results provide scientific references and guiding suggestions for the placement of PV power stations and the healthy development of the PV industry in the IMAR.
表1 数据来源及预处理方法Tab. 1 Data sources and pre-processing methods |
| 数据名称 | 处理方法 | 数据来源 |
|---|---|---|
| 整体水平辐照 | 多年平均值 | Global Solar Atl-as2.0 |
| 归一化植被指数 | 2012—2022年平均值 | 美国航空航天局发布的MODISMOD13A1产品 |
| 土地利用类型 | 按照用地类型把研究区域划分为限制区和非限制区2类,并剔除 限制区 | 全球地表覆盖数据库Globeland30(2020版) |
| 气温 | 采用Anusplin插值软件进行空间插值 | 中国气象科学数据共享服务网 |
| 降水量、风速、日照时数 | 借助ArcMap 10.8软件采用Kriging法进行空间插值 | 中国气象科学数据共享服务网 |
| 道路、居民点、保护区、河流 | 欧氏距离分析 | 全国基础地理数据库 |
| 数字高程模型 | 生成坡度和坡向数据 | 地理空间数据云平台 |
表3 随机一致性指标Tab. 3 Random consistency indicators |
| n | 1 | 2 | 3 | 4 | 5 | 6 |
|---|---|---|---|---|---|---|
| RI | 0.00 | 0.00 | 0.58 | 0.90 | 1.12 | 1.24 |
| n | 7 | 8 | 9 | 10 | 11 | 12 |
| RI | 1.32 | 1.41 | 1.45 | 1.49 | 1.51 | 1.54 |
注:n为判断矩阵行数;RI为随机一致性指标。 |
表4 光伏开发适宜性评价指标和权重Tab. 4 Photovoltaic development suitability evaluation indicators and weights |
| 目标层 | 一级指标 | 权重 | 二级指标 | 权重 |
|---|---|---|---|---|
| 光伏开发 | 气象 | 0.55 | 太阳辐射量 | 0.51 |
| 日照时数 | 0.26 | |||
| 气温 | 0.10 | |||
| 降水量 | 0.08 | |||
| 风速 | 0.05 | |||
| 地形 | 0.14 | 坡度 | 0.66 | |
| 坡向 | 0.34 | |||
| 位置 | 0.23 | 道路距离 | 0.28 | |
| 居民点距离 | 0.50 | |||
| 河流距离 | 0.07 | |||
| 保护区距离 | 0.15 | |||
| 植被 | 0.08 | NDVI | 1.00 |
注:NDVI为归一化植被指数。 |
图5 内蒙古自治区光伏开发适宜性Fig. 5 Suitability of photovoltaic development in the Inner Mongolia Autonomous Region |
表5 各盟市不同适宜类型的土地面积Tab. 5 Area of land of different suitable types in each city and league /km² |
| 城市 | 特别适宜区面积 | 较适宜区面积 | 适宜区面积 | 较不适宜区面积 | 不适宜区面积 |
|---|---|---|---|---|---|
| 阿拉善盟 | 39438.75 | 155277.57 | 27985.94 | 192.90 | 0.00 |
| 巴彦淖尔市 | 9395.69 | 16386.60 | 283.85 | 57.91 | 0.00 |
| 包头市 | 0.00 | 377.99 | 631.88 | 0.00 | 0.00 |
| 赤峰市 | 1350.10 | 0.00 | 1924.86 | 884.82 | 82.40 |
| 鄂尔多斯市 | 0.00 | 7740.21 | 4484.42 | 0.00 | 0.00 |
| 呼和浩特市 | 0.00 | 0.00 | 102.25 | 0.00 | 0.00 |
| 呼伦贝尔市 | 0.00 | 0.00 | 312.45 | 2698.23 | 231.62 |
| 通辽市 | 0.00 | 0.00 | 173.91 | 926.48 | 220.17 |
| 乌海市 | 0.00 | 85.32 | 57.91 | 0.00 | 0.00 |
| 乌兰察布市 | 0.00 | 1493.56 | 3637.92 | 0.00 | 0.00 |
| 锡林郭勒盟 | 0.00 | 4648.07 | 4110.55 | 718.69 | 0.00 |
| 兴安盟 | 0.00 | 0.00 | 0.00 | 332.24 | 459.46 |
| 总面积 | 50184.54 | 186009.32 | 43705.94 | 5811.27 | 993.65 |
表6 内蒙古自治区光伏不同开发情形下的发电潜力Tab. 6 Power generation potential of photovoltaic in Inner Mongolia Autonomous Region under different development scenarios |
| 开发情景 | 情景解释 | 面积/km2 | 发电潜力/TWh | |
|---|---|---|---|---|
| S1 | S1-Q1 | 特别适宜区开发25% | 12546.14 | 9148.11 |
| S1-Q2 | 特别适宜区开发50% | 25092.27 | 18296.20 | |
| S1-Q3 | 特别适宜区开发75% | 37638.41 | 27444.31 | |
| S1-Q4 | 特别适宜区开发100% | 50184.54 | 36592.41 | |
| S2 | S2-Q1 | 较适宜区开发 25% | 46502.33 | 33907.50 |
| S2-Q2 | 较适宜区开发50% | 93004.66 | 67815.00 | |
| S2-Q3 | 较适宜区开发75% | 139506.99 | 101722.50 | |
| S2-Q4 | 较适宜区开发100% | 186009.32 | 135630.00 | |
| S3 | S3-Q1 | 适宜区开发25% | 10926.49 | 7967.12 |
| S3-Q2 | 适宜区开发50% | 21852.97 | 15934.25 | |
| S3-Q3 | 适宜区开发75% | 32779.46 | 23901.37 | |
| S3-Q4 | 适宜区开发100% | 43705.94 | 31868.50 | |
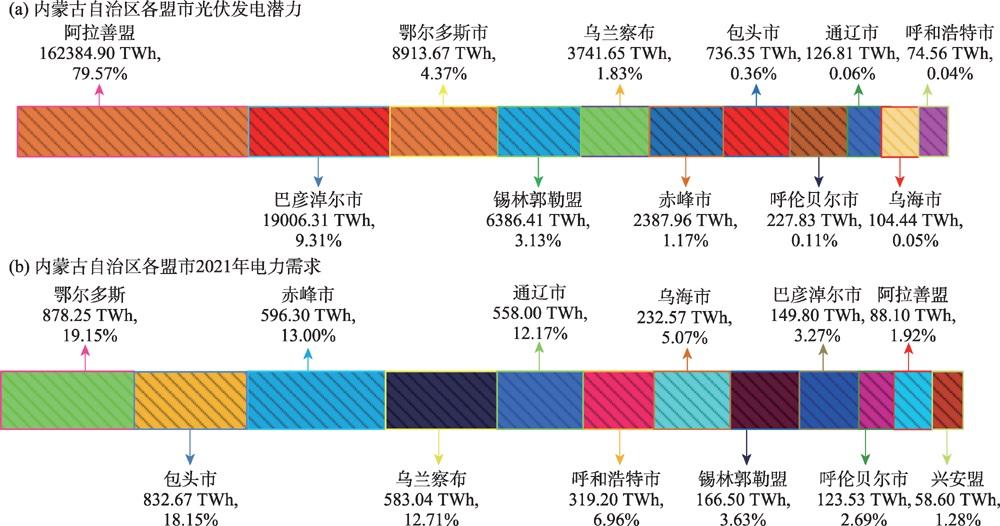
图6 内蒙古自治区各盟市光伏发电潜力与2021年用电需求Fig. 6 Photovoltaic power generation potential and electricity demand in 2021 by municipality in Inner Mongolia Autonomous Region |
表7 不同光伏开发强度下的减排效果Tab. 7 Emission reductions at different photovoltaic development intensities |
| 开发情景 | 情景解释 | 减排效果/t | ||||
|---|---|---|---|---|---|---|
| 标准煤 | CO2 | SO2 | NOx | TSP | ||
| S1 S1-Q1 | 特别适宜区开发25% | 2.767×10⁸ | 7.367×10⁸ | 6.088×10⁶ | 2.767×10⁶ | 4.704×10⁶ |
| S1-Q2 | 特别适宜区开发50% | 5.535×10⁸ | 1.473×10⁹ | 1.218×10⁷ | 5.535×10⁶ | 9.409×10⁶ |
| S1-Q3 | 特别适宜区开发75% | 8.302×10⁸ | 2.210×10⁹ | 1.826×10⁷ | 8.302×10⁶ | 1.411×10⁷ |
| S1-Q4 | 特别适宜区开发100% | 1.107×10⁹ | 2.947×10⁹ | 2.435×10⁷ | 1.107×10⁷ | 1.882×10⁷ |
| S2 S2-Q1 | 较适宜区开发25% | 1.026×10⁹ | 2.730×10⁹ | 2.257×10⁷ | 1.026×10⁷ | 1.744×10⁷ |
| S2-Q2 | 较适宜区开发50% | 2.051×10⁹ | 5.461×10⁹ | 4.513×10⁷ | 2.051×10⁷ | 3.487×10⁷ |
| S2-Q3 | 较适宜区开发75% | 3.077×10⁹ | 8.191×10⁹ | 6.770×10⁷ | 3.077×10⁷ | 5.231×10⁷ |
| S2-Q4 | 较适宜区开发100% | 4.103×10⁹ | 1.092×10¹⁰ | 9.026×10⁷ | 4.103×10⁷ | 6.975×10⁷ |
| S3 S3-Q1 | 适宜区开发25% | 2.410×10⁸ | 6.416×10⁸ | 5.302×10⁶ | 2.410×10⁶ | 4.097×10⁶ |
| S3-Q2 | 适宜区开发50% | 4.820×10⁸ | 1.283×10⁹ | 1.060×10⁷ | 4.820×10⁶ | 8.194×10⁶ |
| S3-Q3 | 适宜区开发75% | 7.230×10⁸ | 1.925×10⁹ | 1.591×10⁷ | 7.230×10⁶ | 1.229×10⁷ |
| S3-Q4 | 适宜区开发100% | 9.640×10⁸ | 2.566×10⁹ | 2.123×10⁷ | 9.640×10⁶ | 1.639×10⁷ |
注:NOx为氮氧化物;TSP为总悬浮颗粒物。 |
| [1] |
王利珍, 谭洪卫, 庄智, 等. 基于GIS平台的我国太阳能光伏发电潜力研究[J]. 上海理工大学学报, 2014, 36(5): 491-496.
[
|
| [2] |
韩梦瑶, 熊焦, 刘卫东. 中国光伏发电的时空分布、竞争格局及减排效益[J]. 自然资源学报. 2022, 37(5): 1338-1351.
[
|
| [3] |
|
| [4] |
|
| [5] |
|
| [6] |
|
| [7] |
|
| [8] |
|
| [9] |
刘立程, 孙中孝, 吴锋, 等. 京津冀地区光伏开发空间适宜性及减排效益评估[J]. 地理学报, 2022, 77(3): 665-678.
[
|
| [10] |
|
| [11] |
江东, 王娣, 付晶莹, 等. 内蒙古自治区未利用土地可再生能源潜力评估[J]. 科技导报, 2020, 38(11): 60-69.
[
|
| [12] |
|
| [13] |
|
| [14] |
董秋霞, 董樊丽, 耿涌, 等. 碳达峰碳中和背景下内蒙古绿色低碳发展的路径和对策建议[J]. 科学管理研究, 2022, 40(6): 77-83.
[
|
| [15] |
|
| [16] |
吕玉坤, 杨宇星, 赵伟萍. 低风速环境下光伏组件积灰特性模拟研究[J]. 电源技术, 2021, 45(6): 801-804, 827.
[
|
| [17] |
|
| [18] |
|
| [19] |
叶小伟, 乔建芳. 乌兹别克斯坦可再生能源现状及中乌合作建议[J]. 干旱区地理, 2022, 45(4): 1313-1319.
[
|
| [20] |
|
| [21] |
|
| [22] |
达成, 张富涛, 钱勇生, 等. 关中平原城市群“交通-产业-环境”耦合协调发展的动态演化特征分析[J]. 干旱区地理, 2022, 45(3): 955-965.
[
|
/
| 〈 |
|
〉 |