EN
中文
投稿
首页
期刊
核心期刊
扩展期刊
联盟期刊
领域期刊
论文
推荐文章
高被引文章
高下载文章
虚拟专题
数据关联论文
数据出版平台
知识挖掘
作者学术关系
知识脉络
图表库
知识标引与可视化
关键词云
资讯&工具
会议/讲座
科研信息
科研基金
招生招聘
地理图书
地理新闻
关于
期刊网介绍
期刊加盟政策
期刊网标准与提交
版权与隐私
联系我们
EN
中文
中国地理资源期刊群体力量的凝聚体现
期刊
0
文章
0
专题
36
图表
0
访问量
0
高级检索
图表检索
更多选择
期刊
DOI
请选择
Area Development and Policy
Cities
Journal of Arid Land
Regional Sustainability
Resources Environment and Sustainability
冰川冻土
长江流域资源与环境
沉积学报
城市研究
地理科学
地理科学进展
地理学报
地理学报(英文版)
地理学与可持续性(英文)
地理研究
地理与地理信息科学
地球科学进展
地球信息科学学报
地域研究与开发
第四纪研究
干旱区地理
干旱区研究
高原气象
国际灾害风险科学学报(英文)
国情快报·科普版
国情快报·政策版
寒旱区科学
湖泊科学
华南地理学报
黄金科学技术
经济地理
历史地理
历史地理研究
全球变化数据仓储电子杂志(中英文)
全球变化数据学报
热带地理
人文地理
山地科学学报(英文版)
山地学报
湿地科学
时空信息学报
世界地理研究
天然气地球科学
土壤与作物
亚热带资源与环境学报
遥感技术与应用
中国地理科学(英文版)
中国沙漠
中国生态旅游
中国土地科学
资源科学
资源与生态学报
自然资源情报
自然资源信息化
自然资源学报
起始年
结束年
请选择
1934
1935
1936
1937
1938
1939
1940
1941
1942
1943
1944
1945
1946
1947
1948
1949
1950
1951
1952
1953
1954
1955
1956
1957
1958
1959
1960
1961
1962
1963
1964
1965
1966
1967
1968
1969
1970
1971
1972
1973
1974
1975
1976
1977
1978
1979
1980
1981
1982
1983
1984
1985
1986
1987
1988
1989
1990
1991
1992
1993
1994
1995
1996
1997
1998
1999
2000
2001
2002
2003
2004
2005
2006
2007
2008
2009
2010
2011
2012
2013
2014
2015
2016
2017
2018
2019
2020
2021
2022
2023
2024
2025
请选择
2025
2024
2023
2022
2021
2020
2019
2018
2017
2016
2015
2014
2013
2012
2011
2010
2009
2008
2007
2006
2005
2004
2003
2002
2001
2000
1999
1998
1997
1996
1995
1994
1993
1992
1991
1990
1989
1988
1987
1986
1985
1984
1983
1982
1981
1980
1979
1978
1977
1976
1975
1974
1973
1972
1971
1970
1969
1968
1967
1966
1965
1964
1963
1962
1961
1960
1959
1958
1957
1956
1955
1954
1953
1952
1951
1950
1949
1948
1947
1946
1945
1944
1943
1942
1941
1940
1939
1938
1937
1936
1935
1934
卷
期
作者
作者单位
检索结果
期刊
Loading ...
出版年
Loading ...
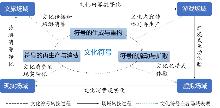
图4
游戏产业赋能文旅产业融合的机制
表2 社交媒体用户对取景地旅游发展态度
表1 社交媒体用户对取景地文化符号的态度
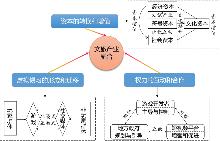
图3
游戏产业赋能文旅产业融合的特征
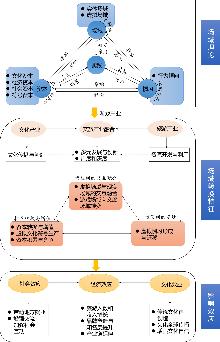
图2
场域转换视角下游戏产业赋能文旅融合的研究框架
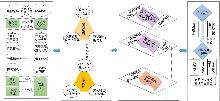
图1
文化符号的跨场域转换路径
附表2 广东省各县区拆旧复垦实际实现量和碳储量贡献度
附表1 广东省各片区各地类碳密度
图5
拆旧复垦不同环节碳储量碳储量实现比值分布
图4
拆旧复垦各环节碳储量实现差额分布
表4 拆旧复垦各环节各类型用地碳储量的差额和比值
图3
拆旧复垦各县区实际实现碳储量差异
表3 拆旧复垦各类型用地碳储量(CS)及贡献度(CSC)
表2 复垦为园地抽样地块的地上碳密度
表1 拆旧复垦各土地利用类型碳密度 (t/hm
2
)
图2
拆旧复垦碳储量评估分析模型
图1
拆旧复垦实施区域划分
注:
该图基于广东省标准地图服务网站下载的审图号GS(2024)0650号的标准地图制作,底图无修改。
图2
女性民宿主成长与乡村民宿发展的互动机制
表3 女性民宿主成长驱动力主题构建
表2 编码示例
跳至
页
第1页
共7809页
共156173条记录
首页
上一页
下一页
尾页
/thumbnail/AB0C43F3-B486-45d3-B6DE-6717B39D4078-F005.jpg)
/thumbnail/AB0C43F3-B486-45d3-B6DE-6717B39D4078-F004.jpg)
/thumbnail/AB0C43F3-B486-45d3-B6DE-6717B39D4078-F003.jpg)
/thumbnail/AB0C43F3-B486-45d3-B6DE-6717B39D4078-F002.jpg)
/thumbnail/AB0C43F3-B486-45d3-B6DE-6717B39D4078-F001.jpg)
/thumbnail/D137BD91-E144-4216-9DAD-93EBC2491D81-F002.jpg)