
|
夏子通,男,1984年生,高级工程师,主要从事环境影响评价和辐射环境监测。E-mail:26329312@qq.com |
收稿日期: 2024-12-09
修回日期: 2024-12-29
网络出版日期: 2025-11-07
基金资助
中国国家原子能机构核设施退役与放射性废物治理专项(科工二司[2020]194号资助)
Investigation and study on environmental radon concentration around the Beishan URL
|
XIA Zitong,male,born in 1984,senior engineer,focusing on environmental impact assessment and radiation environmental monitoring. E-mail:26329312@qq.com |
Received date: 2024-12-09
Revised date: 2024-12-29
Online published: 2025-11-07
Supported by
China Atomic Energy Authority(科工二司[2020]194号资助)
夏子通 , 凌辉 , 范文哲 , 贺三军 . 北山地下实验室场区及周边环境空气氡浓度水平调查研究[J]. 世界核地质科学, 2025 , 42(1) : 146 -154 . DOI: 10.3969/j.issn.1672-0636.2025.01.012
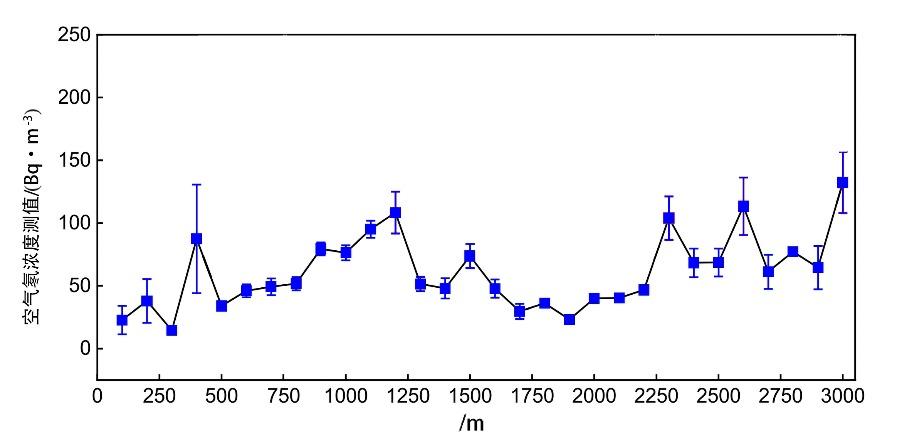
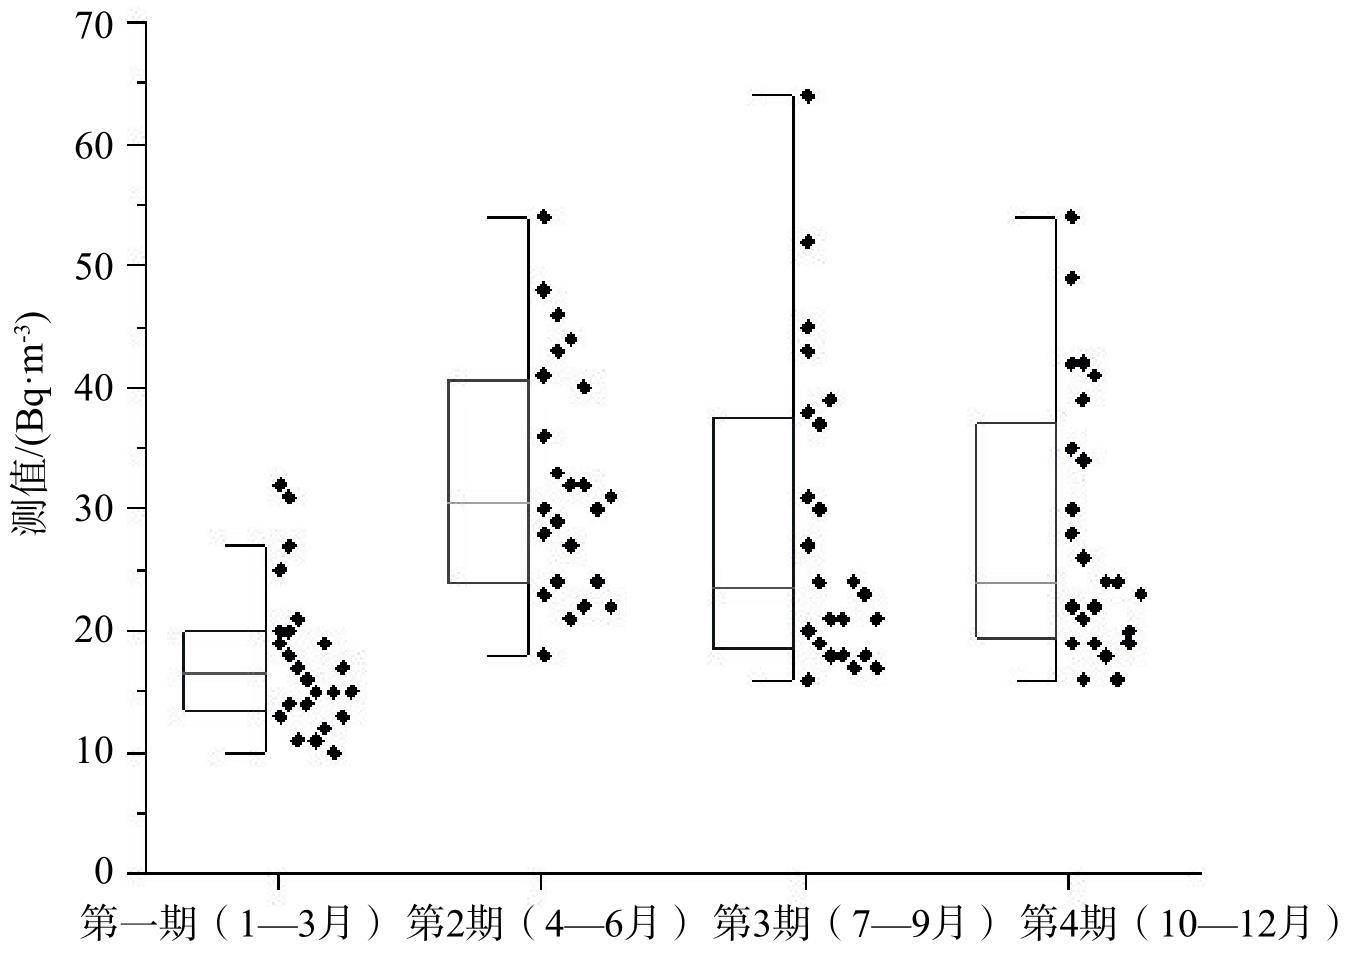
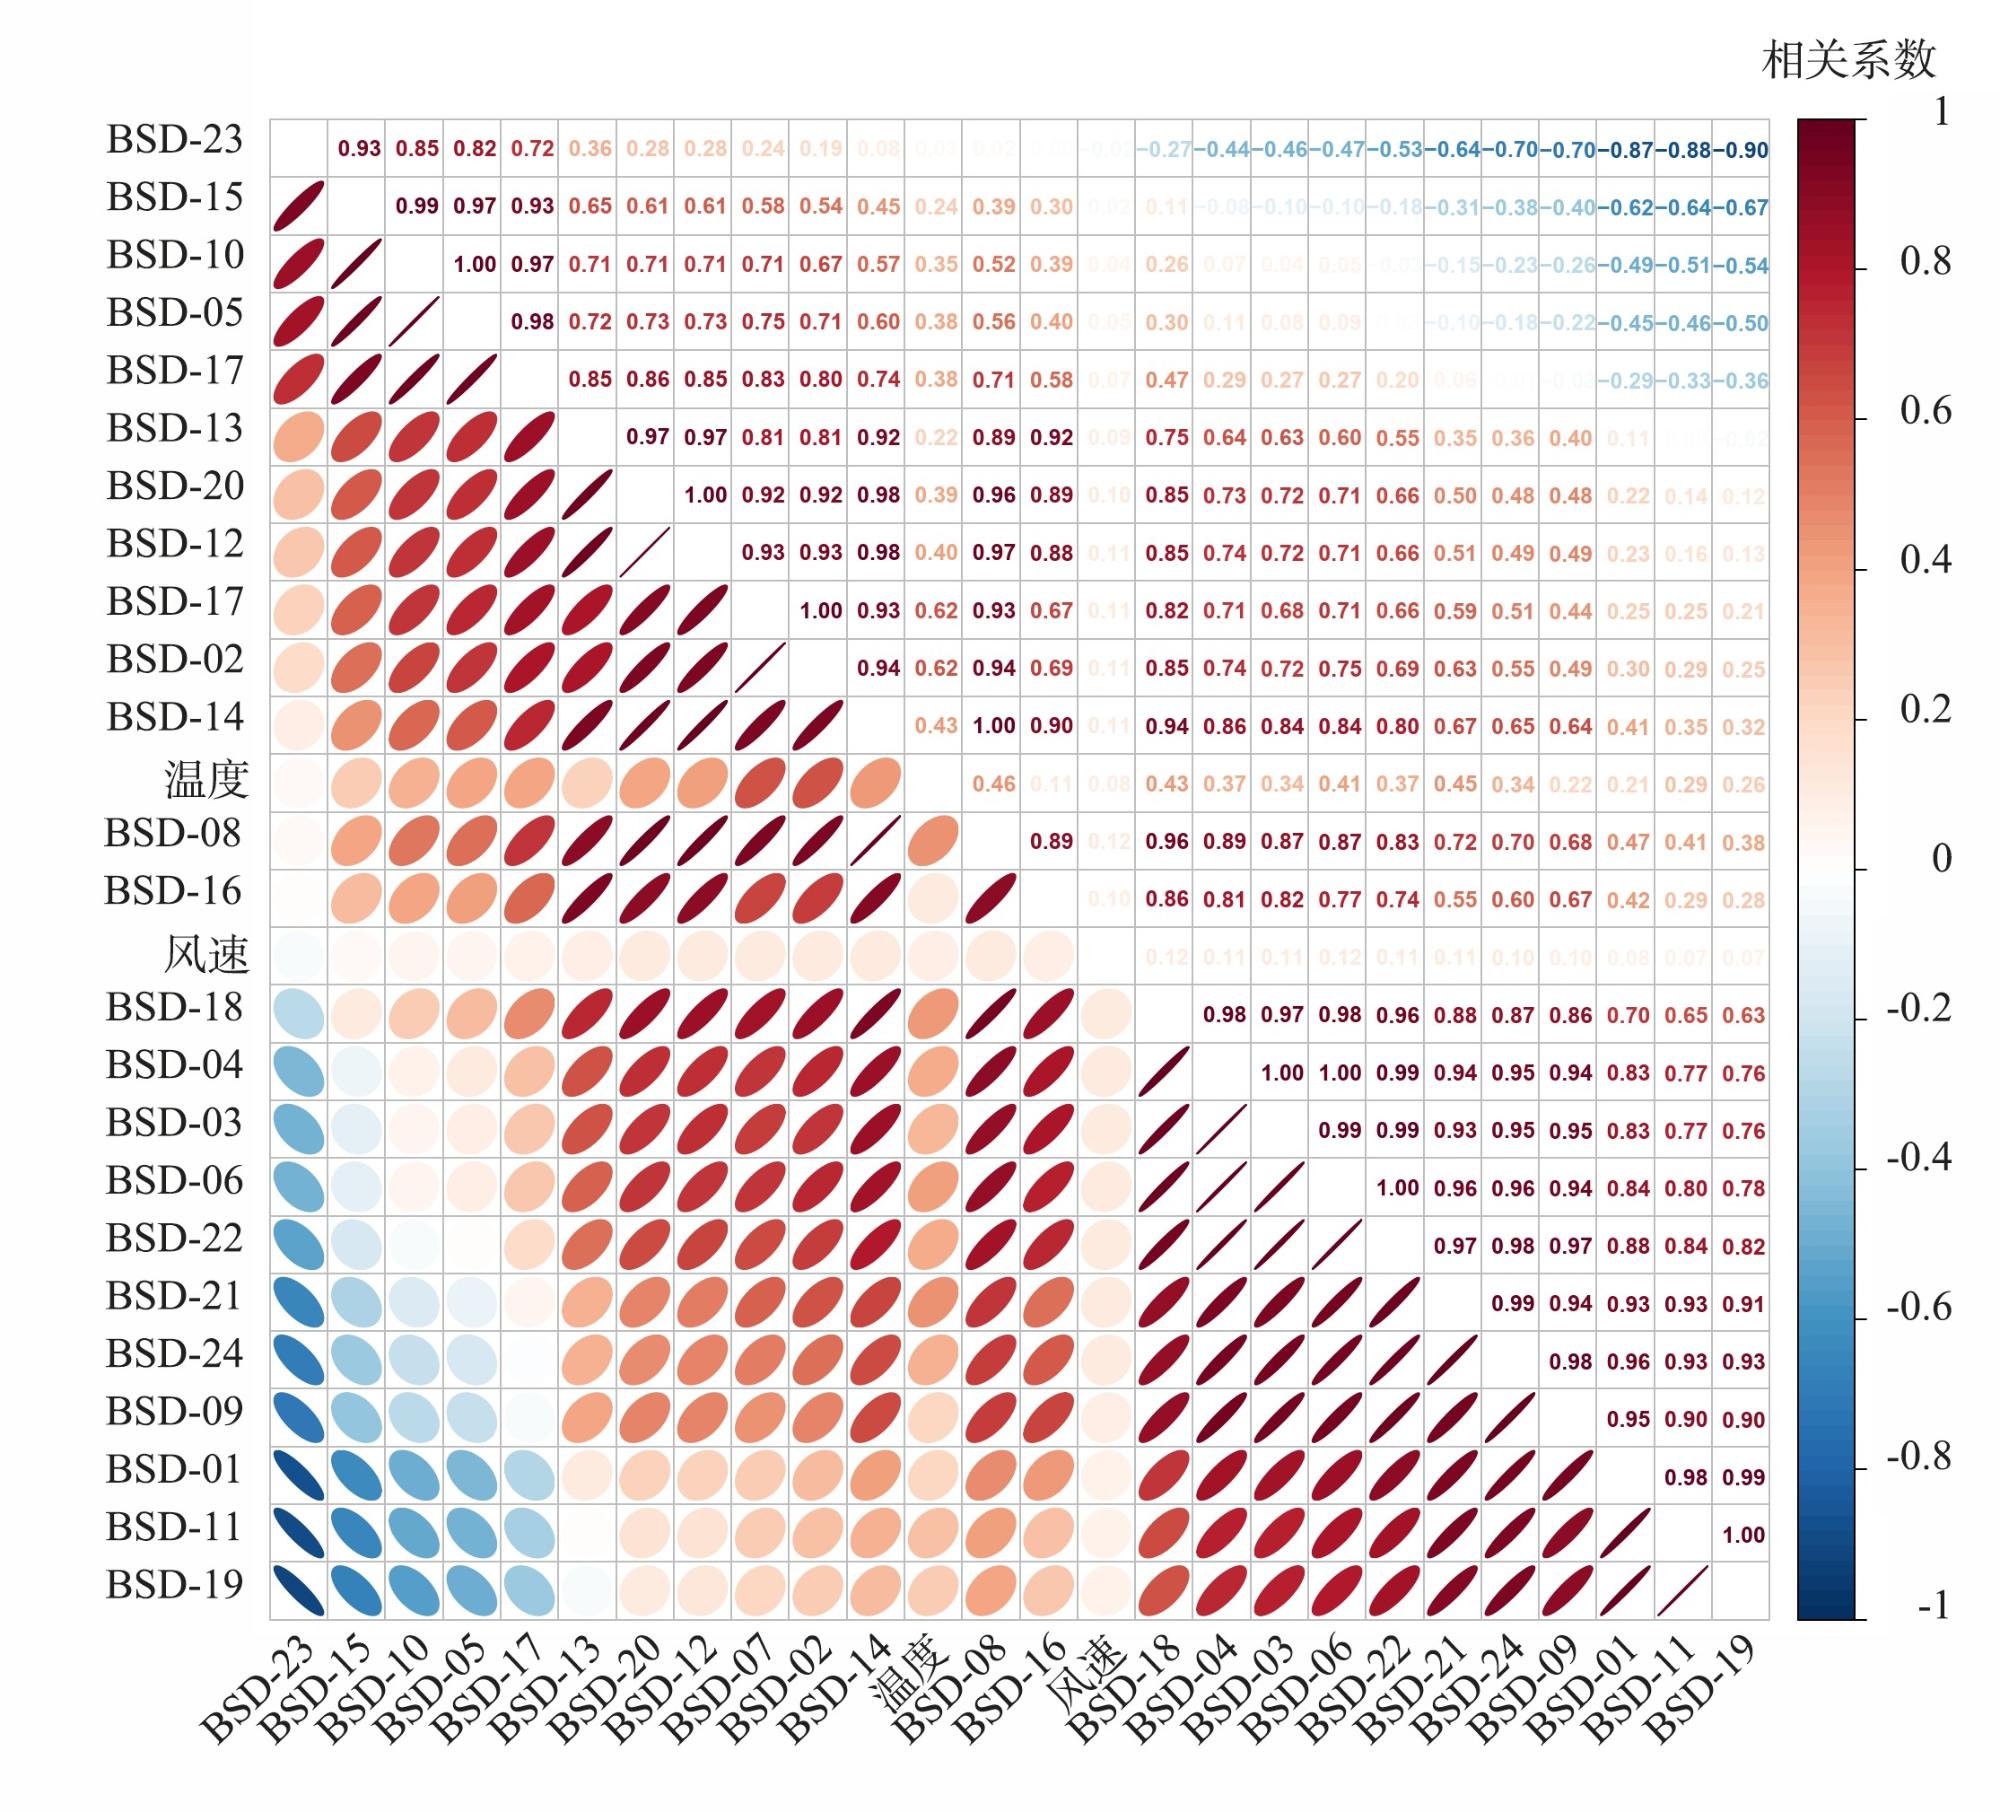
A year-long investigation of air radon concentration at Beishan URL site and its surrounding areas was carried out using solid-state nuclear track detectors at 24 points,with quarterly sampling and measurements conducted. The results indicated that the annual radon concentration in the region ranged from 10 to 64 Bq·m-3,with a geometric mean (GM) of 27 Bq·m-3. The overall radon levels exhibited distinct seasonal variations, with the highest concentrations occurring from April to June and the lowest from January to March. The differences in radon concentrations between different areas were small and remained relatively stable. Construction disturbances in the active construction zones had a localized impact on radon concentrations,but due to favorable air diffusion conditions,this effect did not result in a widespread increase in radon levels. This suggests that the direct impact of human activities on regional radon concentrations is limited. According to the Pearson correlation coefficient analysis,a significant positive correlation was observed between temperature and radon concentrations,with radon levels increasing as temperatures rose at most measurement points. In contrast,the influence of wind speed on radon concentrations was more complex,with considerable variability in correlation across different points,likely influenced by other factors,warranting further investigation. This study provides data support and practical insights for long-term radon monitoring and health risk assessment at the Beishan URL.
表1 氡浓度平行样相对偏差统计Table 1 Relative deviation statistics of parallel samples for radon concentration |
| 序号 | 测量位置 | 测量值/(Bq·m-3) | 相对偏差/% | ||||||
|---|---|---|---|---|---|---|---|---|---|
| 第1期 | 第2期 | 第3期 | 第4期 | 第1期 | 第2期 | 第3期 | 第4期 | ||
| 1 | BSD-01 | 19 | 48 | 16 | 19 | 19.05 | 8.00 | 27.03 | 11.11 |
| BSD-01① | 23 | 52 | 21 | 17 | |||||
| 2 | BSD-02 | 20 | — | 31 | 28 | 10.53 | — | 6.67 | 16.39 |
| BSD-02① | 18 | — | 29 | 33 | |||||
| 3 | BSD-03 | 13 | — | 19 | 22 | 16.67 | — | 5.13 | 14.63 |
| BSD-03① | 11 | — | 20 | 19 | |||||
| 4 | BSD-04 | 18 | 41 | 27 | 30 | 15.38 | 5.00 | 0.00 | 6.90 |
| BSD-04① | 21 | 39 | 27 | 28 | |||||
| 5 | BSD-05 | 25 | 28 | 38 | 35 | 7.69 | 16.39 | 0.00 | 10.81 |
| BSD-05① | 27 | 33 | 38 | 39 | |||||
| 6 | BSD-11 | 19 | 36 | 18 | 16 | 30.00 | 2.82 | 18.18 | 11.76 |
| BSD-11① | 14 | 35 | 15 | 18 | |||||
| 7 | BSD-12 | 11 | 18 | 18 | 19 | 24.00 | 15.38 | 0.00 | 11.11 |
| BSD-12① | 14 | 21 | 18 | 17 | |||||
| 8 | BSD-15 | 32 | 32 | — | 49 | 13.33 | 14.49 | — | 13.04 |
| BSD-15① | 28 | 37 | — | 43 | |||||
| 9 | BSD-16 | 27 | — | 30 | 34 | 5.41 | — | 6.45 | 9.23 |
| BSD-16① | 29 | — | 32 | 31 | |||||
注:①平行样 |
表2 氡浓度测量结果Table 2 Radon concentration measurement results |
| 区域 | 布点数量 | 编号 | 1~3月测值/ (Bq·m-3) | 4~6月测值/ (Bq·m-3) | 7~9月测值/ (Bq·m-3) | 10~12月测值/ (Bq·m-3) | ||||
|---|---|---|---|---|---|---|---|---|---|---|
| 范围值 | 均值 | 范围值 | 均值 | 范围值 | 均值 | 范围值 | 均值 | |||
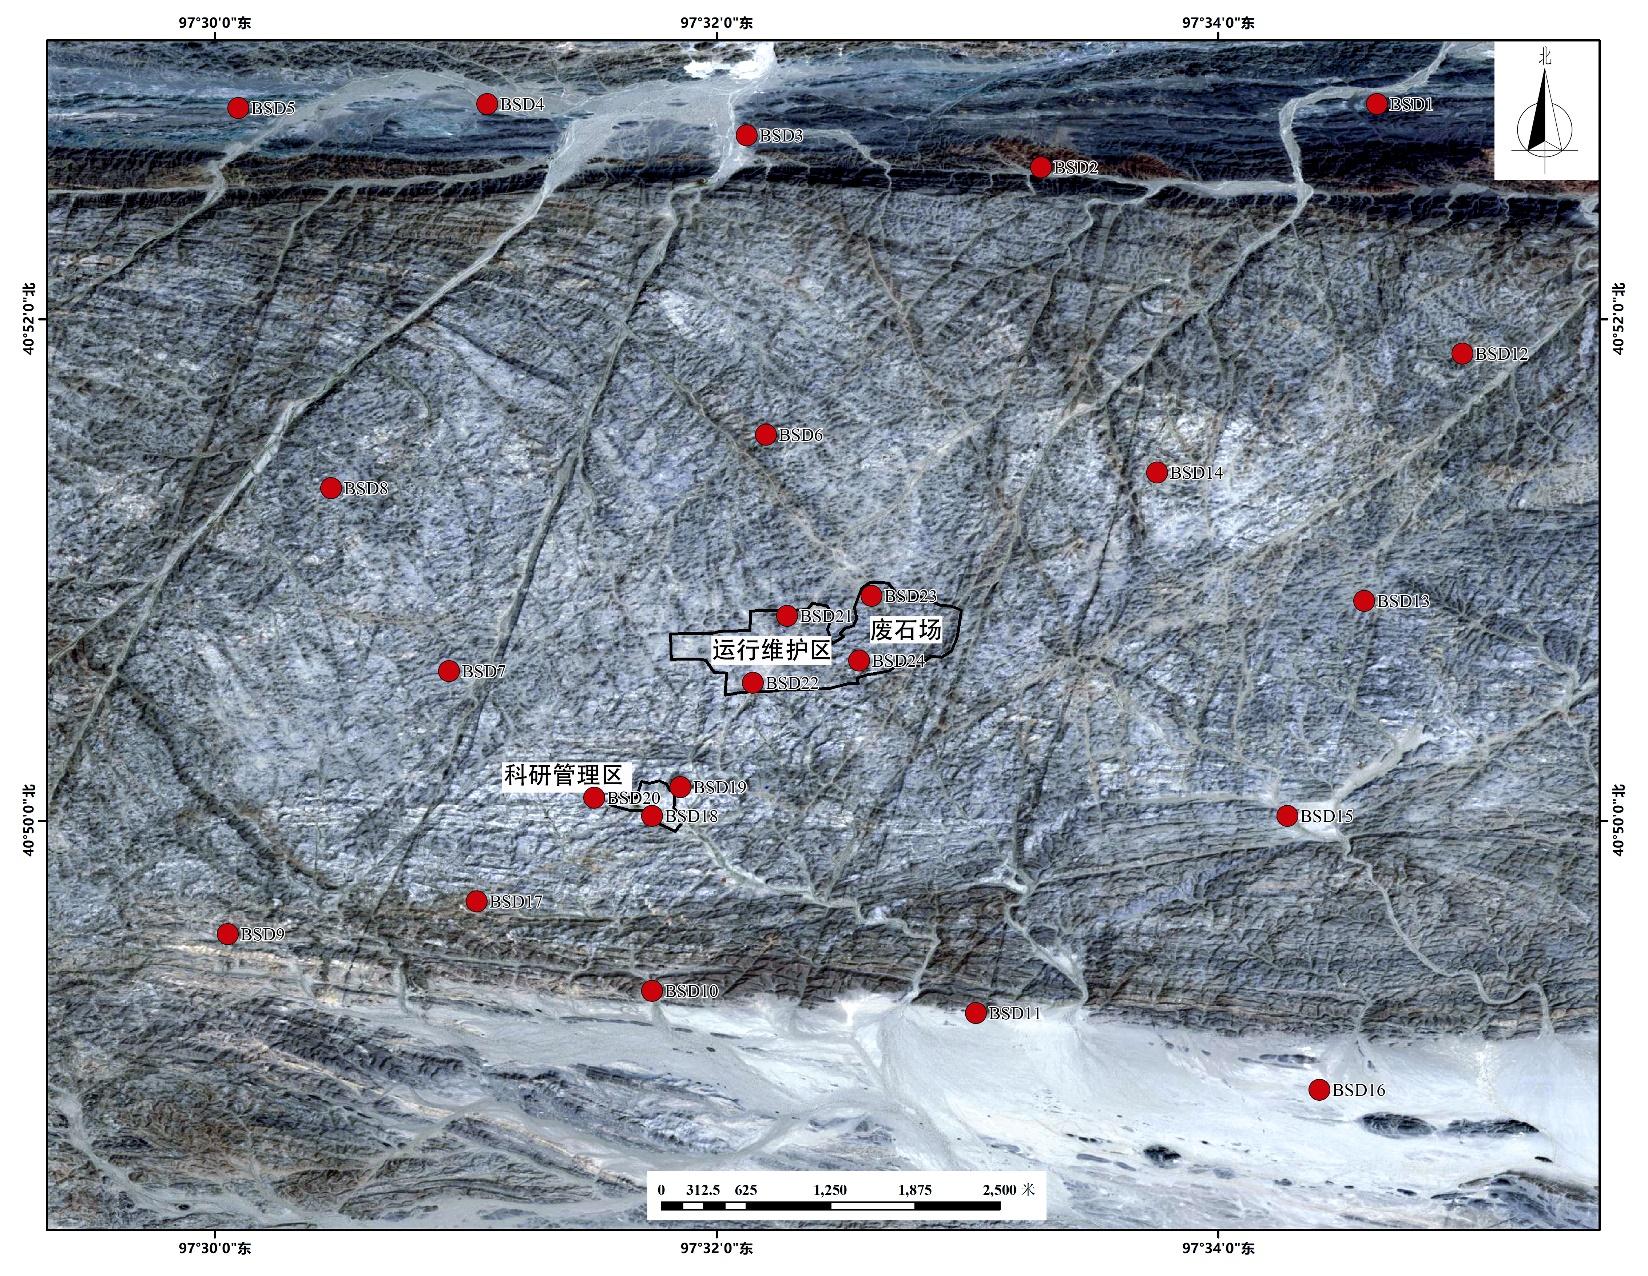
| 场区外 | 17 | BSD-01~BSD-17 | 11~32 | 18.4 | 18~54 | 32.5 | 16~64 | 28.6 | 16~54 | 29.3 |
| 科研管理区 | 3 | BSD-18~BSD-20 | 11~21 | 14.7 | 22~46 | 30.7 | 17~24 | 19.7 | 16~26 | 20 |
| 运行维护区 | 4 | BSD-21~BSD-24 | 10~31 | 17.3 | 22~54 | 36.3 | 17~43 | 26 | 19~41 | 25 |
表3 各区域空气氡浓度单因素方差分析(ANOVA)结果Table 3 ANOVA results of radon concentration in different areas |
| 场区 | 第1期 | 第2期 | 第3期 | 第4期 | |||||
|---|---|---|---|---|---|---|---|---|---|
| 平均值差值 | 显著性 | 平均值差值 | 显著性 | 平均值差值 | 显著性 | 平均值差值 | 显著性 | ||
| 场区外 | 科研管理区 | 3.69 | 0.35 | 1.04 | 0.87 | 10.92 | 0.19 | 10.59 | 0.13 |
| 运行维护区 | 1.10 | 0.75 | -5.04 | 0.37 | 4.59 | 0.52 | 4.84 | 0.43 | |
| 科研 管理区 | 场区外 | -3.69 | 0.35 | -1.04 | 0.87 | -10.92 | 0.19 | -10.59 | 0.13 |
| 运行维护区 | -2.58 | 0.59 | -6.08 | 0.43 | -6.33 | 0.52 | -5.75 | 0.49 | |
| 运行 维护区 | 场区外 | -1.10 | 0.75 | 5.04 | 0.37 | -4.59 | 0.52 | -4.84 | 0.43 |
| 科研管理区 | 2.58 | 0.59 | 6.08 | 0.43 | 6.33 | 0.52 | 5.75 | 0.49 | |
| 1 |
王驹, 苏锐, 陈亮, 等. 中国高放废物地质处置地下实验室场址筛选[J]. 世界核地质科学, 2022, 39(1):1-13.
|
| 2 |
|
| 3 |
王驹, 陈亮, 周志超, 等. 我国高放废物地质处置新突破[J]. 原子能科学技术, 2024, 58(增刊2):217-230. doi:10.7538/yzk.2024.youxian.0439.
|
| 4 |
夏子通, 凌辉, 范文哲, 等. 北山地下实验室场址环境监测方法研究[J]. 世界核地质科学, 2023, 40(增刊1):561-566.
|
| 5 |
秦春艳, 王南萍, 肖磊, 等. 北京广东典型地区室内氡气浓度与地质背景关系[J]. 物探与化探, 2012, 36(3):441-444.
|
| 6 |
甘光元, 蒲东. 某花岗岩质隧道放射性评价及工程措施[J]. 高速铁路技术, 2022, 13(2):53-56,66.
|
| 7 |
熊川宝, 杨悦, 刘自超, 等. 铁路隧道放射性全周期监测方法与评价[J]. 世界核地质科学, 2023, 40(4):1056-1064.
|
| 8 |
连相宇, 蒋乐祺. 青岛至京沪高铁辅助通道重点隧道地表放射性调查评价[J]. 西部资源, 2024(3):37-40.
|
| 9 |
贝新宇, 陈璋如. 国外高放废物地质处置库地下实验室环境监测与影响评价浅析[J]. 世界核地质科学, 2017, 34(3):58-64.
|
| 10 |
浙江省辐射环境监测站.辐射环境监测技术规范:HJ 1212—2021[S]. 北京: 生态环境部, 2021.
Radiation Monitoring Technical Center of Ministry of Ecology and Environment.Measurement methods for determination of radon in environmental air:HJ 1212—2021[S]. Beijing: Ministry of Ecology and Environment og the People’s Republic of China, 2021 (in Chinese).
|
| 11 |
陆建峰, 马永福, 张荣锁, 等. 全国辐射环境质量国控点空气中氡浓度累积测量方法研究[J]. 中国辐射卫生, 2017, 26(1):70-72.
|
| 12 |
张保增, 马晓. 退役铀尾矿库保护性开放利用工程环境氡浓度调查研究[J]. 环境科学与管理, 2021, 46(6):67-72.
|
| 13 |
徐立鹏, 陈立, 王先良, 等. 成都地铁氡浓度水平调查研究[J]. 辐射防护, 2024, 44(4):367-373.
|
| 14 |
|
| 15 |
董良, 武云云, 宋延超, 等. 宁夏城市和农村室内氡浓度初步调查[J]. 中华放射医学与防护杂志, 2024, 44(9):771-775.
|
| 16 |
|
/
| 〈 |
|
〉 |
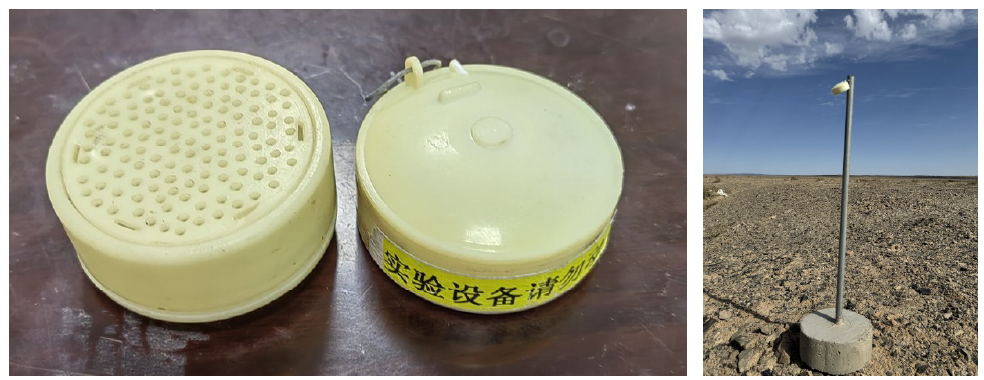
 氡探测器布放点位
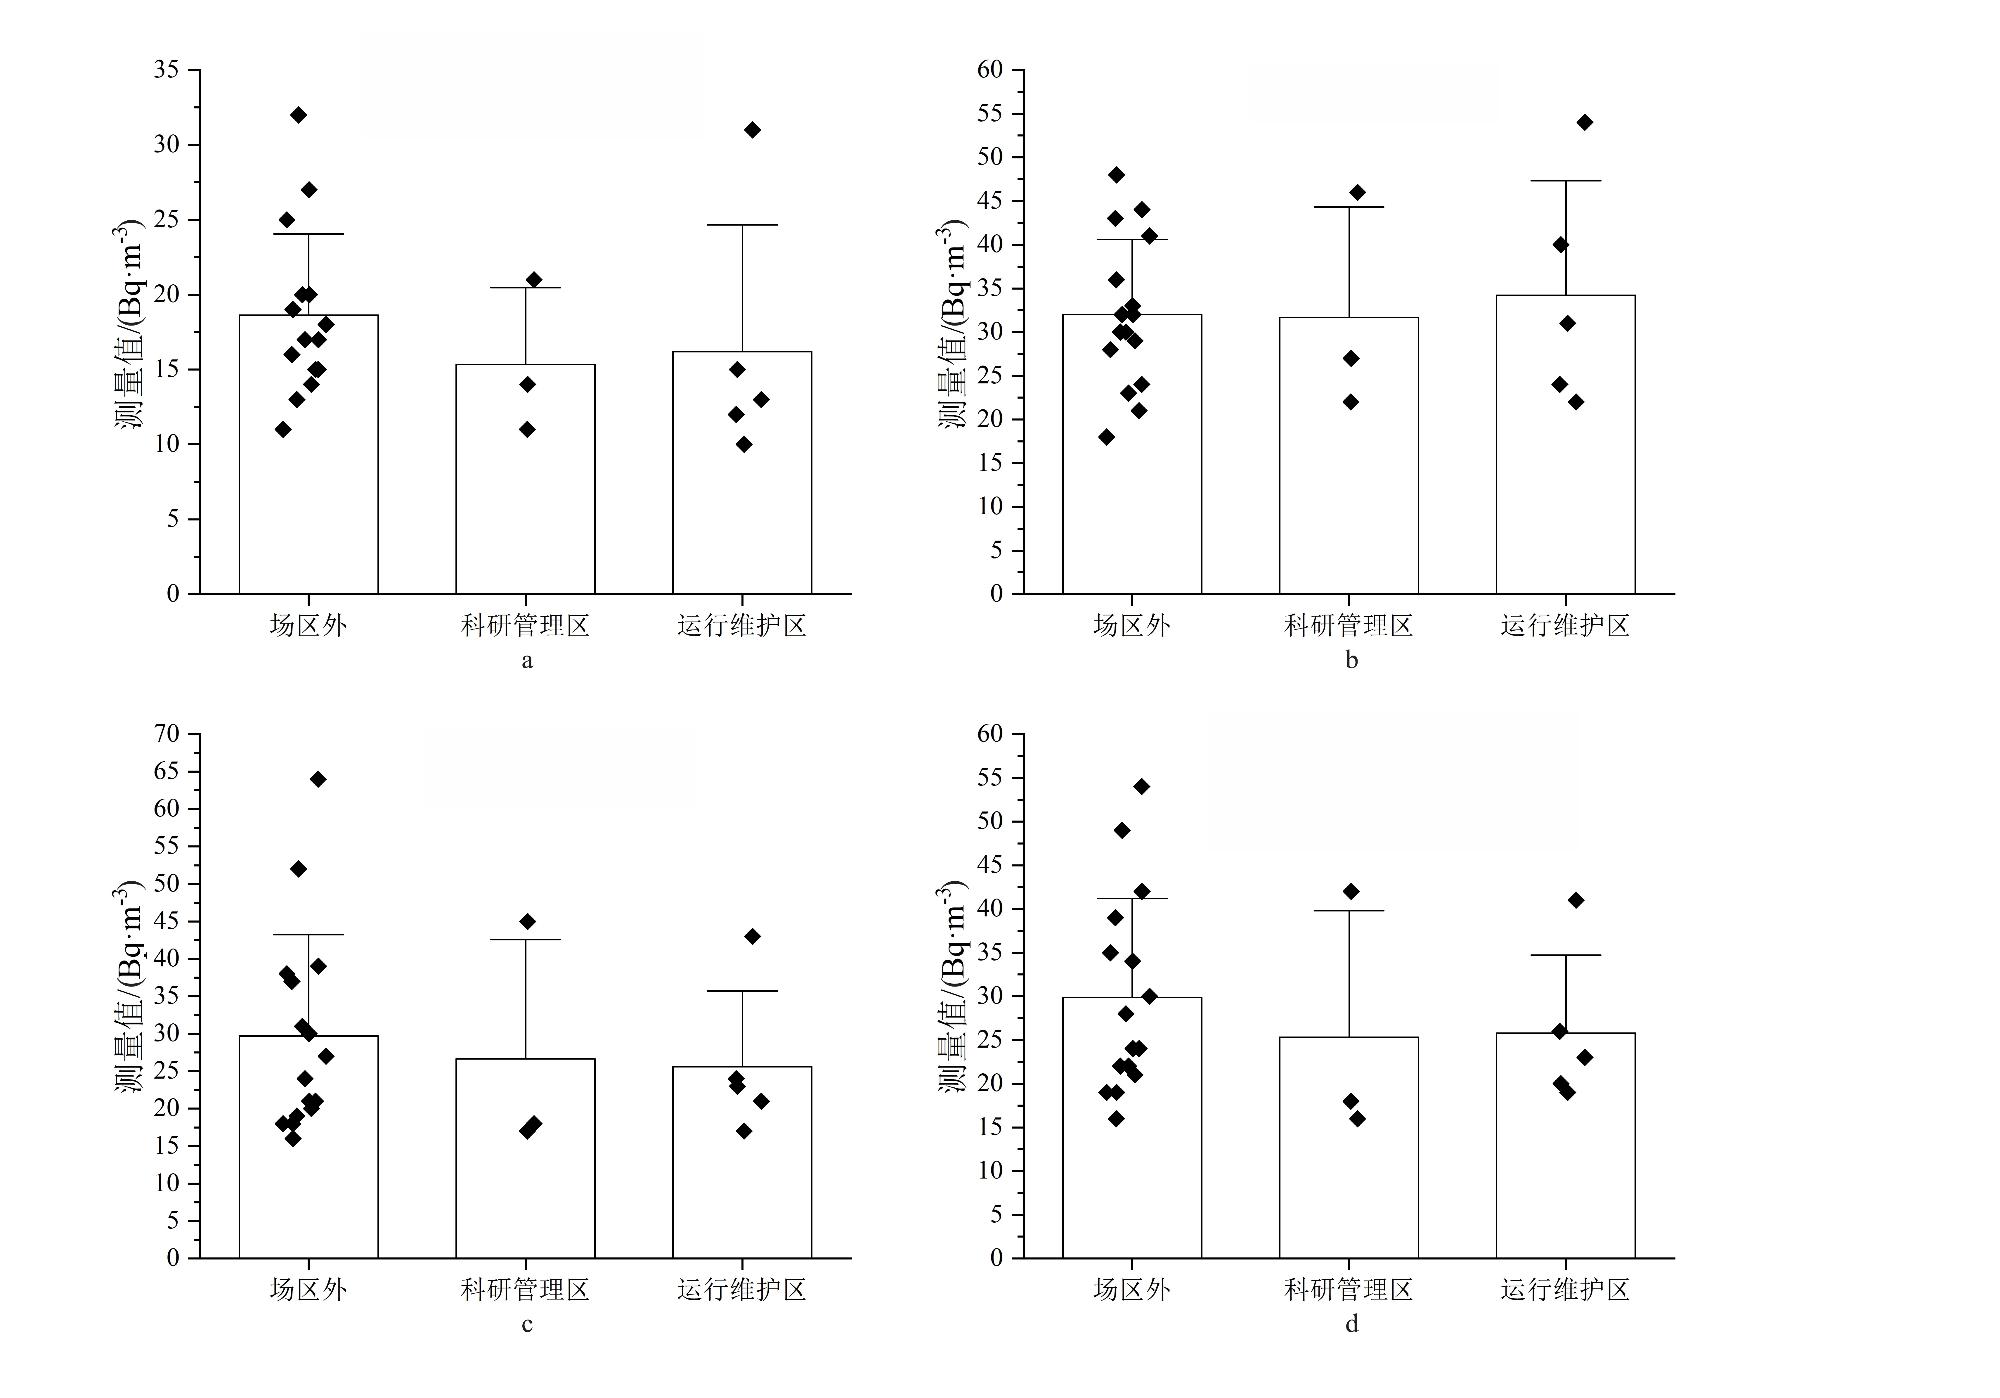