
Health assessment of Dongliangzhu River based on benthic index of biotic integrity
Received date: 2024-08-16
Revised date: 2024-09-25
Online published: 2026-03-12
Copyright
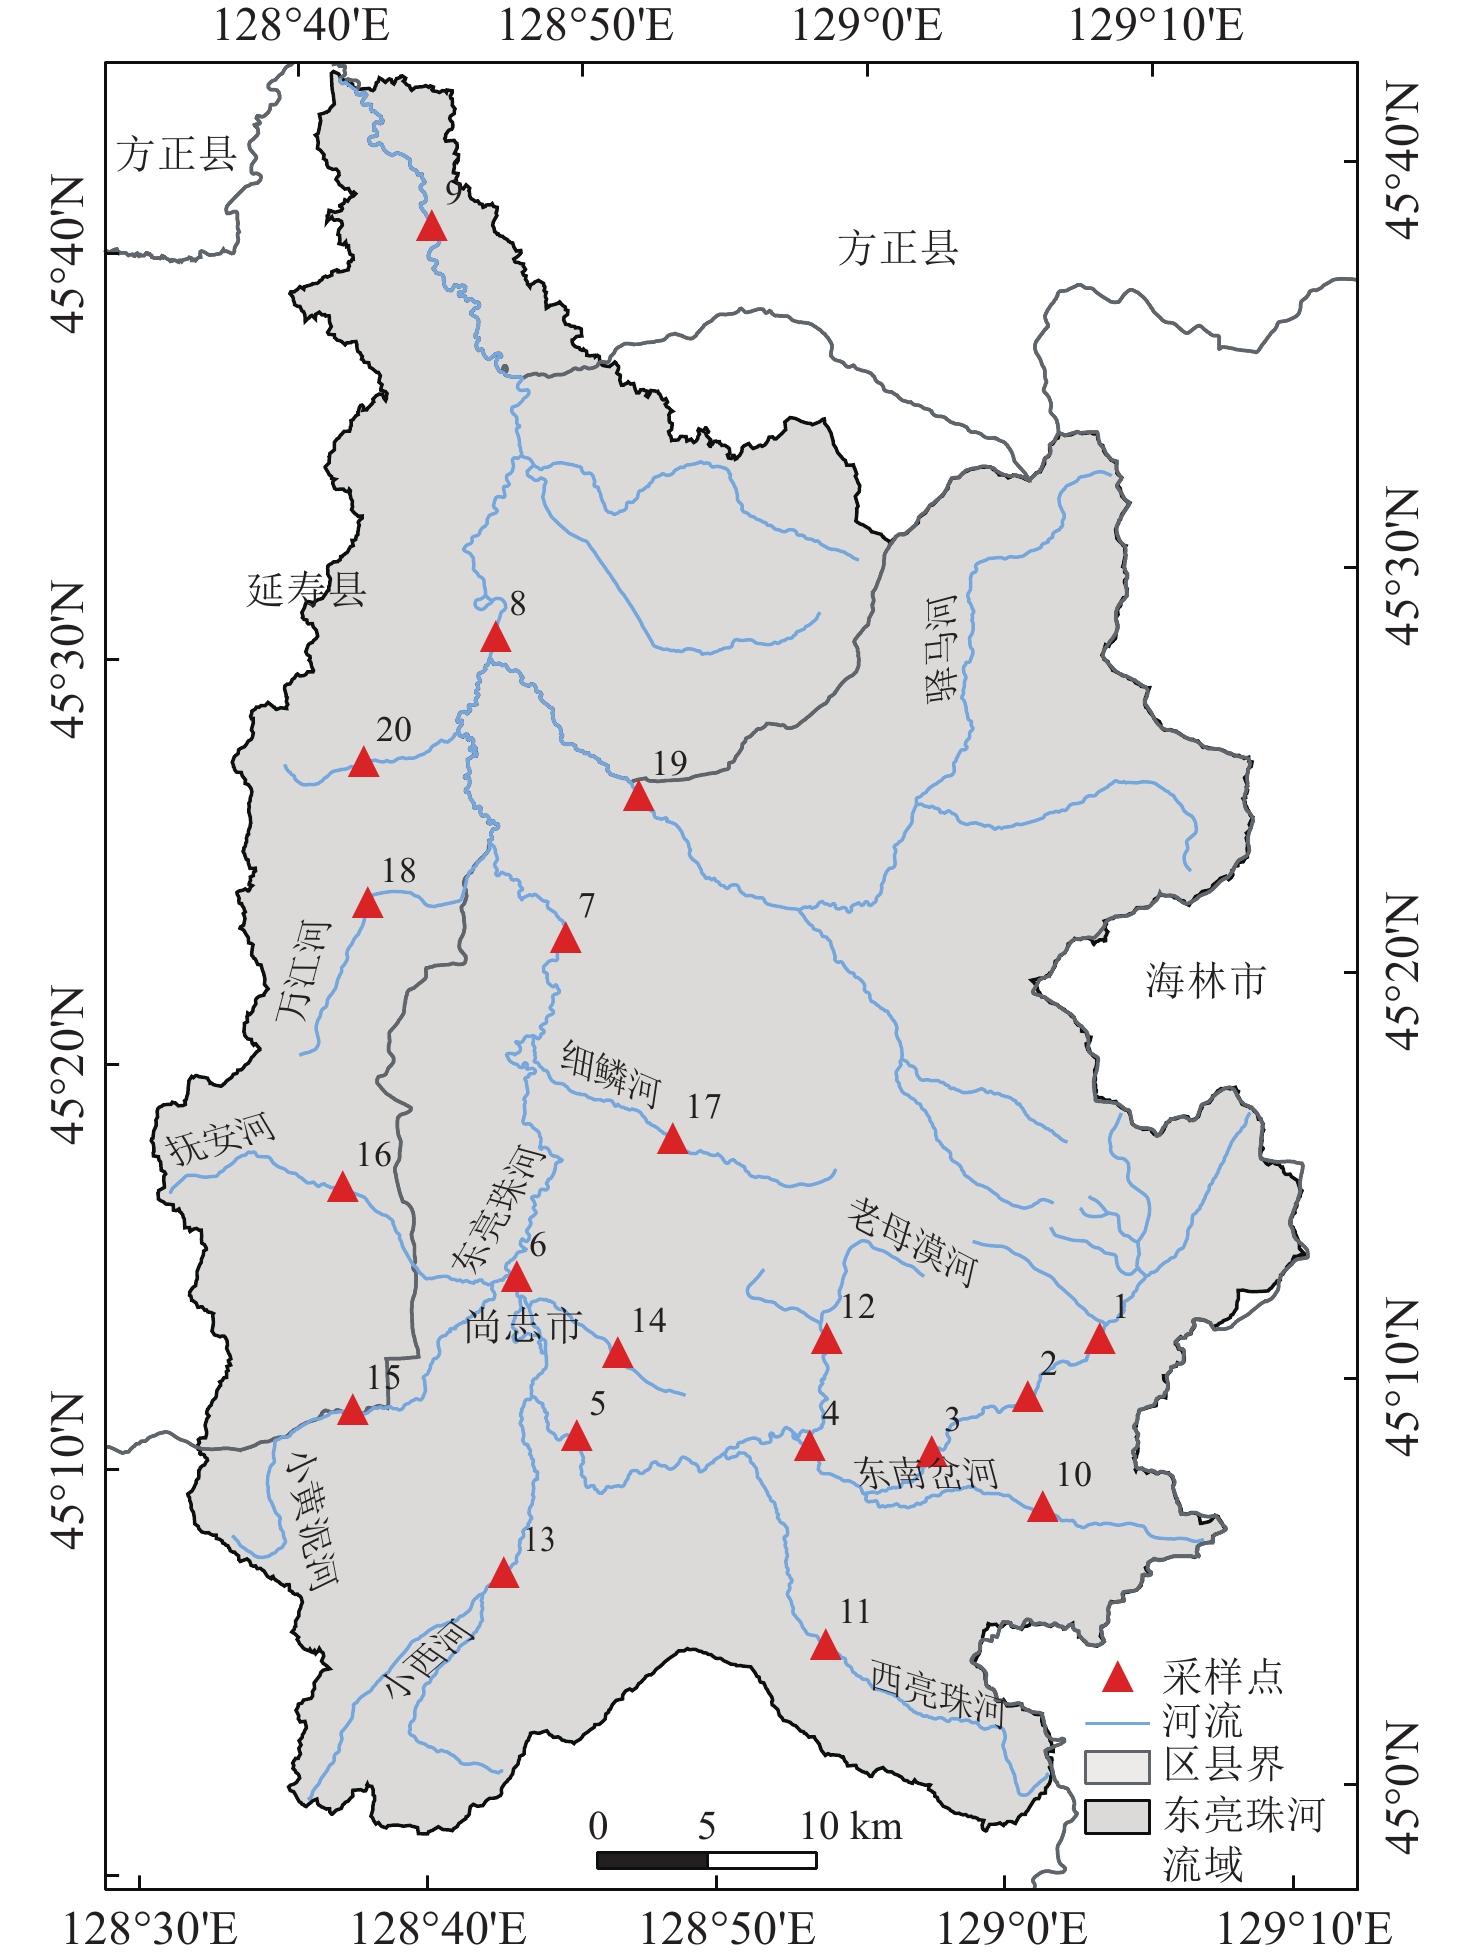
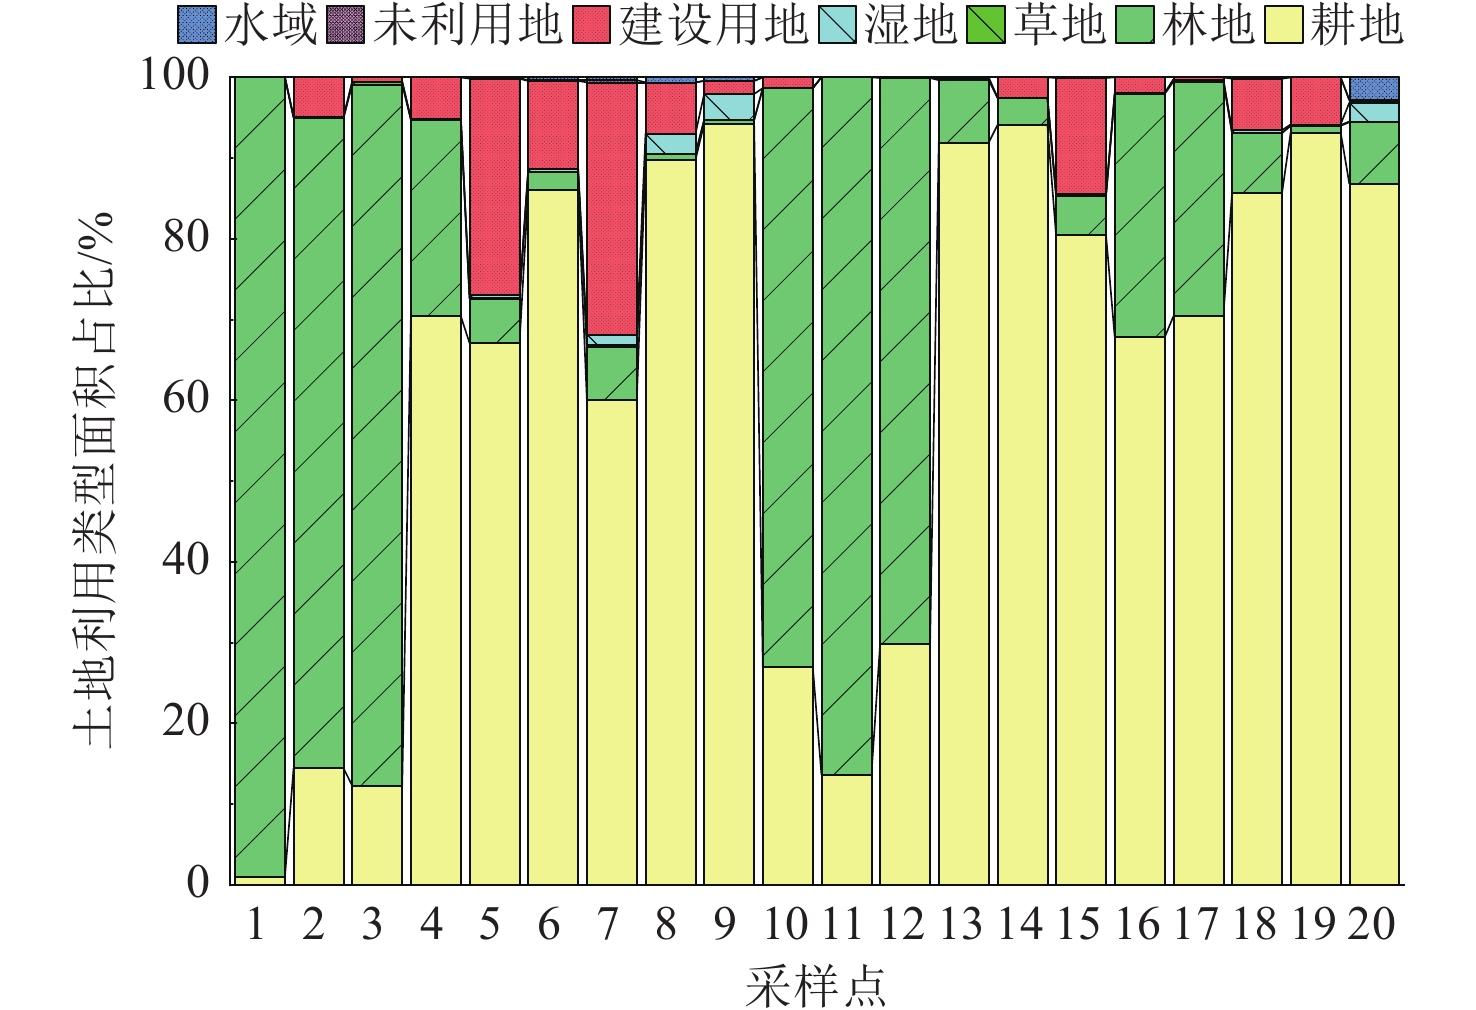
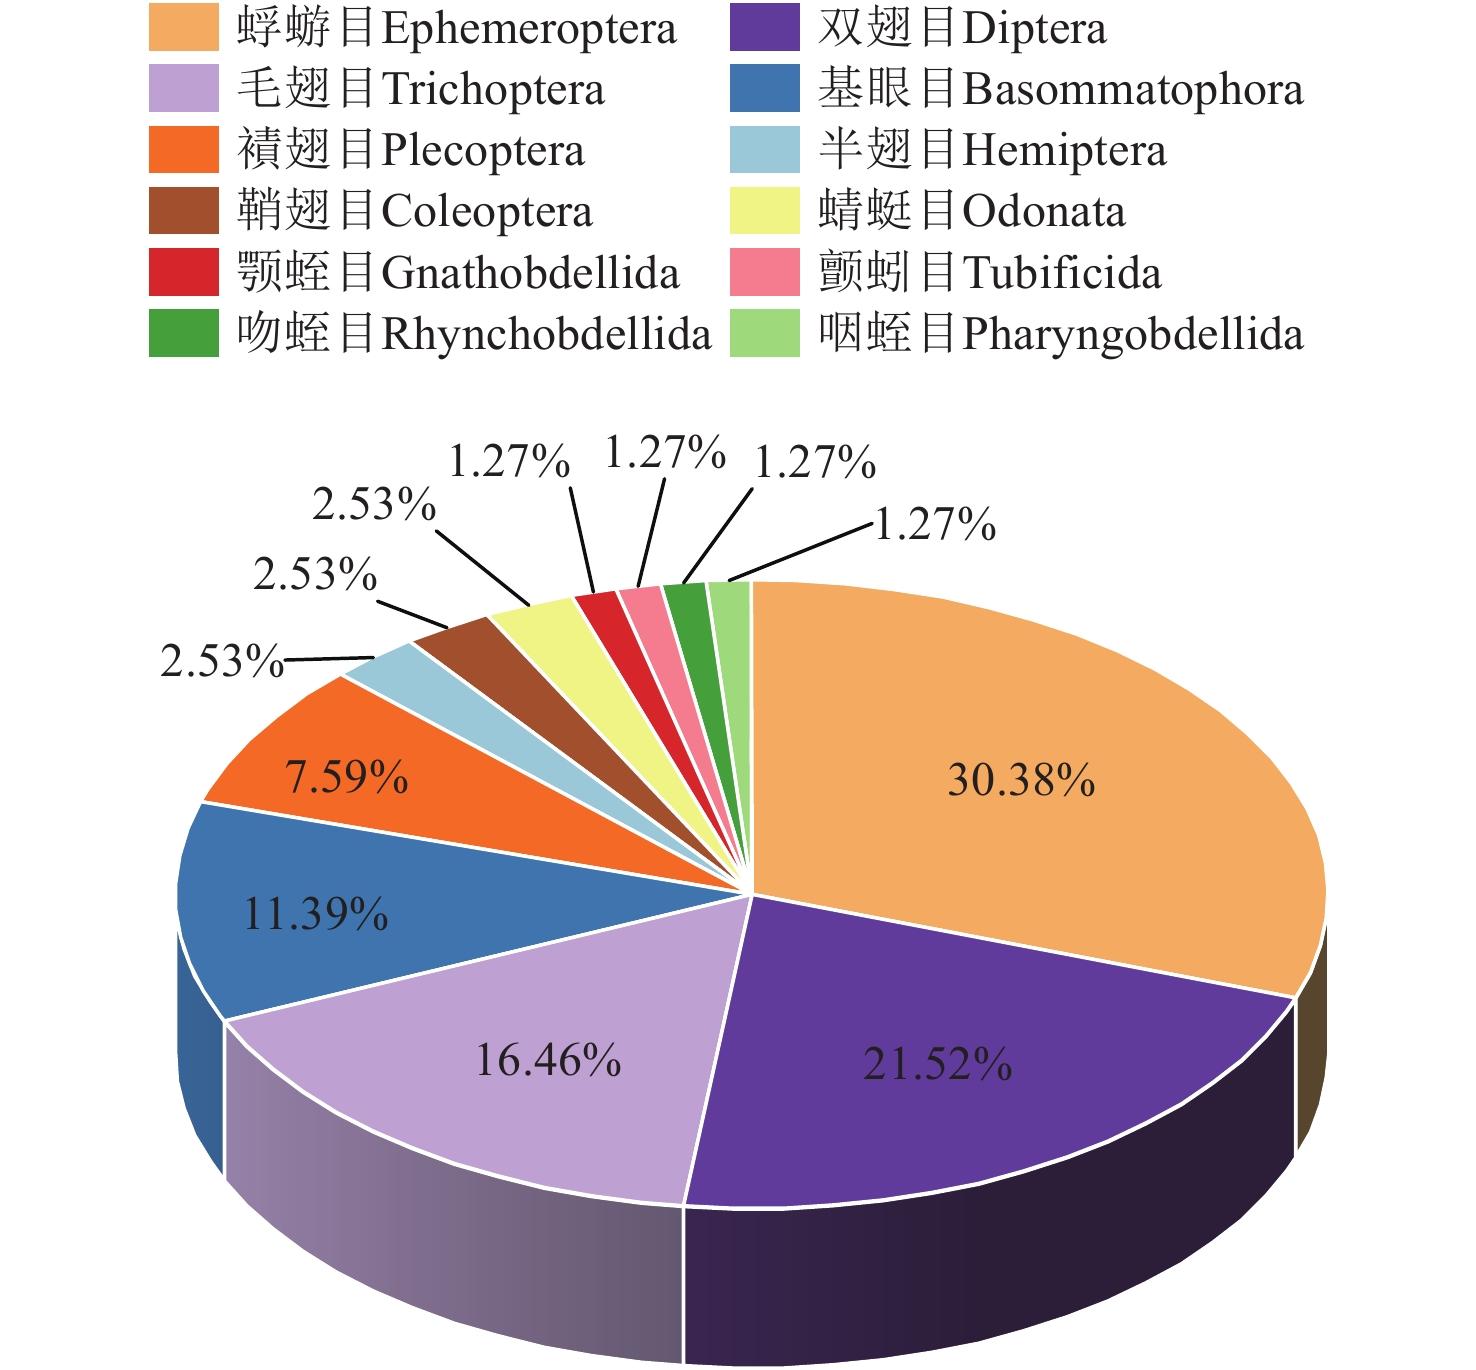
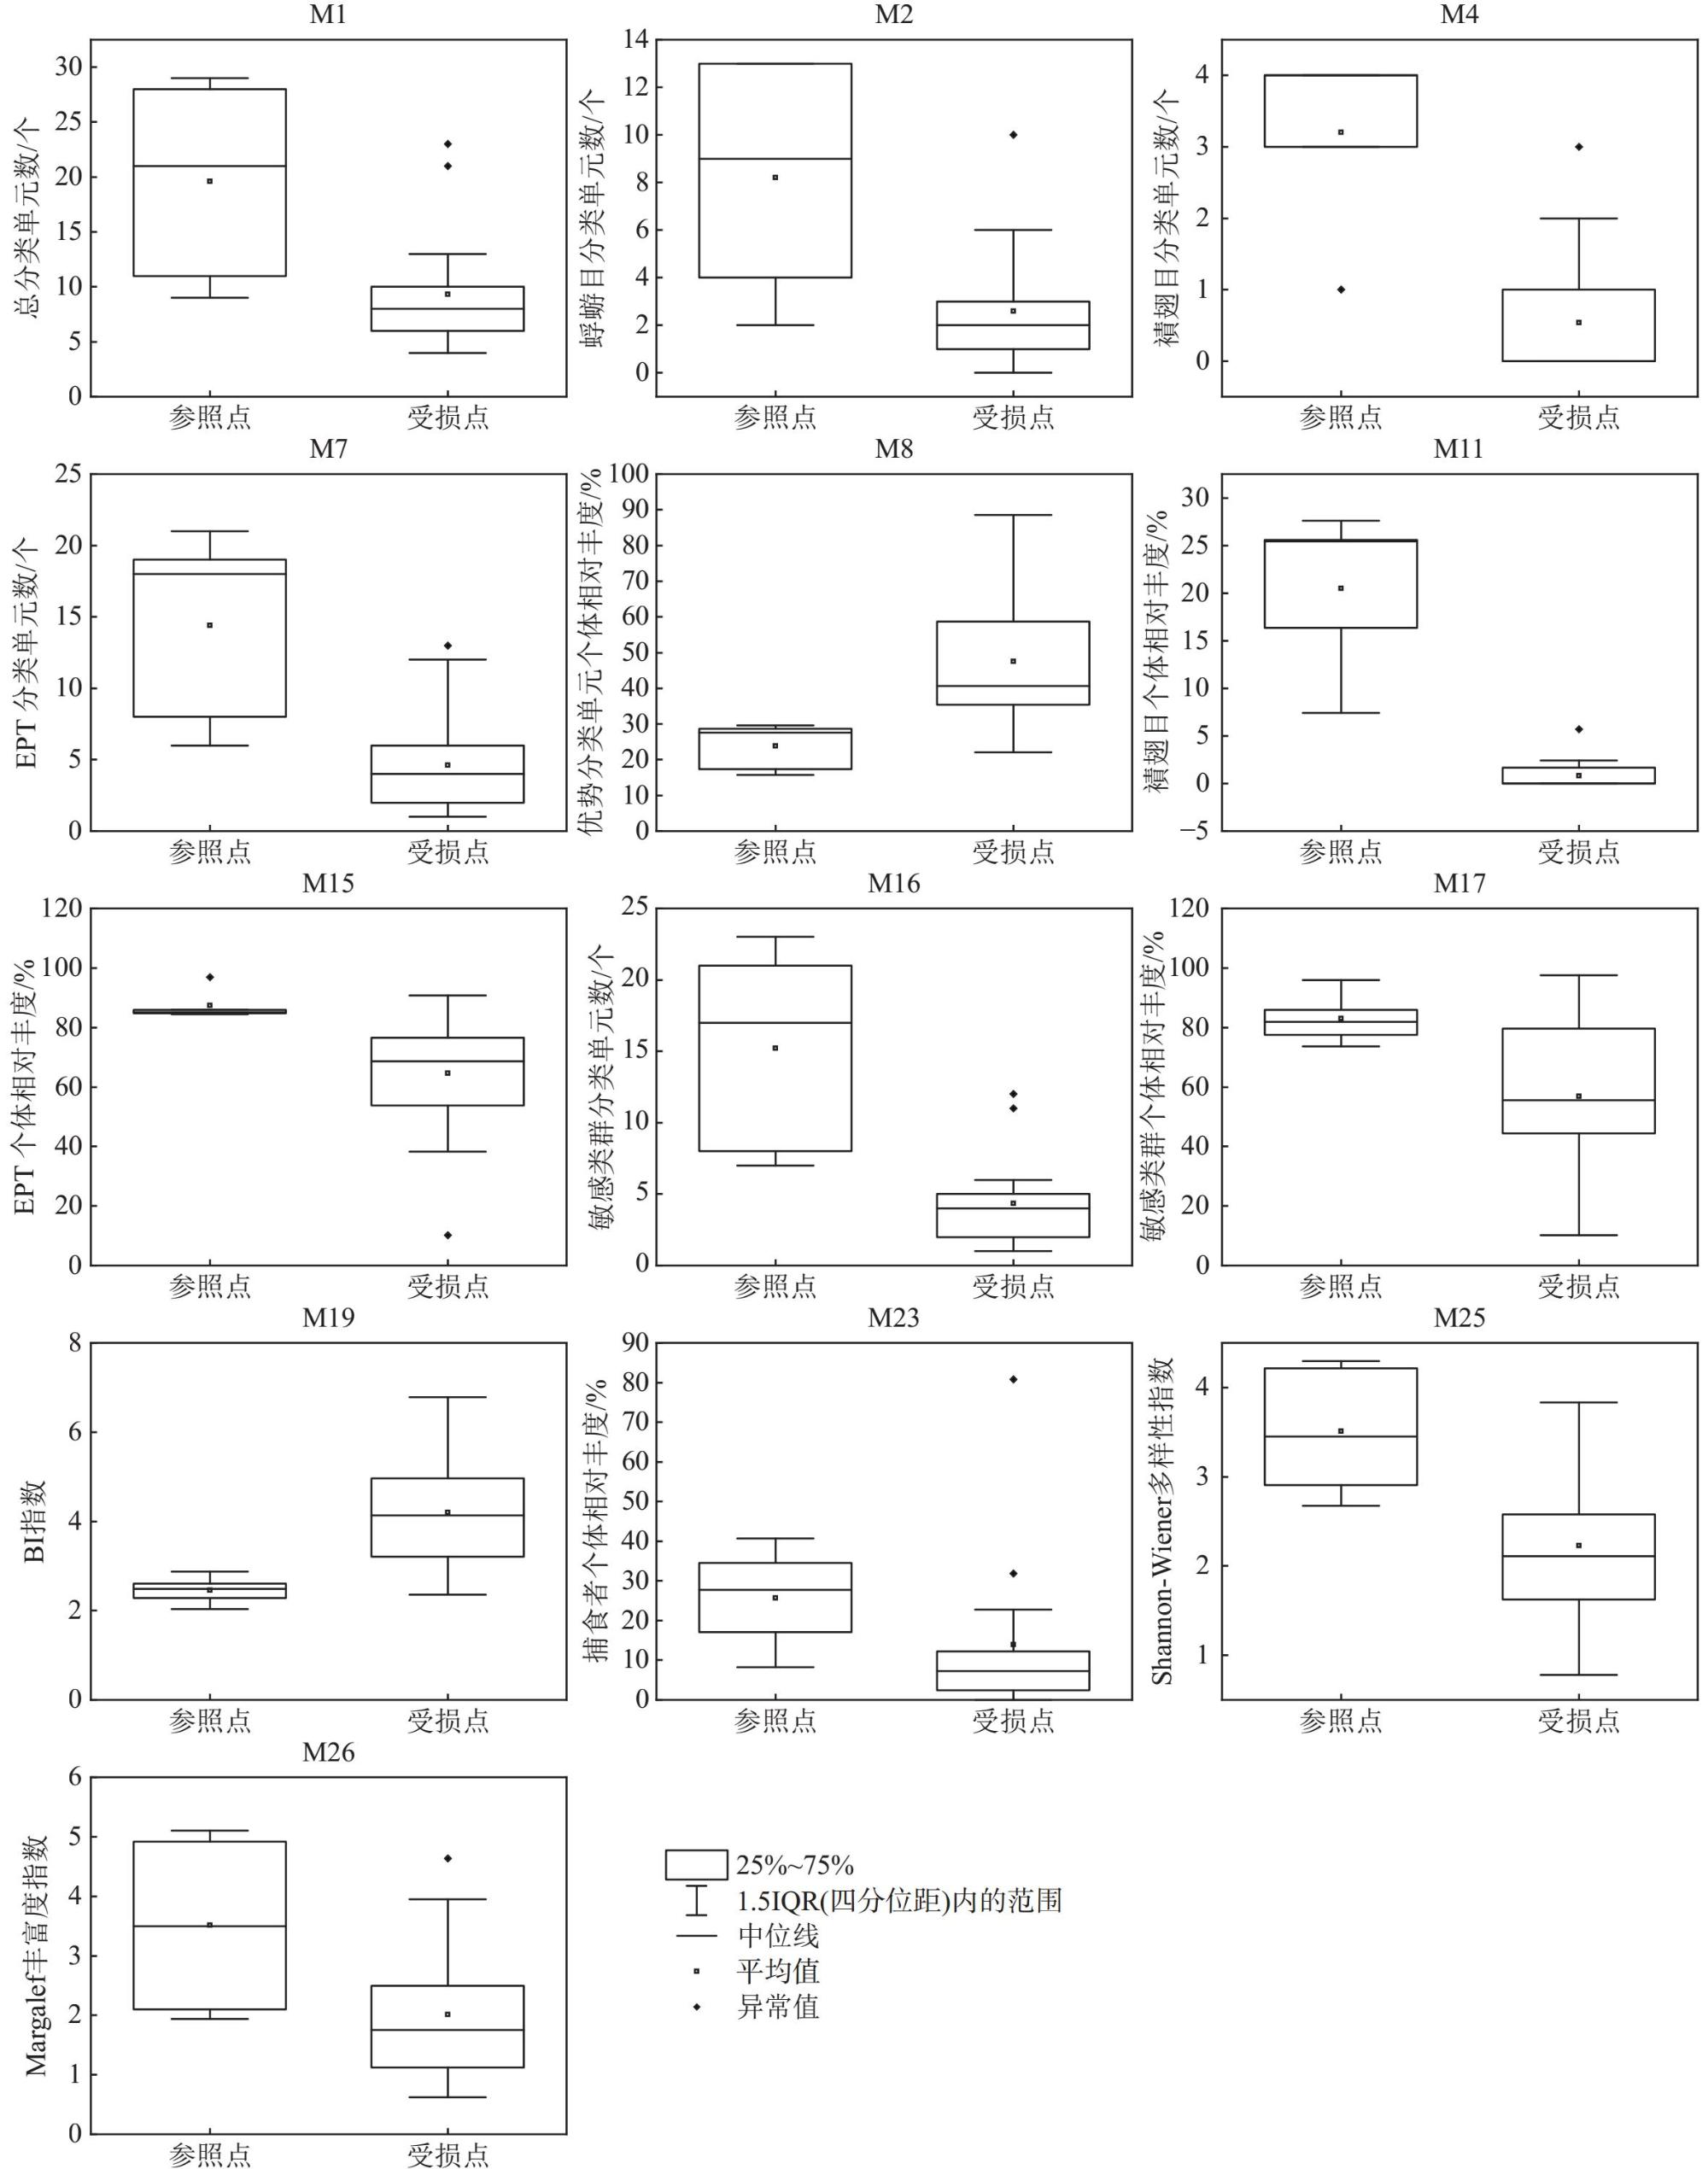
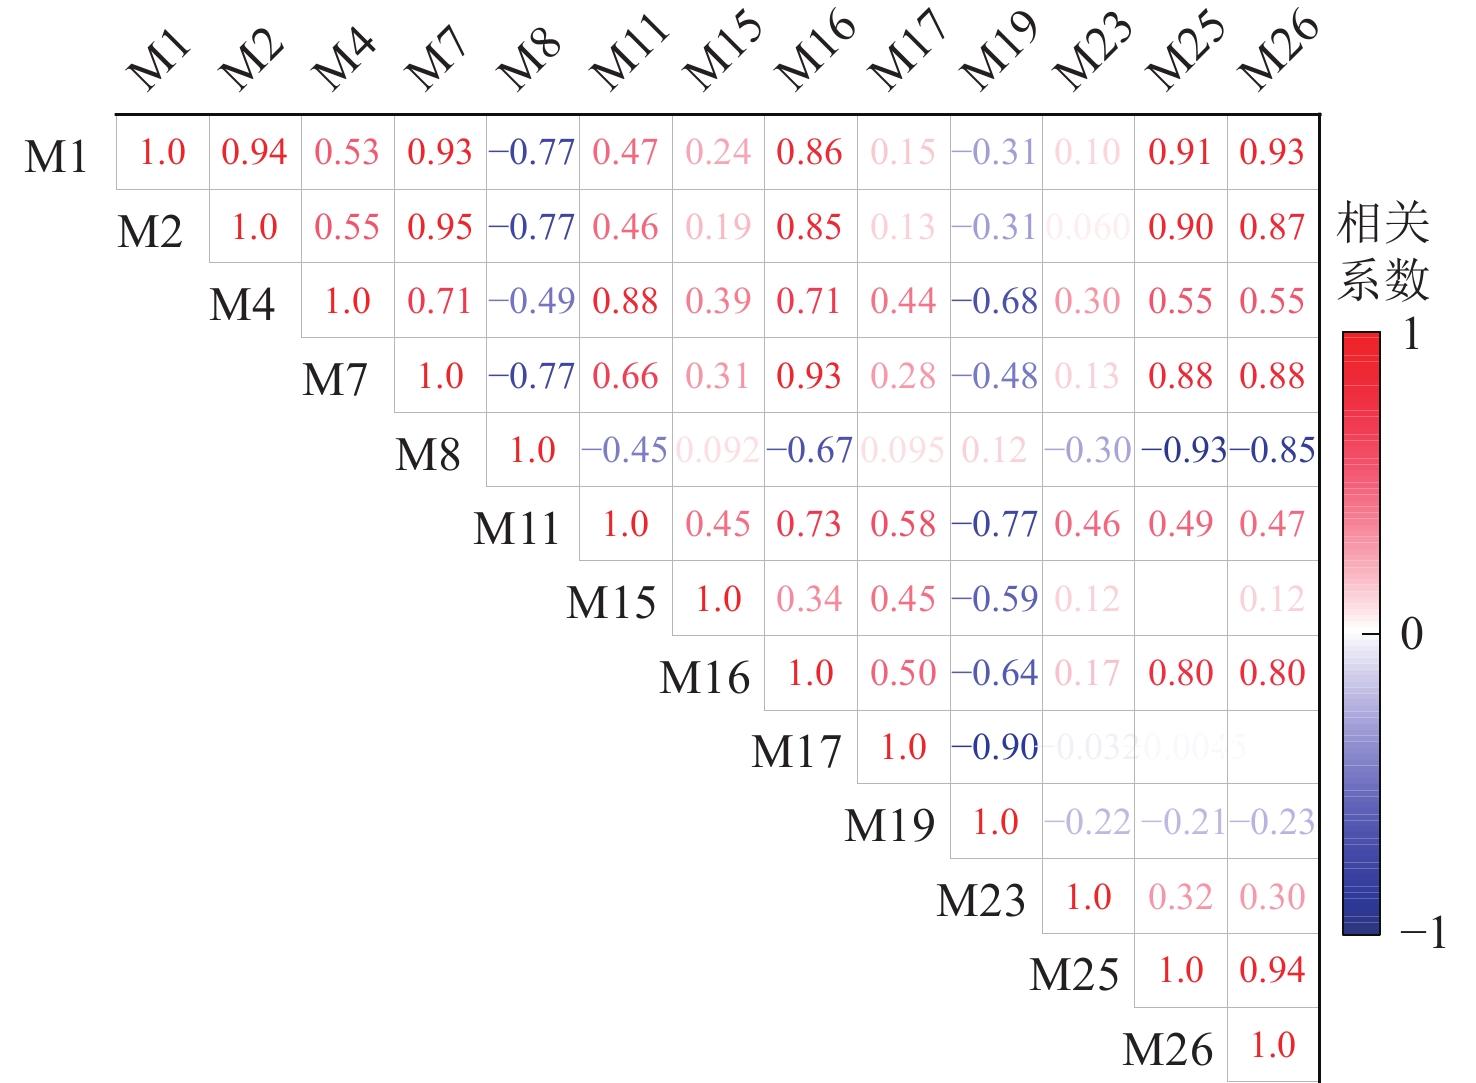
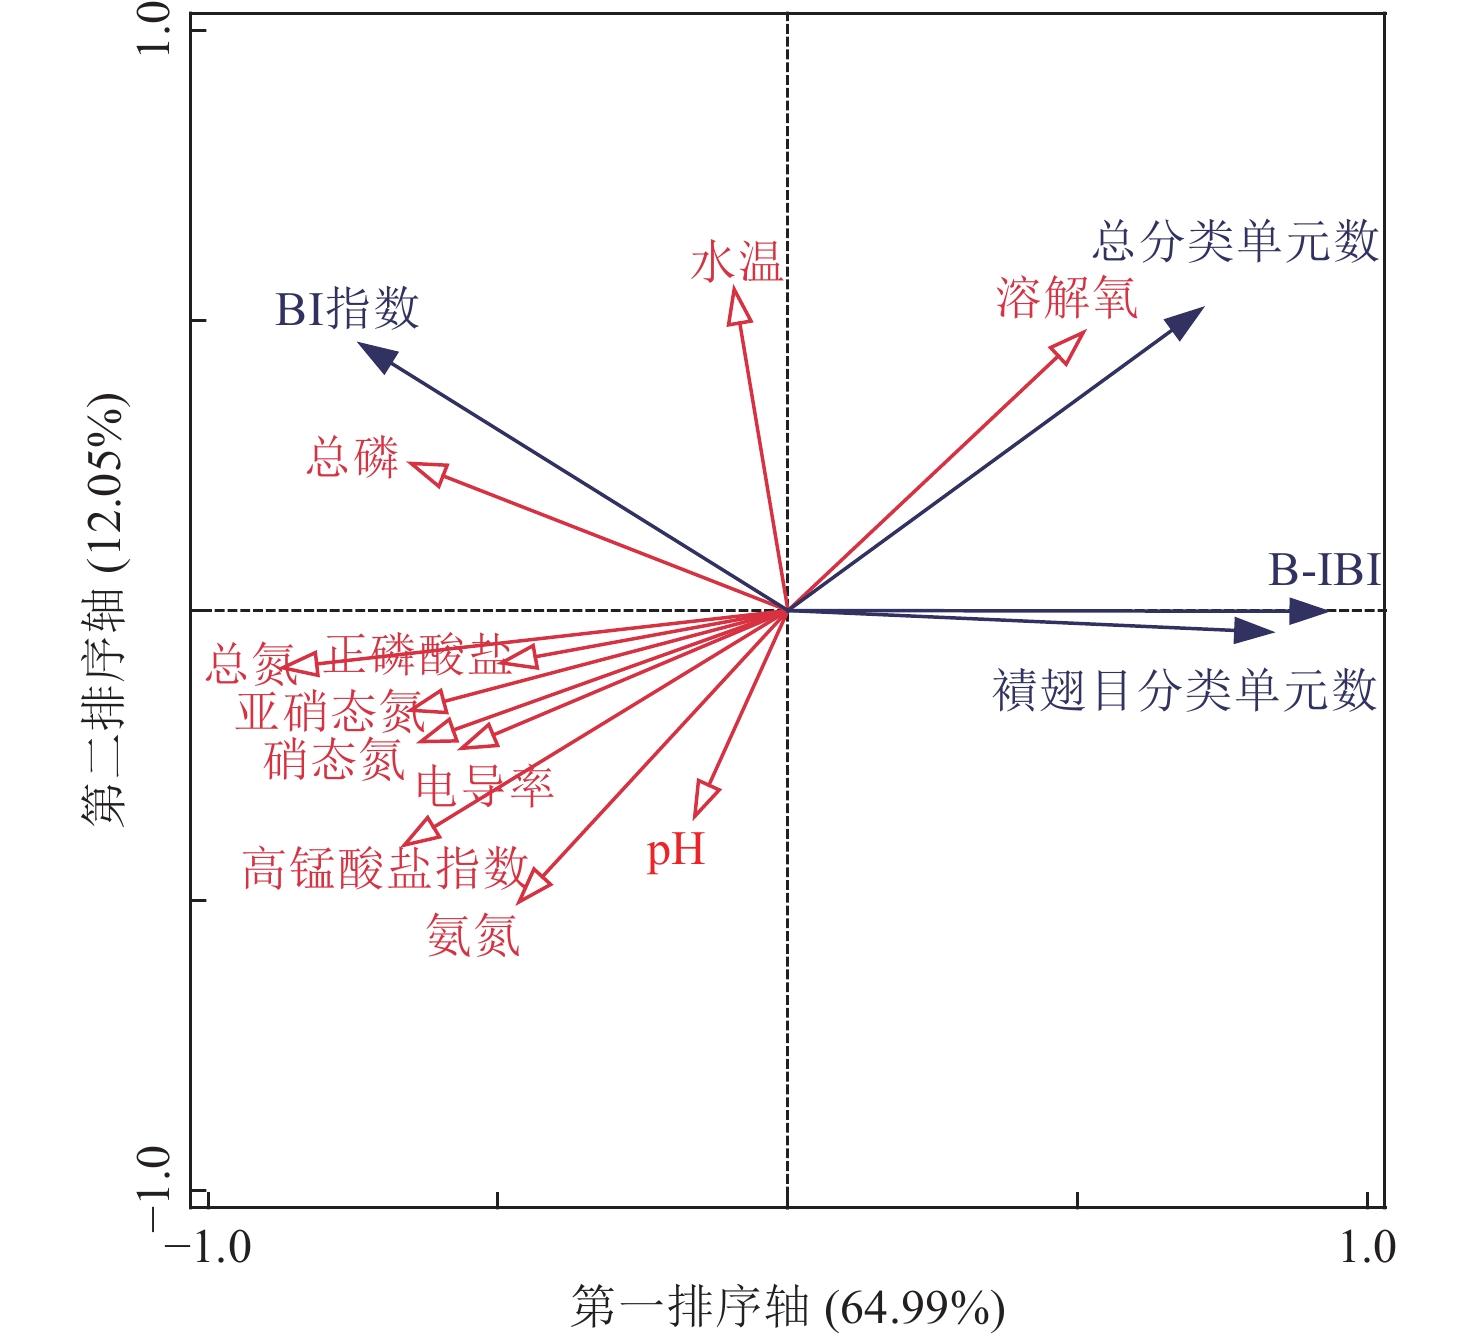
To assess the ecological health status of rivers in the Dongliangzhu River Basin of Songhuajiang River, 20 sampling sites were deployed across the basin. Macrobenthos community surveys were conducted in July (summer) 2023, October (autumn) 2023, and April (spring) 2024. Through analyses of the distribution range, discriminant ability, and correlation of 27 candidate indicators, three core indicators were finally selected to construct the evaluation system for the benthic-index of biotic integrity (B-IBI), namely the total number of taxa, the number of Plecoptera taxa, and the Biotic Index (BI). The ratio method was used to unify the dimension of each biological index, and the B-IBI value was obtained by summing the scores of individual indices. Based on the 25th percentile of B-IBI values at reference sites, the health assessment criteria for the Dongliangzhu River were ultimately established. Among the 20 sampling sites, 4 were classified as "healthy", 4 as "sub-healthy", 4 as "average", 5 as "poor", and 3 as "very poor". The average B-IBI score was 1.39, which fell into the "average" category according to the established assessment criteria. Water physicochemical indicators were identified as key environmental factors affecting the B-IBI assessment results of the Dongliangzhu River, with total phosphorus (TP), total nitrogen (TN), ammonia nitrogen (NH3-N), nitrate nitrogen (NO3−-N), nitrite nitrogen (NO2−-N), permanganate index (CODMn), dissolved oxygen (DO), and electrical conductivity (EC) showing significant correlations with B-IBI values. Additionally, land use types had significant impacts on both the B-IBI assessment results and water physicochemical indicators of the basin, among which the area proportions of forestland and cropland were the critical land use type indices. Furthermore, human activity disturbances, as important drivers of land use changes, were also the main environmental factors leading to variations in the B-IBI assessment results of the Dongliangzhu River.
Wang Yan , Zhao Zhangguo , Yao Yanling , Shi Jinbin , Wang Tianliang , Gao Zhongsi , Wang Huibo , Zhao Chen , Wang Le , Huo Tangbin . Health assessment of Dongliangzhu River based on benthic index of biotic integrity[J]. Wetland Science, 2025 , 23(6) : 1146 -1157 . DOI: 10.13248/j.cnki.wetlandsci.20240228
1 Candidate metrics for B-IBI and their expected direction of response to disturbance构建B-IBI指标体系的候选指标及对干扰的反应 |
| 指标类型 | 指标 序号 | 候选指标 | 对干扰的 反应 |
| 注:EPT中的E为蜉蝣目Ephemeroptera,P为襀翅目Plecoptera,T为毛翅目Trichoptera。 | |||
| 群落丰富度 | M1 | 总分类单元数 | 减小 |
| M2 | 蜉蝣目分类单元数 | 减小 | |
| M3 | 毛翅目分类单元数 | 减小 | |
| M4 | 襀翅目分类单元数 | 减小 | |
| M5 | 摇蚊科分类单元数 | 增大 | |
| M6 | 软体动物分类单元数 | 减小 | |
| M7 | EPT 分类单元数 | 减小 | |
| 各类群相对丰度 | M8 | 优势分类单元个体相对丰度 | 增大 |
| M9 | 蜉蝣目个体相对丰度 | 减小 | |
| M10 | 毛翅目个体相对丰度 | 减小 | |
| M11 | 襀翅目个体相对丰度 | 减小 | |
| M12 | 摇蚊个体相对丰度 | 增大 | |
| M13 | 寡毛类个体相对丰度 | 增大 | |
| M14 | 软体动物个体相对丰度 | 减小 | |
| M15 | EPT 个体相对丰度 | 减小 | |
| 耐污能力 | M16 | 敏感类群分类单元数(耐污值≤3) | 减小 |
| M17 | 敏感类群个体相对丰度 | 减小 | |
| M18 | 耐污类群个体相对丰度 | 增大 | |
| M19 | BI指数(Biotic Index) | 增大 | |
| 功能摄食类群 | M20 | 滤食收集者个体相对丰度 | 减小 |
| M21 | 直接收集者个体相对丰度 | 增大 | |
| M22 | 刮食者个体相对丰度 | 减小 | |
| M23 | 捕食者个体相对丰度 | 减小 | |
| M24 | 撕食者个体相对丰度 | 增大 | |
| 群落多样性 | M25 | Shannon-Wiener多样性指数 | 减小 |
| M26 | Margalef丰富度指数 | 减小 | |
| M27 | Pielou均匀度指数 | 减小 | |
2 Variation range and evaluation result of water quality index in the Dongliangzhu River Basin东亮珠河水质指标变化范围及评价结果 |
| 总磷质量 浓度/ (mg/L) | 总氮质量 浓度/ (mg/L) | 氨氮质量 浓度/ (mg/L) | 硝态氮质量 浓度/ (mg/L) | 亚硝态氮 质量浓度/ (mg/L) | 正磷酸盐 质量浓度/ (mg/L) | 高锰酸盐 指数/ (mg/L) | 水温/℃ | pH | 溶解氧 质量浓度/ (mg/L) | 电导率/ (μS/cm) | |
| 注:–表示《地表水环境质量标准》(GB3838-2002)中未做规定的项目。 | |||||||||||
| 范围 | 0.05~0.23 | 1.14~3.44 | 0.05~0.62 | 0.81~3.19 | 0.00~0.02 | 0.01~0.07 | 2.63~12.19 | 5.60~12.03 | 6.73~7.52 | 8.90~14.41 | 44.50~130.30 |
| 评价结果 | Ⅱ~Ⅳ类 | Ⅲ~Ⅴ类 | Ⅰ~Ⅲ类 | − | − | − | Ⅰ~Ⅱ类 | − | − | Ⅰ 类 | − |
3 Formulas for calculating 3 metrics scores by ratio scoring method采用比值法计算3个指标分值的公式 |
| 指标 | 分值计算公式 |
| 总分类单元数 | 总分类单元数/28.05 |
| 襀翅目分类单元数 | 襀翅目分类单元数/4 |
| BI指数 | (6.79−BI指数)/(6.79−2.27) |
4 Criteria of health assessment of B-IBI for Dongliangzhu River东亮珠河流域B-IBI健康评价标准 |
| 评价等级 | 评分范围 |
| 健康 | >2.07 |
| 亚健康 | >1.55~2.07 |
| 一般 | >1.03~1.55 |
| 较差 | 0.52~1.03 |
| 极差 | <0.52 |
5 Statuses of aquatic ecological health of sampling sites in Dongliangzhu River东亮珠河各采样点的水生态健康状况 |
| 采样点 序号 | 采样点 性质 | 分值 | 健康 状况 | 采样点 序号 | 采样点 性质 | 分值 | 健康 状况 | |
| 1 | 参照点 | 2.86 | 健康 | 11 | 受损点 | 1.71 | 亚健康 | |
| 2 | 参照点 | 2.95 | 健康 | 12 | 参照点 | 2.07 | 健康 | |
| 3 | 参照点 | 2.75 | 健康 | 13 | 受损点 | 1.12 | 一般 | |
| 4 | 受损点 | 1.59 | 亚健康 | 14 | 受损点 | 0.94 | 较差 | |
| 5 | 受损点 | 1.22 | 一般 | 15 | 受损点 | 1.10 | 一般 | |
| 6 | 受损点 | 1.03 | 较差 | 16 | 受损点 | 0.45 | 极差 | |
| 7 | 受损点 | 0.92 | 较差 | 17 | 受损点 | 1.73 | 亚健康 | |
| 8 | 受损点 | 1.02 | 较差 | 18 | 受损点 | 1.29 | 一般 | |
| 9 | 受损点 | 0.14 | 极差 | 19 | 受损点 | 0.91 | 较差 | |
| 10 | 参照点 | 1.57 | 亚健康 | 20 | 受损点 | 0.43 | 极差 |
6 Spearman correlation coefficients between core indicators of B-IBI in the Dongliangzhu River and water physicochemical indicators东亮珠河B-IBI 评价体系核心指标与水体理化指标的Spearman相关系数 |
| 理化指标 | M1 | M4 | M19 | B-IBI评分 |
| 注:*和**分别表示在p<0.05和p<0.01水平显著相关。各指标含义见表1。 | ||||
| 总磷含量 | −0.47* | −0.67** | 0.70** | −0.69** |
| 总氮含量 | −0.71** | −0.56** | 0.34 | −0.58** |
| 氨氮含量 | −0.74** | −0.75** | 0.39 | −0.70** |
| 硝态氮含量 | −0.65** | −0.44* | 0.09 | −0.44* |
| 亚硝态氮含量 | −0.68** | −0.72** | 0.60** | −0.76** |
| 正磷酸盐含量 | −0.41 | −0.29 | 0.24 | −0.31 |
| 高锰酸盐指数 | −0.80** | −0.61** | 0.54* | −0.75** |
| 水温 | 0.47* | 0.03 | 0.33 | −0.02 |
| pH | −0.36 | −0.11 | 0.22 | −0.38 |
| 溶解氧含量 | 0.52* | 0.46* | −0.35 | 0.55* |
| 电导率 | −0.65** | −0.71** | 0.51* | −0.69** |
7 Spearman correlation coefficients among land use types in the 1 000 m buffer zone of sampling sites in the Dongliangzhu River, B-IBI values, and water physicochemical indicators东亮珠河采样点1 000 m缓冲区内土地利用类型与B-IBI值和水体理化指标的Spearman相关系数 |
| 土地利用 类型面积 | B-IBI 得分 | 总磷 含量 | 总氮 含量 | 氨氮 含量 | 高锰酸盐 指数 | 电导率 |
| 注:*和**分别表示在p<0.05和p<0.01水平显著相关。 | ||||||
| 耕地 | −0.75** | 0.49* | 0.58** | 0.73** | 0.64** | 0.71** |
| 林地 | 0.76** | −0.56** | −0.52* | −0.57** | −0.51* | −0.61** |
| 草地 | 0.09 | 0.07 | 0.02 | 0.10 | 0.05 | 0.10 |
| 湿地 | −0.73** | 0.59** | 0.24 | 0.48* | 0.59** | 0.66** |
| 建设用地 | −0.36 | 0.31 | 0.11 | 0.26 | 0.19 | 0.29 |
| 未利用地 | −0.35 | 0.34 | 0.00 | 0.51* | 0.39 | 0.58** |
| 水域 | −0.62** | 0.63** | 0.10 | 0.40 | 0.46* | 0.62** |
| 1 |
| 2 |
| 3 |
| 4 |
| 5 |
| 6 |
| 7 |
| 8 |
| 9 |
| 10 |
| 11 |
| 12 |
| 13 |
| 14 |
| 15 |
| 16 |
| 17 |
| 18 |
| 19 |
| 20 |
| 21 |
| 22 |
| 23 |
| 24 |
| 25 |
| 26 |
| 27 |
| 28 |
| 29 |
| 30 |
| 31 |
| 32 |
| 33 |
| 34 |
| 35 |
| 36 |
| 37 |
| 38 |
| 39 |
| 40 |
| 41 |
| 42 |
| 43 |
| 44 |
| 45 |
| 46 |
| 47 |
/
| 〈 |
|
〉 |