
Spatial-temporal changes of shorebird habitat quality in the Liaohe River estuary from 1980 to 2023
Received date: 2024-04-07
Revised date: 2024-06-06
Online published: 2026-03-12
Copyright
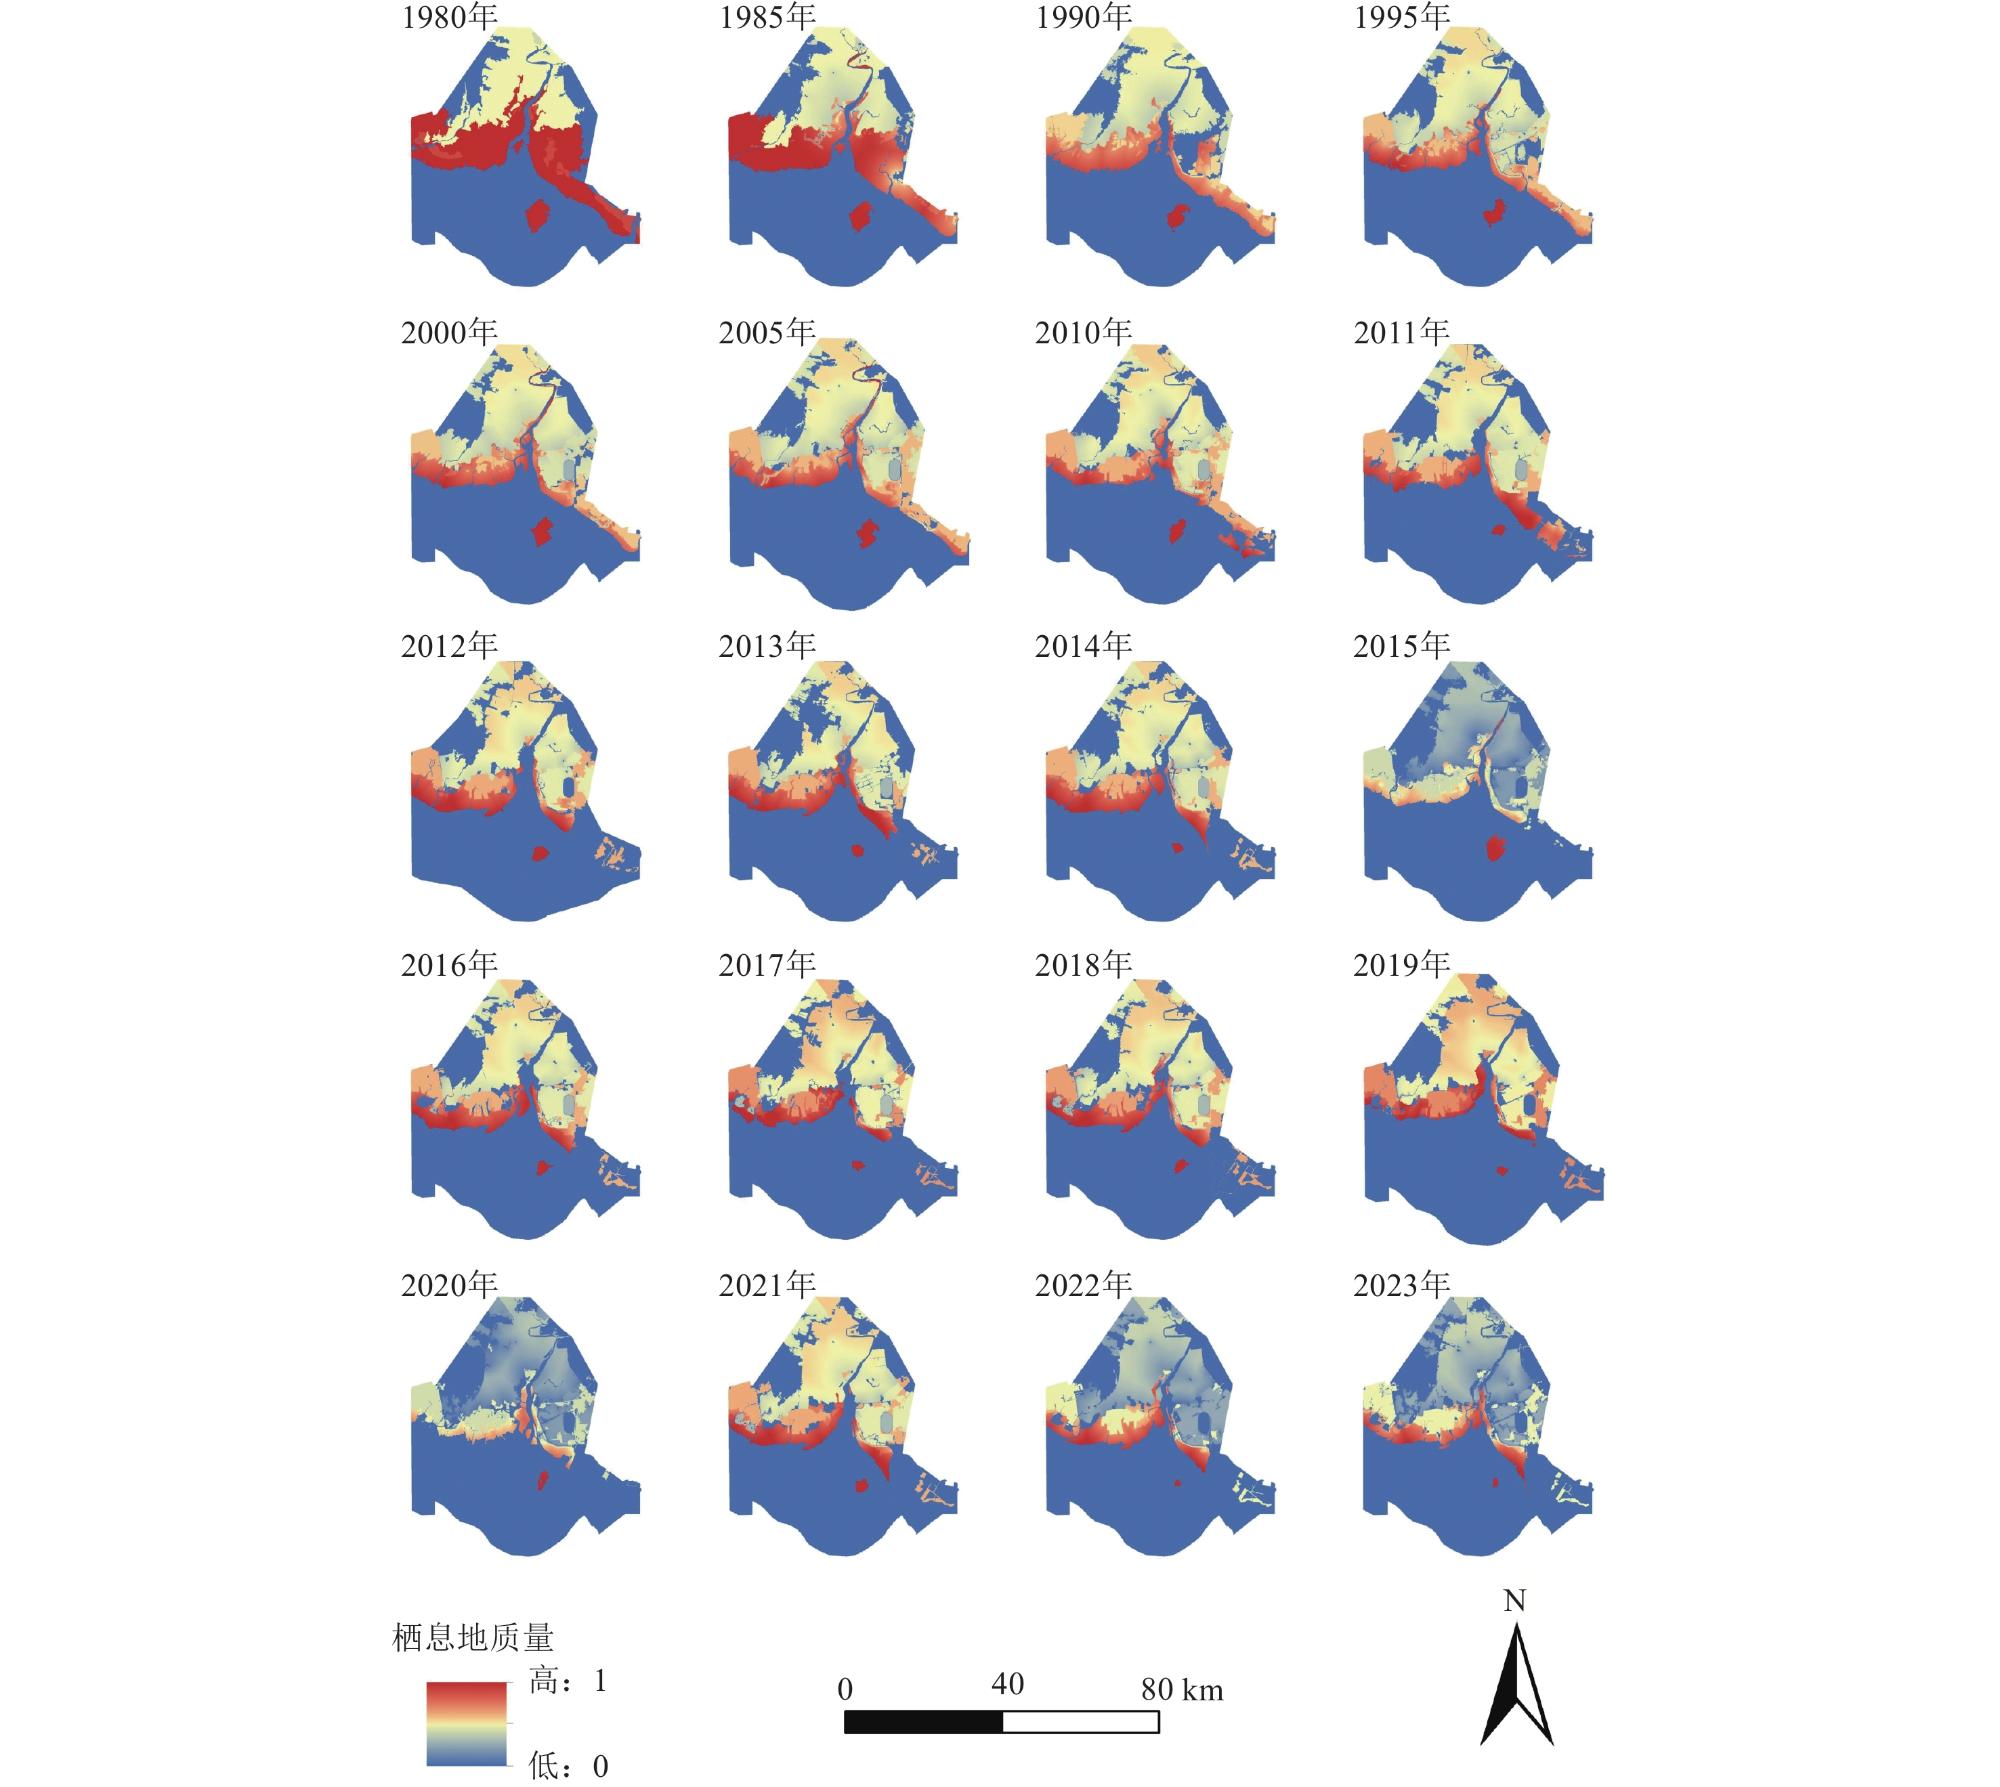
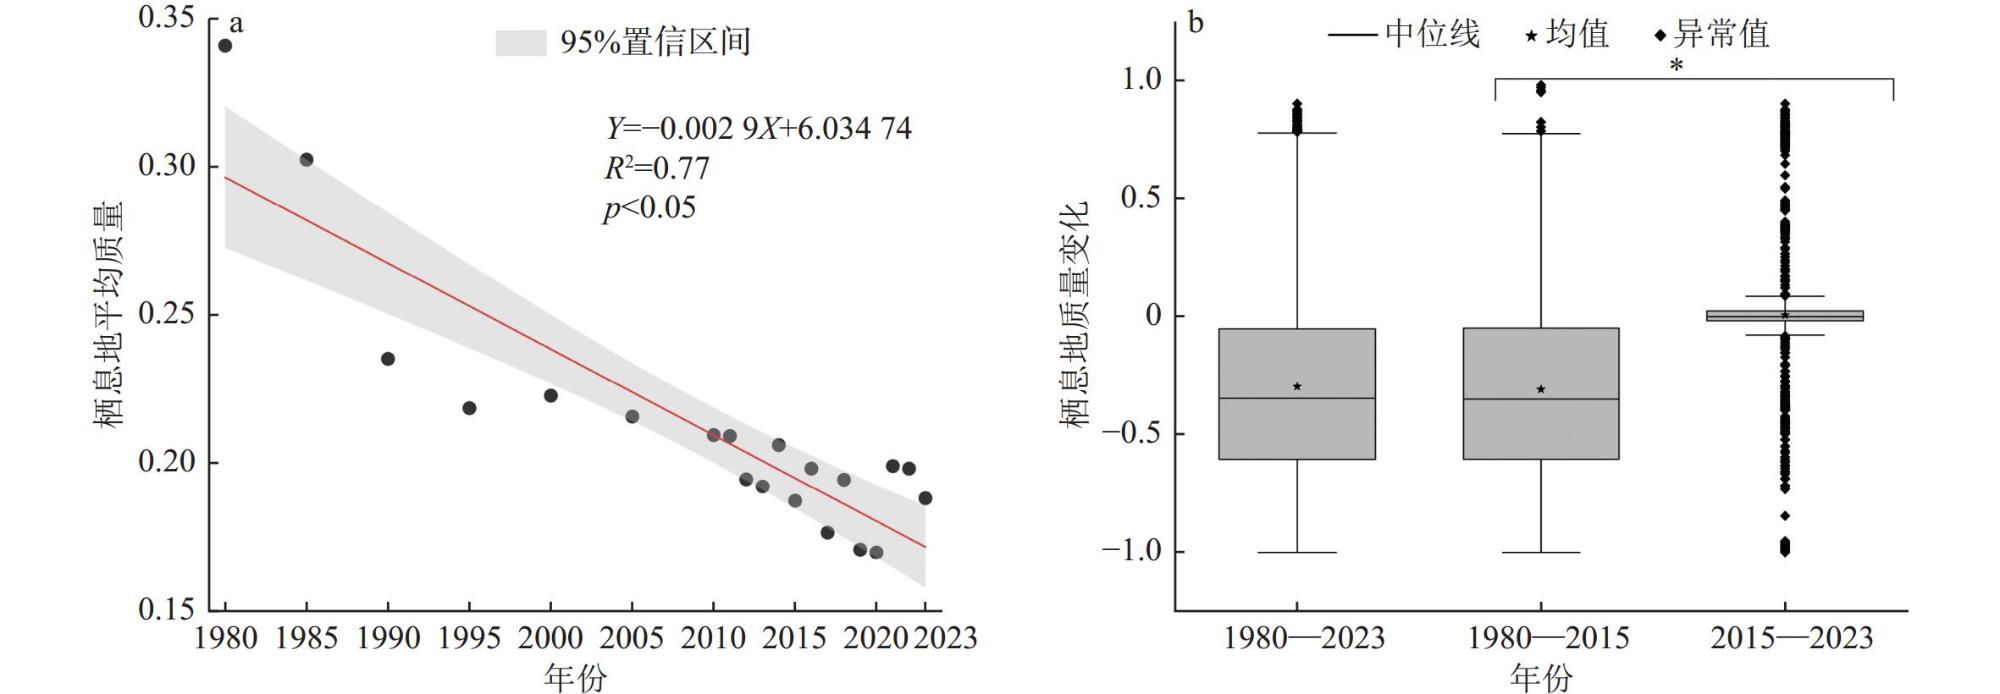
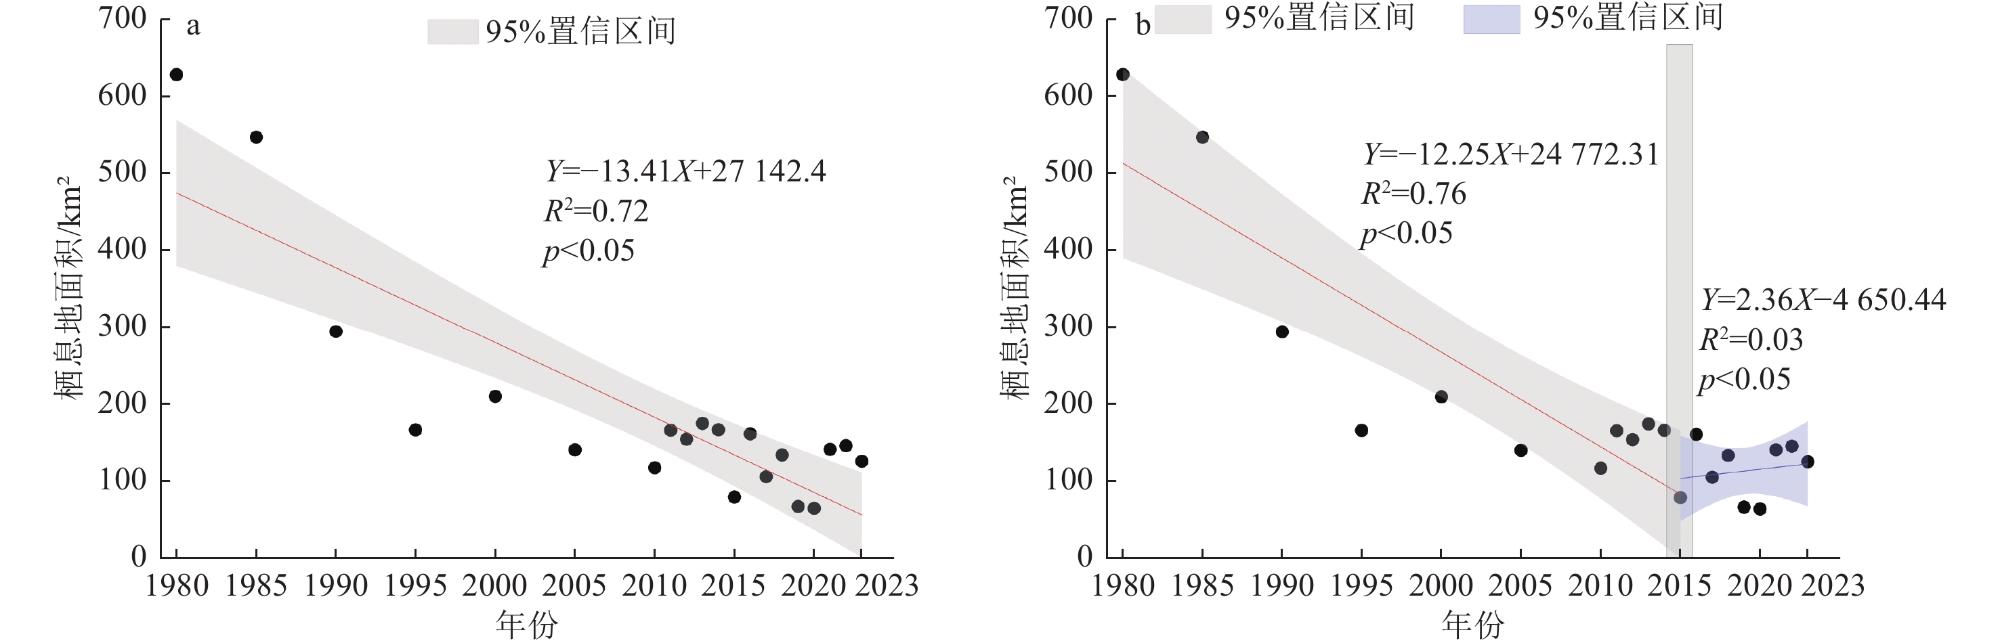
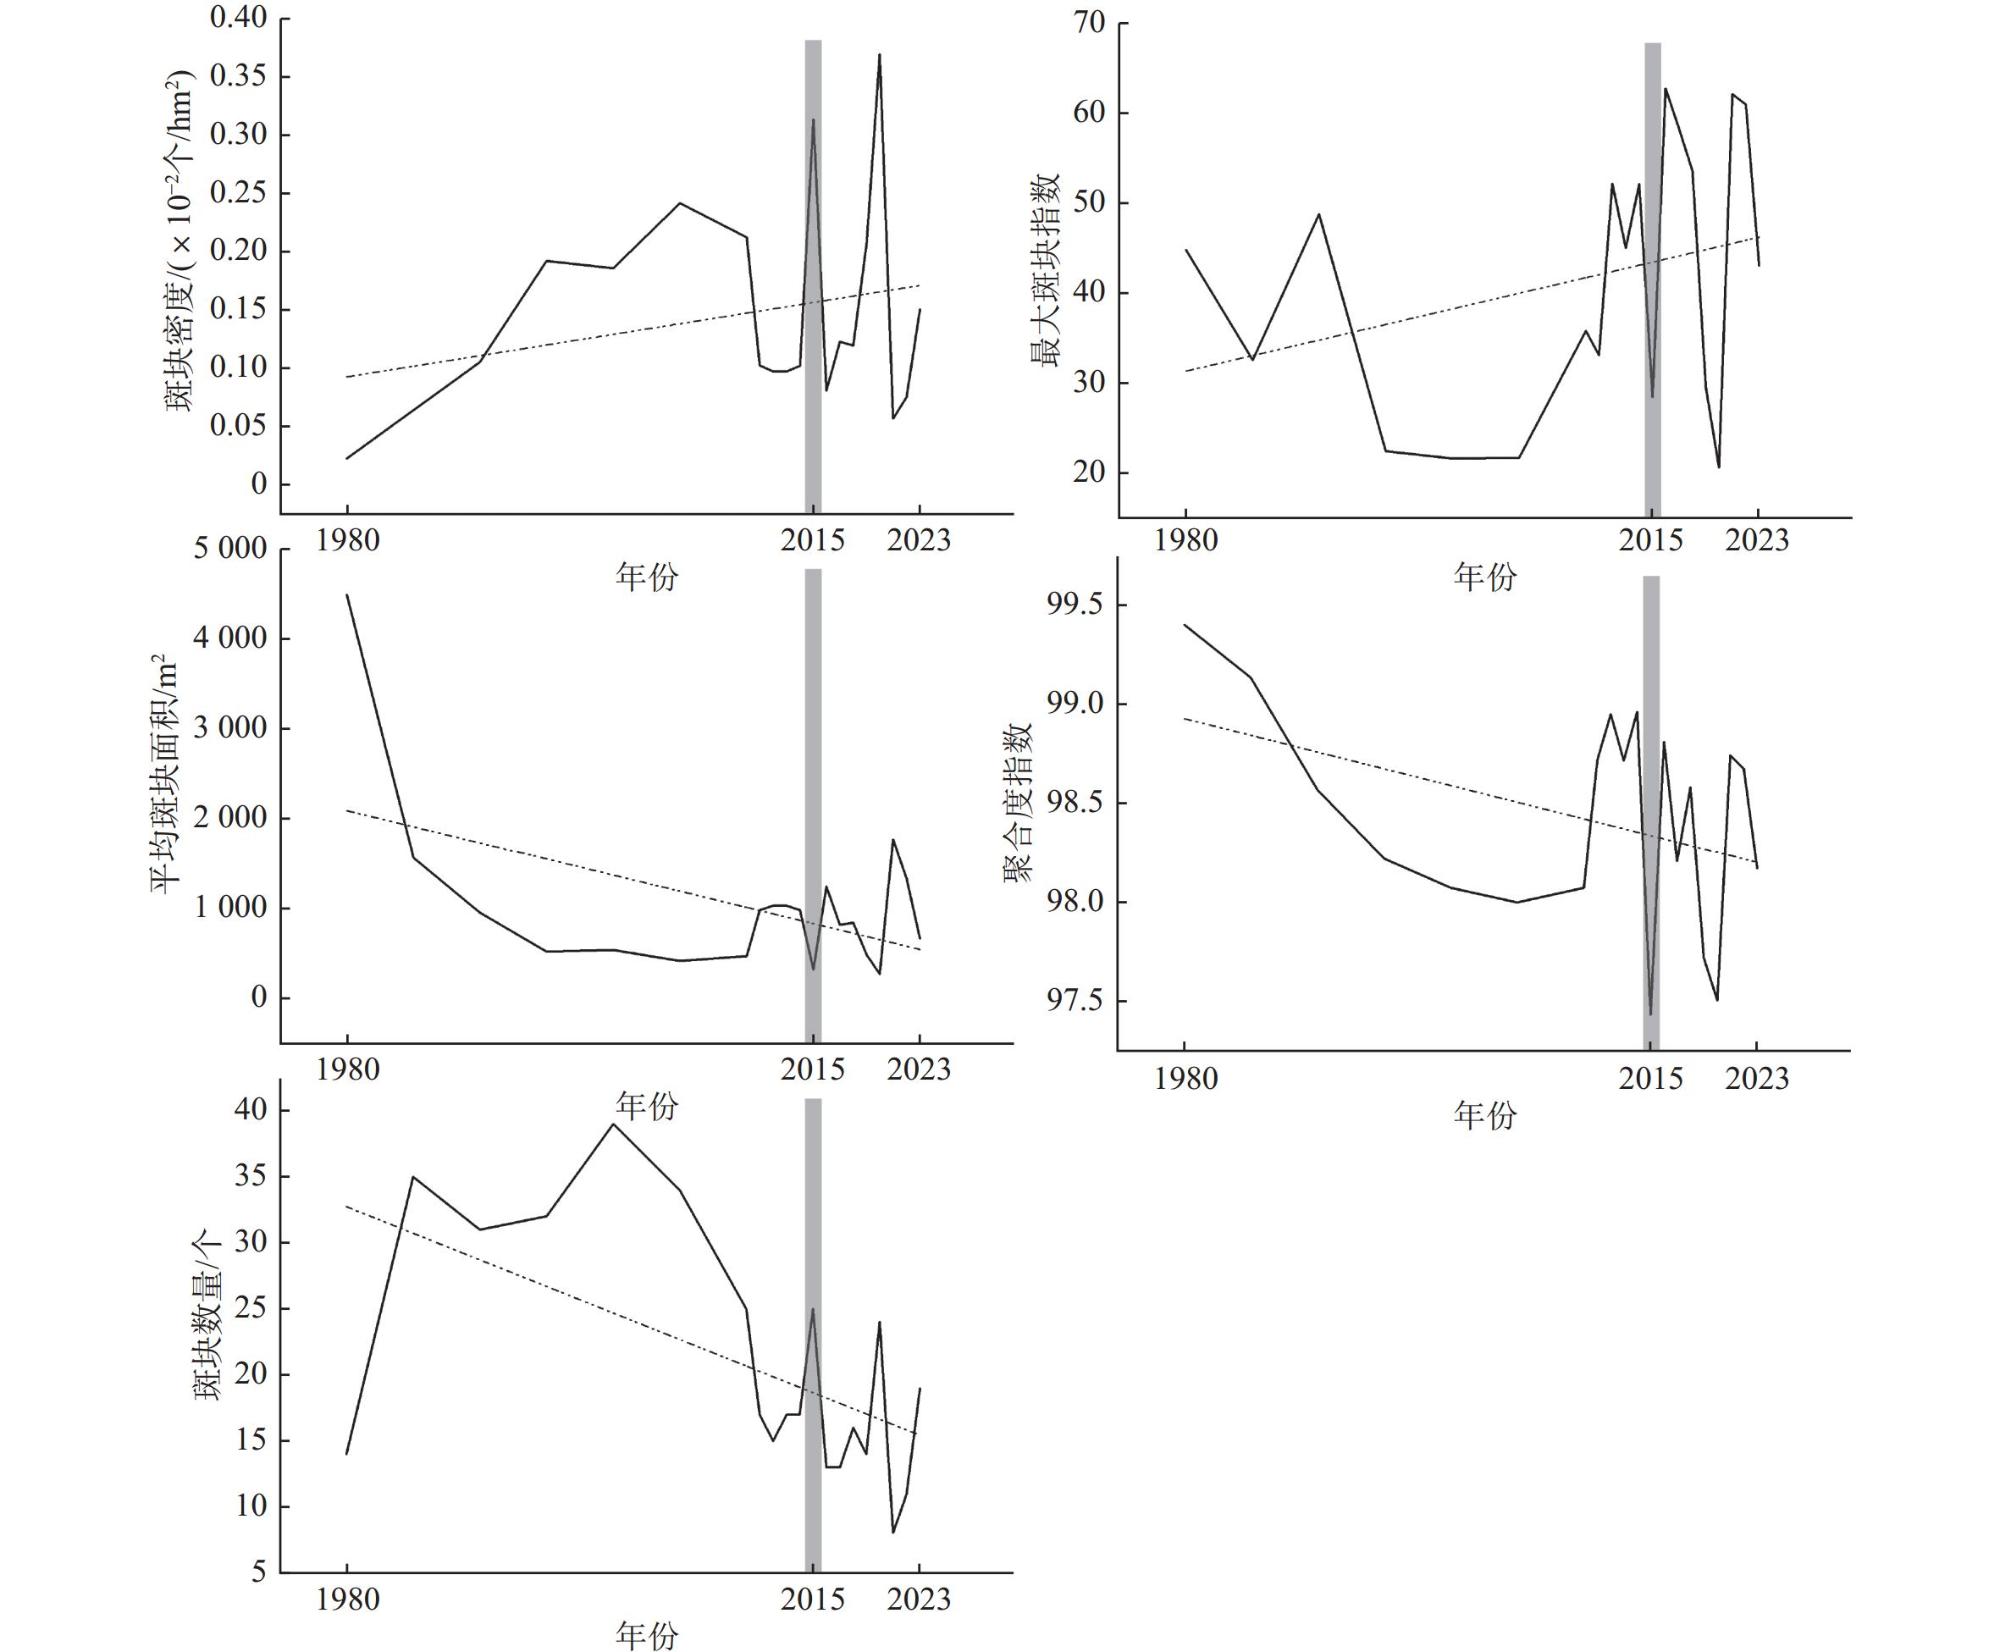
Coastal wetlands in the Liaohe River estuary provide important stopover sites for shorebirds along the East Asian-Australasian Flyway routine. Land reclamation has disturbed natural wetlands along coastal region in the Liaohe River estuary in the last few decades and how it impacts on the quality and area of shorebird habitat was not clear. We used the habitat quality module of InVEST model and landscape pattern indices to analyze the spatial-temporal changes in habitat quality and area based on the remote images during last 40 years along the coastal wetland in the Liaohe River estuary. The quality and area of shorebird habitat declined obviously, the mean patch area and the aggregation index of shorebird habitat declined, and the patch density of shorebird habitat increased from 1980 to 2023. The spatial regions of habitat change mainly distributed in coastal wetlands. Comparing the difference between before and after of the impact of returning aquaculture to natural wetlands on shorebird habitat, the habitat quality, habitat area, mean patch area and aggregation index of shorebird habitat significantly decreased, and the patch density increased from 1980 to 2015. In contrast, these indices had inverse change characteristics from 2015 to 2023. It is important to prohibit wetland reclamation and continuously conduct conservation and restoration actions.
Dong Haozheng , Duan Houlang , Yu Hailing , Xu Ce , Gao Yin , Zhang Guangshuai , Wang Shutao . Spatial-temporal changes of shorebird habitat quality in the Liaohe River estuary from 1980 to 2023[J]. Wetland Science, 2025 , 23(1) : 1 -10 . DOI: 10.13248/j.cnki.wetlandsci.20240100
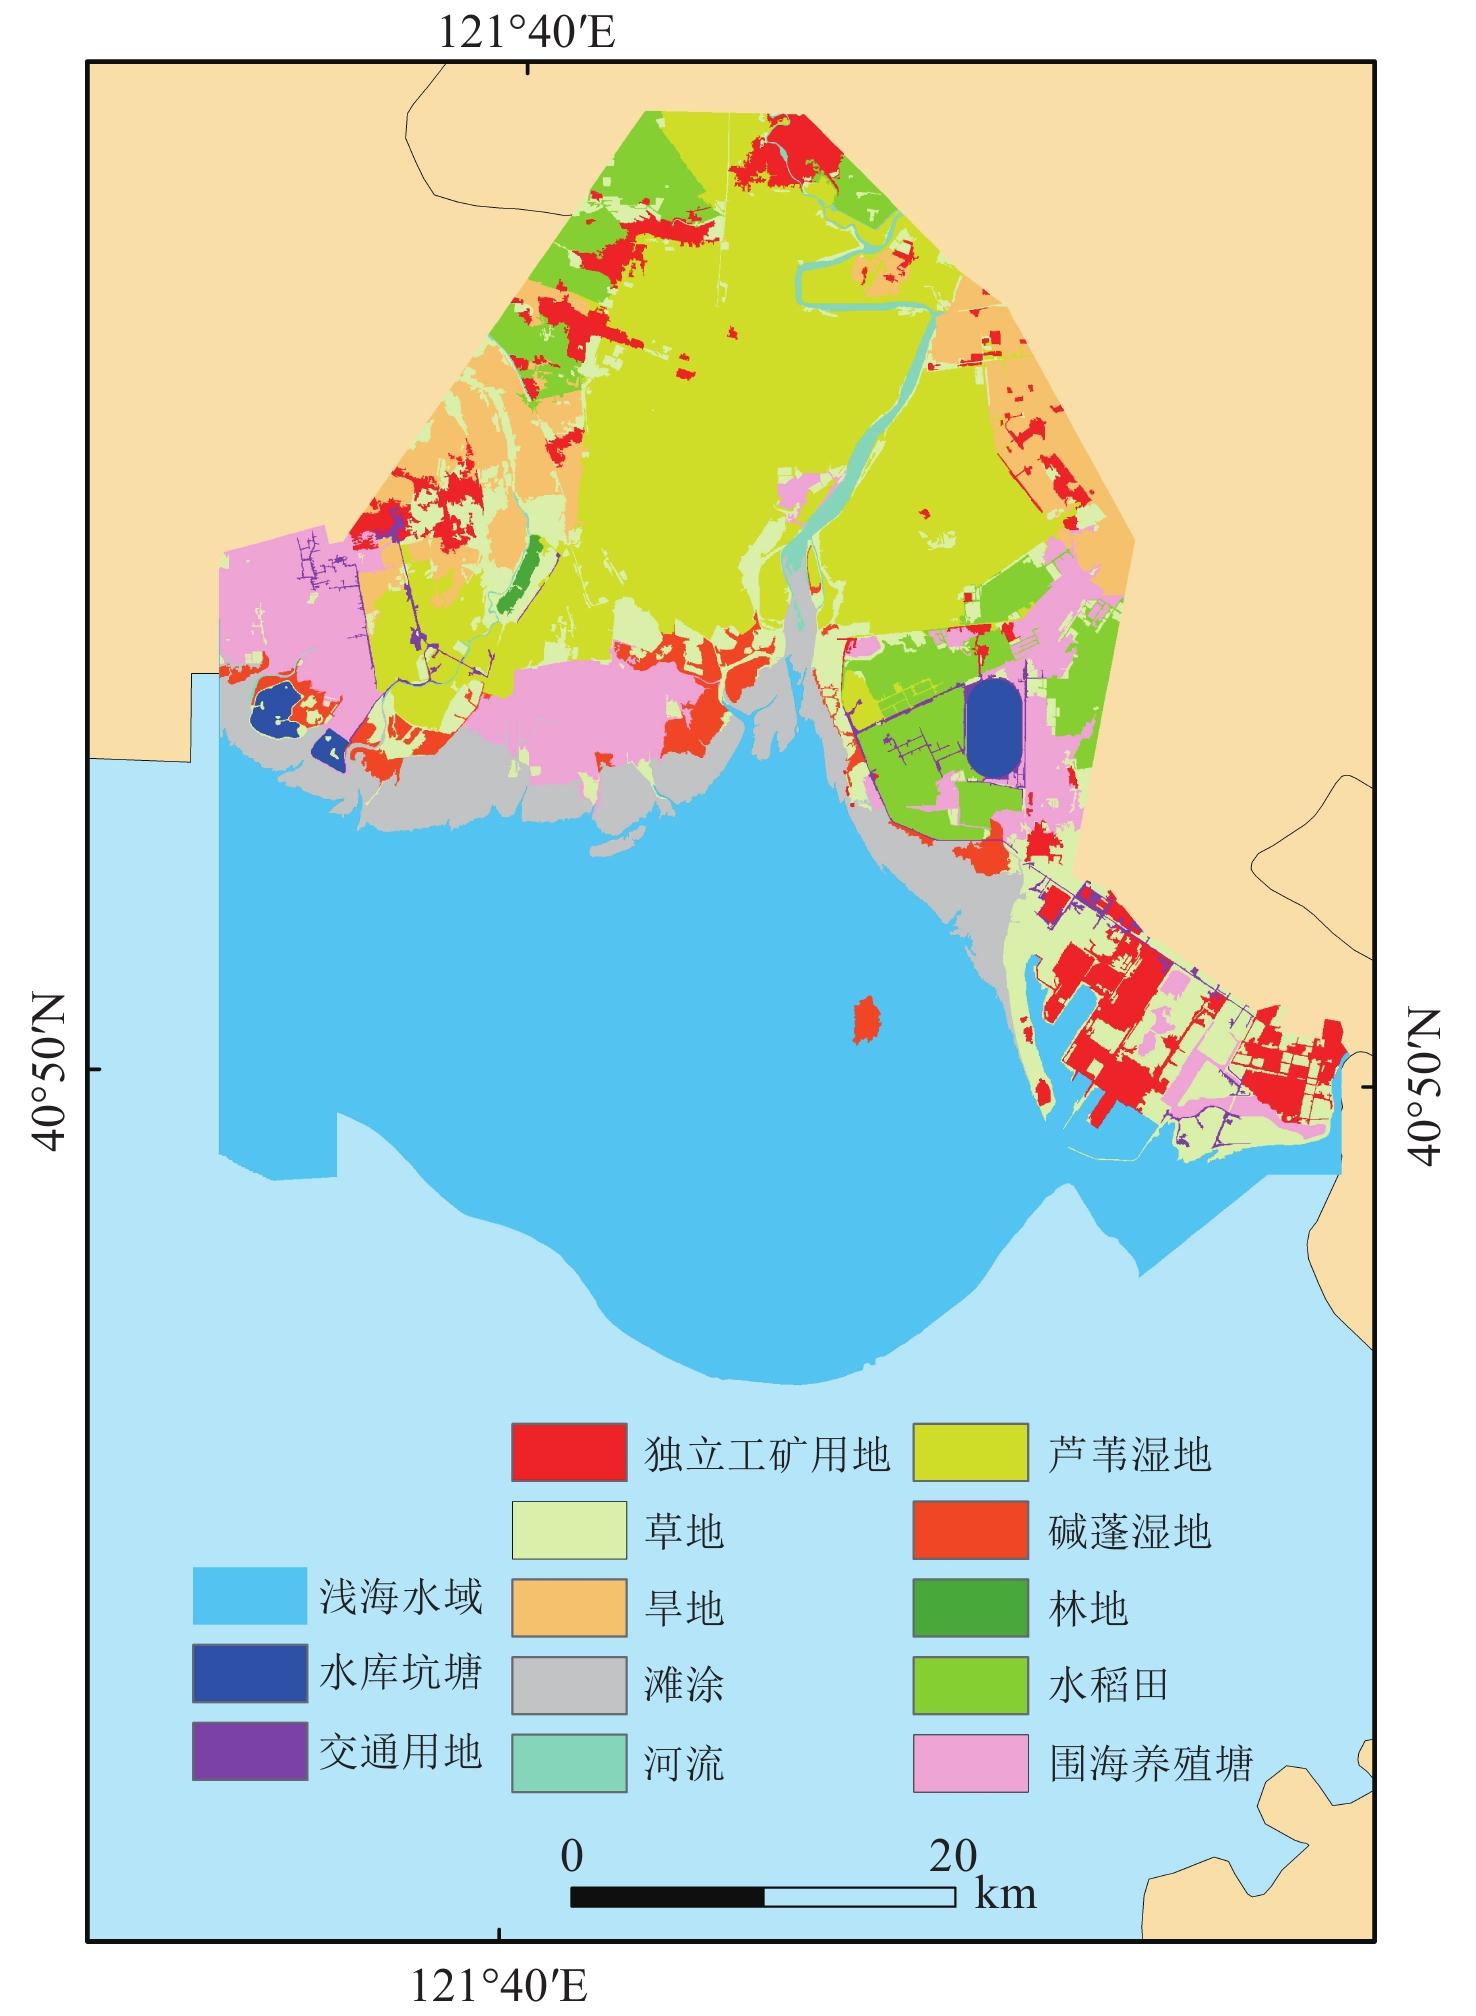
1 Threat sources, maximum threat distance, threat weight and attenuation type for shorebird habitat in the Liaohe River Estuary辽河口鸻鹬类水鸟栖息地威胁源、最大威胁距离、威胁权重和衰减类型 |
| 威胁源 | 最大威胁距离/km | 威胁权重 | 衰减类型 |
| 独立工矿用地 | 5.60 | 0.80 | 指数 |
| 围海养殖塘 | 14.00 | 0.92 | 线性 |
| 交通用地 | 0.50 | 0.71 | 指数 |
2 Suitability of different types of shorebird habitat and their sensitivity to threat factors in the Liaohe River Estuary辽河口鸻鹬类水鸟不同类型栖息地的适宜性及其对威胁源的敏感性 |
| 栖息地类型 | 栖息地适宜性 | 对威胁源的敏感性 | ||
| 独立工矿用地 | 围海养殖塘 | 交通用地 | ||
| 滩涂 | 1.00 | 0.35 | 0.95 | 1.00 |
| 芦苇湿地 | 0.50 | 0.35 | 0.95 | 1.00 |
| 碱蓬湿地 | 0.90 | 0.35 | 0.95 | 1.00 |
| 水稻田 | 0.40 | 0.60 | 0.10 | 0.80 |
| 围海养殖塘 | 0.55 | 0.01 | 0.01 | 0.50 |
| 水库坑塘 | 0.25 | 0.01 | 0.01 | 0.50 |
3 Calculation formulas of landscape pattern indices and thire meanings景观格局指数计算公式及其含义 |
| 指数名称 | 计算公式 | 公式意义 |
| 斑块数量(NP) | N为栖息地斑块数量;NP反映了栖息地的破碎度,其值越高则破碎度越高 | |
| 斑块密度(PD) | TA为栖息地总面积。栖息地斑块密度反映了景观整体的异质性与破碎度, 其值越高则破碎度越高 | |
| 最大斑块指数(LPI) | 间接反映了人类活动干扰的方向和大小 | |
| 平均斑块面积(MPA) | 生态属性 | |
| 聚合度指数(AI) | AI反映了斑块的聚集程度,其值越大,景观斑块越聚集 |
3 Temporal changes of average shorebird habitat quality in the Liaohe River estuarine wetland from 1980 to 2023 (a) and differences between two stages before and after returning aquaculture to natural wetland (1980-2015 and 2015-2023) (b)1980—2023年辽河口湿地鸻鹬类水鸟栖息地平均质量时间变化特征(a)以及退养还湿前后两个阶段(1980—2015年与2015—2023年)的差异性对比(b) p<0.05)。]]> |
4 Temporal changes of suitable shorebird habitat area in the Liaohe River estuarine wetland from 1980 to 2023 (a) and differences between two stages before and after returning aquaculture to natural wetland (1980-2015 and 2015-2023) (b)1980—2023年辽河口湿地鸻鹬类水鸟栖息地适宜区面积的时间变化特征(a)以及退养还湿前后两个阶段(1980—2015年与2015—2023年)的差异性对比(b) |
| 1 |
| 2 |
| 3 |
| 4 |
| 5 |
| 6 |
| 7 |
| 8 |
| 9 |
| 10 |
| 11 |
| 12 |
| 13 |
| 14 |
| 15 |
| 16 |
| 17 |
| 18 |
| 19 |
| 20 |
| 21 |
| 22 |
| 23 |
| 24 |
| 25 |
| 26 |
| 27 |
| 28 |
| 29 |
| 30 |
| 31 |
| 32 |
| 33 |
| 34 |
| 35 |
| 36 |
| 37 |
| 38 |
| 39 |
| 40 |
| 41 |
| 42 |
| 43 |
| 44 |
| 45 |
| 46 |
/
| 〈 |
|
〉 |