
The impact of saline soil amelioration on recovery of Suaeda glauca and soil physicochemical properties in degraded coastal wetlands
Received date: 2024-03-01
Revised date: 2024-04-02
Online published: 2026-03-12
Copyright
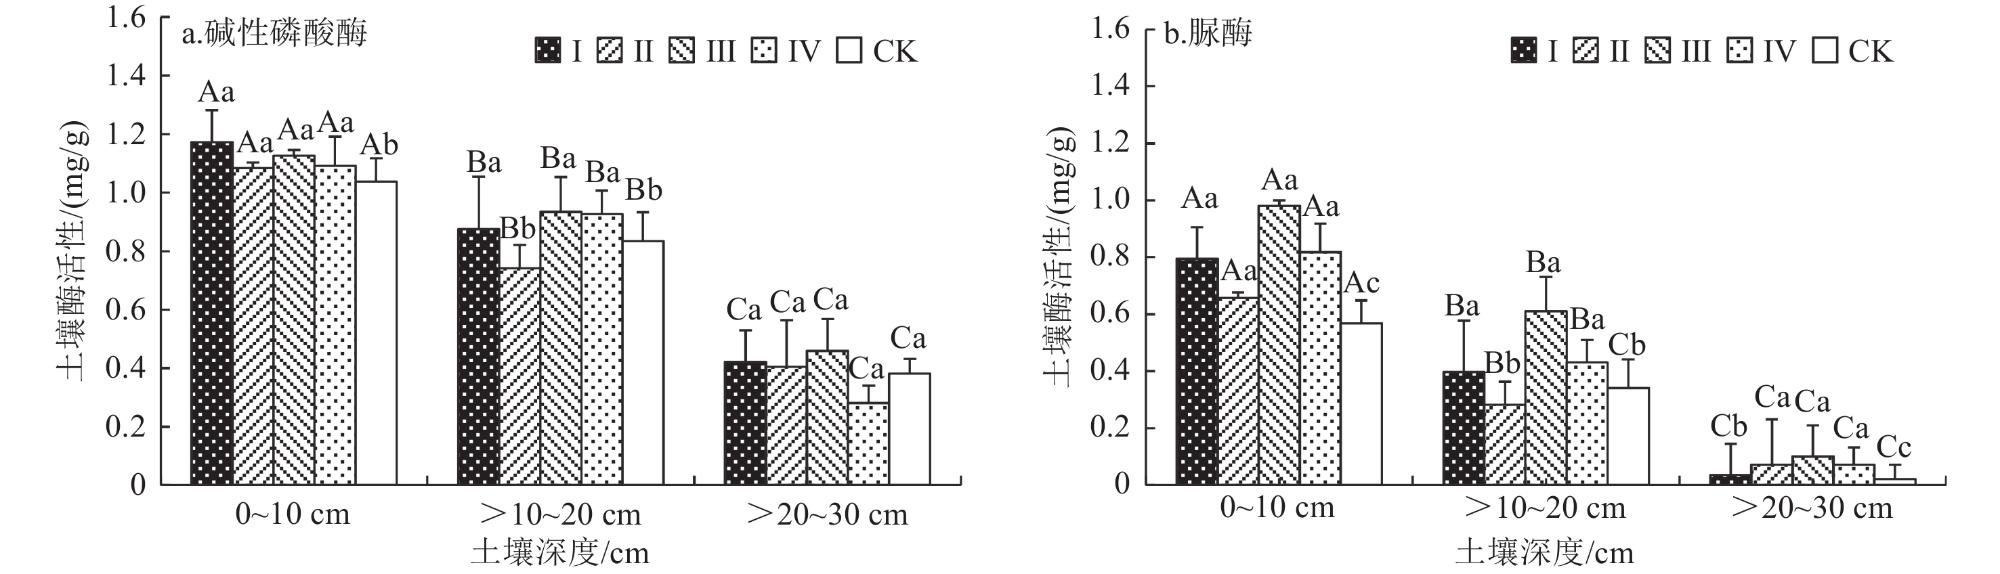
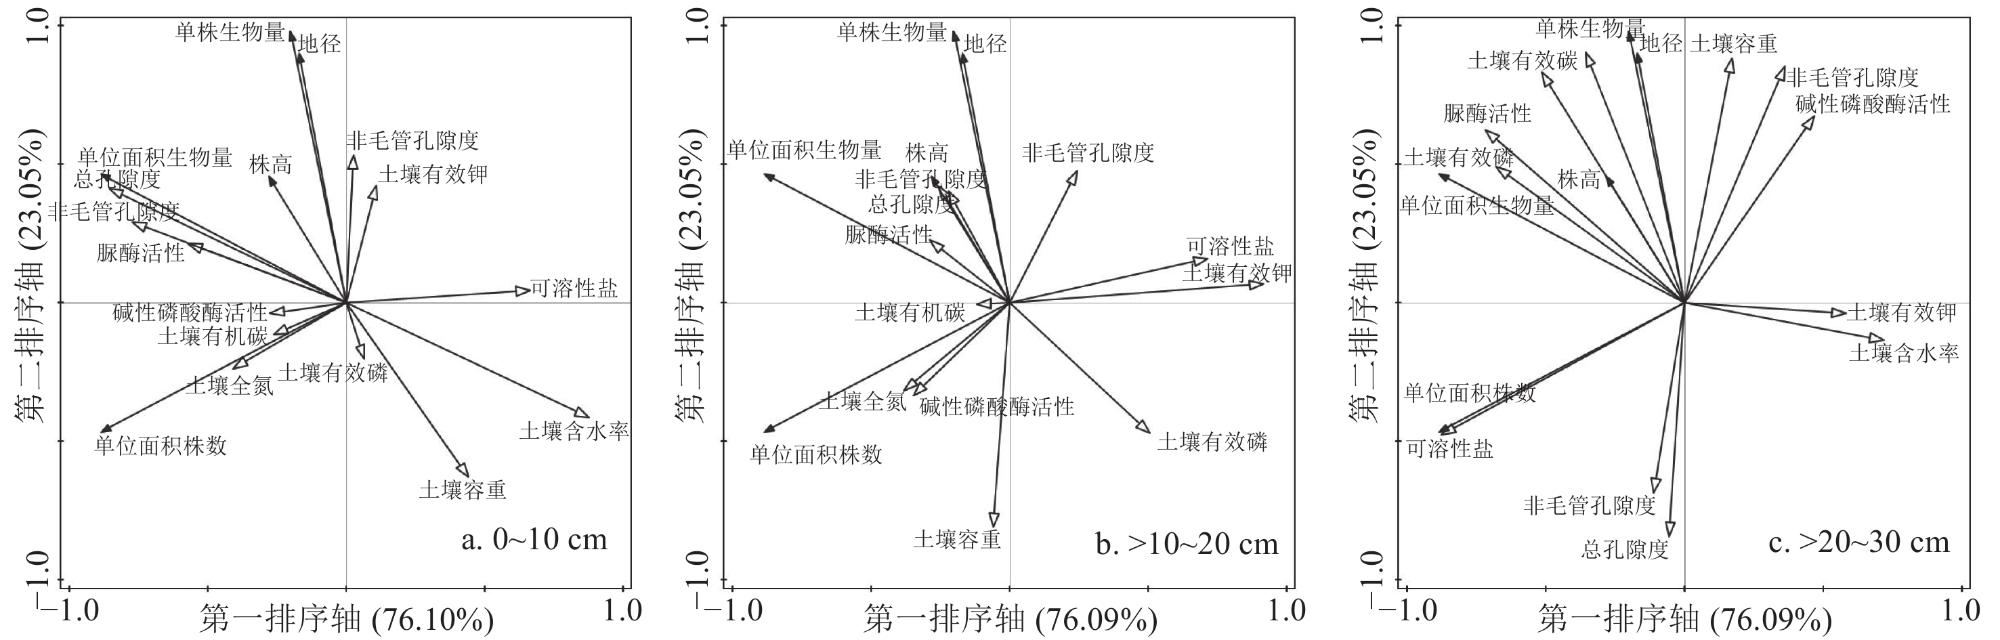
In order to investigate the effects of aligned soil improvement on the recovery of Suaeda glauca and the enhancement of soil quality, four treatments were set up in Yancheng, Jiangsu. Including (Ⅰ) ploughing+fertilization-ploughing 25 cm and fertilizing, application rate was 0.125 kg/m2, (Ⅱ) ploughing-only ploughing 25 cm, (Ⅲ) ploughing+covering-ploughing 25 cm and covering straw, the amount of the straw was 0.5 kg/m2, and (Ⅳ) ploughing+sawdust-ploughing 25 cm and improving with sawdust, the amount of the sawdust was 1 kg/m2. The study investigated the effects of various treatments on the growth index of Suaeda glauca, as well as the physicochemical properties and soil enzyme activities. Additionally, a comparison was made regarding how these treatments influenced the regulation of wetland soil structure, enhancement of soil fertility, and reduction of salinity. The results showed that the treatments had a significant promoting effect on the recovery of Suaeda glauca. There was no significant difference in the single plant growth index of Suaeda glauca among the four different treatments, but the number of plants per unit area and the biomass per unit area were significantly higher than that under the control (n=3, p<0.05). The treatments significantly enhanced soil looseness and reduced bulk density(BD) at a depth of 0-10 cm. In comparison to the control group, the total porosity (TP) of the soil increased by 5.77%, 8.32%, 11.62%, and 9.88%, respectively; but had little effect on the soil physical properties at the depth of 10-30 cm. Under improvement treatments, the content of soil organic carbon (SOC), total nitrogen (TN) and effective phosphorus(AP) of soil at the depth of 0-10 cm layer increased, with ploughing+fertilization treatment (I) demonstrating the most significant fertilizer effect. The organic carbon, total nitrogen and available phosphorus content increased by 21.90%, 23.15% and 60.29% compared to the control group, while soil salinity was significantly reduced. However, the effective potassium content in the soil at all depths did not change significantly. Four improved treatments significantly increased soil urease (SUE) and alkaline phosphatase (ALP) activities at a depth of 0-10 cm. Specifically, SUE activity was found to be 1.40 times, 1.05 times, 1.72 times and 1.43 times that of the control group, and ALP activity was recorded as being 1.13 times, 1.04 times, 1.09 times and 1.06 times that of the control group. Similar trends were observed in the soil at 10-20 cm depth, but the two enzyme activities at 20-30 cm depth did not show significant differences. Correlation analysis revealed that ALP activity had a significant positive correlation with TP, SOC, TN, and AP (n=3, p<0.05), and significantly negatively correlated with potassium content (n=3, p<0.05). SUE activity was significantly positively correlated with TP, SOC and TN (n=3, p<0.05). Both enzyme activities showed a significant negative correlation with soluble salt content (n=3, p<0.05). Among the four improved methods tested, ploughing+covering treatment (III) significantly enhanced both pore conditions and enzyme activity within saline soils ,with this improvement effect being particularly pronounced.
Li Donglin , Zhang Jiaojiao , Xing Wei , He Dongmei . The impact of saline soil amelioration on recovery of Suaeda glauca and soil physicochemical properties in degraded coastal wetlands[J]. Wetland Science, 2025 , 23(2) : 298 -308 . DOI: 10.13248/j.cnki.wetlandsci.20240057
1 Variation of growth and biomass of Suaed glauca under different improvement treatments不同改良处理下碱蓬生长及生物量指标的变化 |
| 处理 | 株高/cm | 地径/cm | 单株生物量/g | 单位面积株数/(株/m2) | 单位面积生物量/(g/m2) |
| 注:表中数据为(平均值±标准误);同列数据右上角小写字母完全不同, 表示数据间差异显著(n=3, p<0.05)。 | |||||
| 深翻+施肥(处理Ⅰ) | (1.79±0.10)a | (0.94±0.04)a | (0.05±0.01)a | (69.67±6.22)b | (3.48±0.31)b |
| 深翻(处理Ⅱ) | (1.96±0.07)a | (1.09±0.02)a | (0.08±0.02)a | (64.33±7.11)b | (5.15±0.57)a |
| 深翻+覆草(处理Ⅲ) | (1.98±0.08)a | (1.21±0.09)a | (0.08±0.02)a | (64.00±7.33)b | (5.12±0.75)a |
| 深翻+碎屑(处理Ⅳ) | (1.97±0.07)a | (0.99±0.04)a | (0.05±0.01)a | (103.00±8.00)a | (5.15±0.40)a |
| 对照 | (1.95±0.20)a | (1.00±0.15)a | (0.05±0.01)a | (53.33±7.56)c | (2.67±0.38)c |
2 Variation of main soil physical indexes under different improvement treatments不同改良处理下主要土壤物理指标的变化 |
| 处理 | 土壤深度/cm | 土壤含水率/% | 土壤容重/(g/cm3) | 毛管孔隙度/% | 非毛管孔隙度/% | 总孔隙度/% |
| 注:表中数据为(平均值±标准误)。同列数据右上角小写字母不同表示不同处理间差异显著(n=3,p<0.05);大写字母不同表示不同深度土壤间差异显著(n=3,p<0.05)。 | ||||||
| 深翻+施肥(处理Ⅰ) | 0~10 | (1.97±0.36)Aa | (1.26±0.03)Cb | (44.03±3.82)Aa | (1.59±0.27)Ba | (45.62±4.09)Aa |
| >10~20 | (1.77±0.10)Aa | (1.51±0.05)Ba | (41.20±0.73)Ba | (1.64±0.12)Ba | (42.84±0.61)Ba | |
| >20~30 | (1.49±0.20)Aa | (1.52±0.05)Aa | (40.80±0.80)Ca | (1.69±0.22)Aa | (42.49±0.98)Ba | |
| 深翻(处理Ⅱ) | 0~10 | (1.70±0.19)Aa | (1.25±0.06)Cb | (43.80±1.33)Aa | (1.55±0.30)Ba | (46.72±1.28)Aa |
| >10~20 | (1.96±0.31)Aa | (1.48±0.10)Ba | (40.03±1.16)Ba | (1.55±0.34)Ba | (41.82±1.49)Ba | |
| >20~30 | (1.68±0.03)Aa | (1.56±0.01)Aa | (40.47±0.71)Ba | (1.84±0.22)Aa | (41.84±0.89)Ba | |
| 深翻+覆草(处理Ⅲ) | 0~10 | (1.64±0.15)Aa | (1.23±0.06)Cb | (47.07±0.58)Aa | (2.01±0.15)Aa | (48.14±1.05)Aa |
| >10~20 | (2.44±0.95)Aa | (1.49±0.05)Ba | (42.20±1.16)Ba | (2.09±0.25)Aa | (43.29±1.37)Ba | |
| >20~30 | (1.42±0.24)Aa | (1.56±0.01)Aa | (38.57±0.04)Ca | (2.10±0.19)Aa | 41.27±0.69)Ba | |
| 深翻+碎屑(处理Ⅳ) | 0~10 | (1.71±0.41)Aa | (1.30±0.04)Bb | (45.80±1.80)Aa | (1.59±0.08)Ba | (47.39±1.75)Aa |
| >10~20 | (1.67±0.04)Aa | (1.58±0.05)Aa | (39.90±0.60)Ba | (1.57±0.25)Ba | (41.47±0.70)Ba | |
| >20~30 | (1.52±0.35)Aa | (1.45±0.05)Aa | (40.77±1.69)Ba | (1.48±0.12)Aa | (42.25±1.81)Ba | |
| 对照 | 0~10 | (2.35±0.25)Aa | (1.35±0.03)Ba | (41.47±0.62)Ab | (1.66±0.23)Ba | (43.13±0.47)Ab |
| >10~20 | (2.48±0.42)Aa | (1.56±0.02)Aa | (39.07±0.96)Aa | (1.78±0.11)Aa | (40.85±1.00)Bb | |
| >20~30 | (2.03±0.22)Aa | (1.49±0.05)Aa | (40.10±1.07)Aa | (1.81±0.04)Aa | (41.91±1.11)Ba | |
3 Variation of soil nutrient parameters under different improvement treatments不同改良处理下土壤养分指标的变化 |
| 处理 | 土壤深度/ (cm) | 有机碳质量比/ (g/kg) | 全氮质量比/ (g/kg) | 有效磷质量比/ (mg/kg) | 有效钾质量比/ (mg/kg) | 可溶性盐质量比/ (mg/kg) |
| 注:表中数据为(平均值±标准误)。同列数据右上角小写字母不同表示不同处理间差异显著(n=3,p<0.05);大写字母不同表示不同深度土壤间差异显著(n=3,p<0.05)。 | ||||||
| 深翻+施肥(处理Ⅰ) | 0~10 | (7.38±1.09)Aa | (1.33±0.14)Aa | (27.01±9.84)Aa | (207.42±34.75)Aa | (1.45±0.39)Bc |
| >10~20 | (6.15±1.19)Ba | (1.15±0.14)Aa | (10.57±1.91)Ba | (201.57±15.78)Aa | (2.14±0.34)Ab | |
| >20~30 | (1.66±0.32)Ca | (0.64±0.02)Ba | (2.01±1.41)Cb | (202.15±13.08)Aa | (1.85±0.48)Ba | |
| 深翻(处理Ⅱ) | 0~10 | (6.23±0.40)Ab | (1.11±0.08)Aa | (17.72±3.15)Ab | (233.15±23.15)Aa | (2.44±0.68)Bb |
| >10~20 | (4.12±1.40)Ba | (0.97±0.18)Aa | (6.68±1.02)Ba | (206.45±9.50)Aa | (2.98±0.60)Ab | |
| >20~30 | (2.17±0.28)Ca | (0.80±0.11)Ba | (2.24±0.78)Cb | (217.64±11.71)Aa | (1.74±0.93)Ca | |
| 深翻+覆草(处理Ⅲ) | 0~10 | (7.04±0.63)Ab | (1.27±0.06)Aa | (20.71±3.21)Ab | (220.89±14.81)Aa | (1.53±0.54)Ac |
| >10~20 | (6.88±1.79)Aa | (1.16±0.20)Aa | (10.57±1.71)Ba | (194.45±9.50)Aa | (1.70±0.53)Ac | |
| >20~30 | (2.28±0.95)Ba | (0.82±0.12)Ba | (3.76±1.37)Ca | (196.35±14.42)Aa | (1.77±0.24)Ba | |
| 深翻+碎屑(处理Ⅳ) | 0~10 | (6.62±0.94)Ab | (1.24±0.11)Aa | (17.86±5.93)Ab | (222.44±21.92)Aa | (1.67±0.64)Bc |
| >10~20 | (5.41±0.23)Ba | (1.14±0.07)Aa | (9.73±1.77)Ba | (187.63±11.71)Aa | (1.62±0.55)Bc | |
| >20~30 | (1.95±0.14)Ca | (0.71±0.02)Ba | (2.65±1.32)Cb | (204.14±12.73)Aa | (2.34±0.81)Aa | |
| 对照 | 0~10 | (6.03±0.34)Ac | (1.08±0.01)Ab | (16.85±1.19)Ac | (230.60±11.15)Aa | (3.28±0.47)Aa |
| >10~20 | (4.89±0.11)Ba | (1.02±0.08)Aa | (11.96±1.09)Ba | (219.93±12.53)Aa | (3.17±0.27)Aa | |
| >20~30 | (1.71±0.26)Ca | (0.68±0.05)Ba | (0.98±0.16)Cb | (224.94±4.22)Aa | (1.55±0.83)Ba | |
4 Correlation coefficient between growth indexes of Suaed glauca and soil physicochemical indexes碱蓬生长指标与土壤理化指标的相关系数 |
| 单位 面积 株数 | 单位 面积 生物量 | 土壤 含水率 | 土壤 容重 | 土壤 毛管 孔隙度 | 土壤 非毛管 孔隙度 | 土壤 总孔隙度 | 土壤 有机碳 含量 | 土壤 全氮 含量 | 土壤 有效磷 含量 | 土壤 有效钾 含量 | 土壤 可溶性盐 含量 | 土壤碱性 磷酸酶 活性 | 土壤 脲酶 活性 | |
| 注:表中*表示在0.05 水平(双侧)上显著相关, **表示在0.01水平(双侧)上显著相关。n=3。 | ||||||||||||||
| 单位面积株数 | 1.000 | |||||||||||||
| 单位面积生物量 | 0.518 | 1.000 | ||||||||||||
| 土壤含水率 | −0.529 | −0.955* | 1.000 | |||||||||||
| 土壤容重 | −0.006 | −0.661 | 0.790 | 1.000 | ||||||||||
| 土壤毛管孔隙度 | 0.511 | 0.799 | −0.912* | −0.701 | 1.000 | |||||||||
| 土壤非毛管孔隙度 | −0.270 | 0.216 | −0.311 | −0.389 | 0.575 | 1.000 | ||||||||
| 土壤总孔隙度 | 0.515 | 0.937* | −0.995** | −0.786 | 0.947* | 0.393 | 1.000 | |||||||
| 土壤有机碳含量 | 0.216 | 0.134 | −0.420 | −0.615 | 0.588 | 0.315 | 0.455 | 1.000 | ||||||
| 土壤全氮含量 | 0.413 | 0.207 | −0.479 | −0.537 | 0.658 | 0.271 | 0.515 | 0.976** | 1.000 | |||||
| 土壤有效磷含量 | −0.038 | −0.195 | −0.085 | −0.467 | 0.194 | 0.049 | 0.100 | 0.900* | 0.819 | 1.000 | ||||
| 土壤有效钾含量 | −0.241 | 0.145 | 0.144 | 0.328 | −0.337 | −0.094 | −0.175 | −0.938* | −0.930* | −0.931* | 1.000 | |||
| 土壤可溶性盐含量 | −0.543 | −0.530 | 0.750 | 0.706 | −0.833 | −0.269 | −0.770 | −0.893* | −0.938* | −0.656 | 0.760 | 1.000 | ||
| 土壤碱性磷酸酶活性 | 0.152 | 0.170 | −0.445 | −0.705 | 0.537 | 0.221 | 0.463 | 0.979** | 0.929* | 0.928* | −0.899* | −0.874* | 1.000 | |
| 土壤脲酶活性 | 0.365 | 0.574 | −0.764 | −0.693 | 0.946* | 0.675 | 0.818* | 0.774* | 0.810* | 0.432 | −0.561 | −0.883* | 0.706 | 1.000 |
| 1 |
| 2 |
| 3 |
| 4 |
| 5 |
| 6 |
| 7 |
| 8 |
| 9 |
| 10 |
| 11 |
| 12 |
| 13 |
| 14 |
| 15 |
| 16 |
| 17 |
| 18 |
| 19 |
| 20 |
| 21 |
| 22 |
| 23 |
| 24 |
| 25 |
| 26 |
| 27 |
| 28 |
| 29 |
| 30 |
| 31 |
| 32 |
| 33 |
| 34 |
| 35 |
| 36 |
| 37 |
| 38 |
| 39 |
| 40 |
| 41 |
| 42 |
/
| 〈 |
|
〉 |