
Evaluation of Wetland Ecological Service Function in Momoge National Nature Reserve Based on Ecological Water Demand
Received date: 2023-07-31
Revised date: 2023-09-27
Online published: 2024-04-24
Copyright
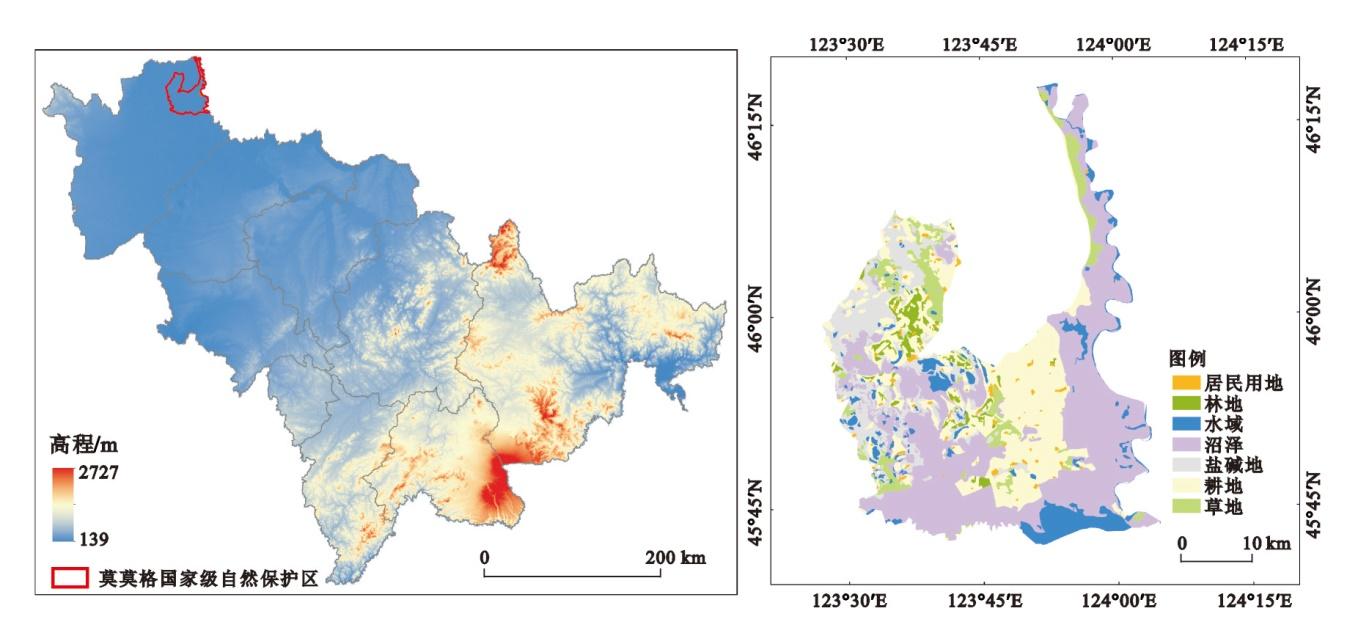
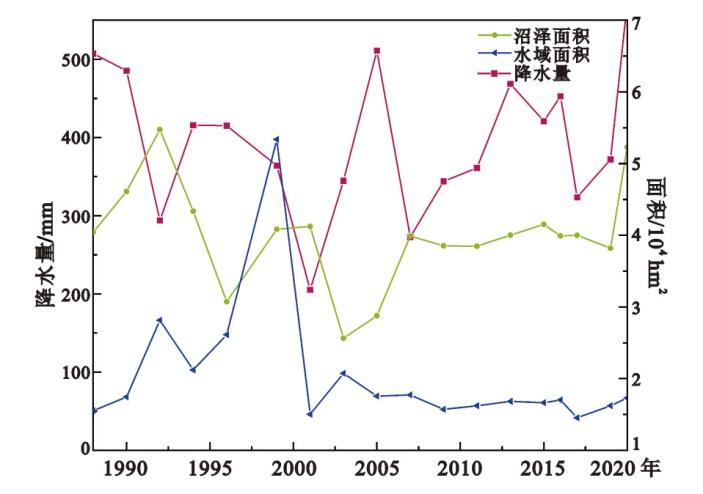
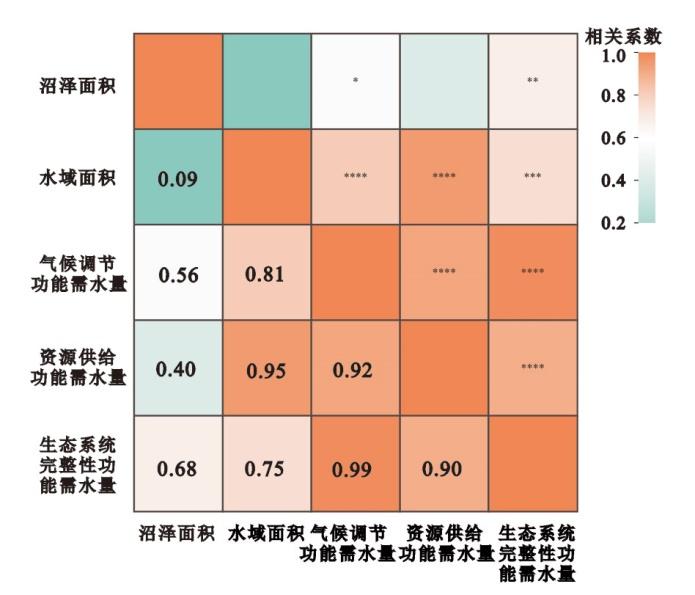
Wetland ecological service function is an important manifestation of wetland ecosystem security. The evaluation of wetland service function can directly reflect the damage situation or restoration effect of wetland, and quantitatively analyze the influencing factors of its change. Ecological environmental water requirement is the representation of regional water resource supply and demand and spatial pattern changes, and plays a supporting role in wetland ecological service function. The evaluation of wetland ecological service function based on ecological and environmental water demand can clarify the causes of changes in regional ecological and environmental characteristics from the root, and then clarify the changes of ecological service function. Taken Momoge National Natural Reserve as the study area, this study uses land use, vegetation and hydrological data to quantitatively calculate three important wetland ecological service functions, namely climate regulation, resource supply and ecosystem integrity protection, based on the composition and weight of each ecological service function. The results showed that the ecosystem service function and ran well from 1988 to 1999, and then gradually weakened with the degradation of the wetland from 2000 to 2010, finally it rebounded after 2011, indicating that the wetland conservation work was effective and the degradation rate of the wetland was slowed down and the ecological service function of wetland is gradually restored. The research results will serve the evaluation of ecosystem service function in the study area from the perspective of ecological environmental water demand, and the prediction of wetland change trend will be realized in combination with climatic conditions such as rainfall and temperature, which is of great significance for wetland protection and management.
NI Heshan , LI Hongyan , TONG Shouzheng , CUI Geng , ZHANG Mingye . Evaluation of Wetland Ecological Service Function in Momoge National Nature Reserve Based on Ecological Water Demand[J]. Wetland Science, 2024 , 22(3) : 437 -444 . DOI: 10.13248/j.cnki.wetlandsci.2024.03.012
1 生态环境需水量计算方法Calculation method of water requirement for ecological environment |
| 类别 | 计算方法 | 含义 |
| 水面蒸发需水量 | Ww =∑A(E-P)×10-3 | A(m2)为实测湖泊水库面积;E(mm)为相应水面蒸发量;P(mm)为相应水面降水量 |
| 植物需水量 | Wp=Ep×A×10-3 | Ep(mm)为蒸散发量;A(m2)为沼泽湿地面积 |
| 栖息地需水量 | Wh =εAh×Hh | Ah(m2)为湿地面积;Hh(m)为湿地地表水平均水深;ε为湿地水面面积百分比,根据不同分区和湿地特征确定 |
| 渗漏需水量 | W河渗=K1×A W库渗=K2×W蓄 | K1和K2为渗透系数;A(m2)为河段水面面积;W蓄(m3)为水库平均蓄水量 |
2 各生态需水类型的层次分析权重Weight proportion of various ecological water requirements in hierarchical analysis |
| 指标 | 层次分析权重Wci | 一致性检验 | ||||||||
| 水面蒸发量 | 植物蒸散量 | 渗漏需水量 | 栖息地需水量 | |||||||
| 注:表中没有数据的表示该项指标对生态需水类型无支撑作用,不予考虑。 | ||||||||||
| 气候调节 | 0.70 | 0.30 | ||||||||
| 资源供给 | 0.22 | 0.78 | ||||||||
| 生态系统完整性 | 0.43 | 0.37 | 0.20 | CR=0.005<0.1 | ||||||
3 莫莫格国家级自然保护区AHP-熵权综合权重The comprehensive weight of AHP-entropy weight in Momoge National Natural Reserve |
| 指标 | AHP-熵权综合权重Wi | ||||||||
| 水面 蒸发量 | 植物 蒸散量 | 渗漏 需水量 | 栖息地 需水量 | ||||||
| 注:表中没有数据的表示该指标对生态需水类型无支撑作用,不参与权重计算。 | |||||||||
| 气候调节 | 0.72 | 0.28 | |||||||
| 资源供给 | 0.18 | 0.82 | |||||||
| 生态系统完整性 | 0.47 | 0.25 | 0.28 | ||||||
4 生态环境需水量级别划分Classification of water requirements for ecological environment |
| 级别 | 水面蒸发需水量 | 植物需水量 | 渗漏需水量 | 栖息地需水量 |
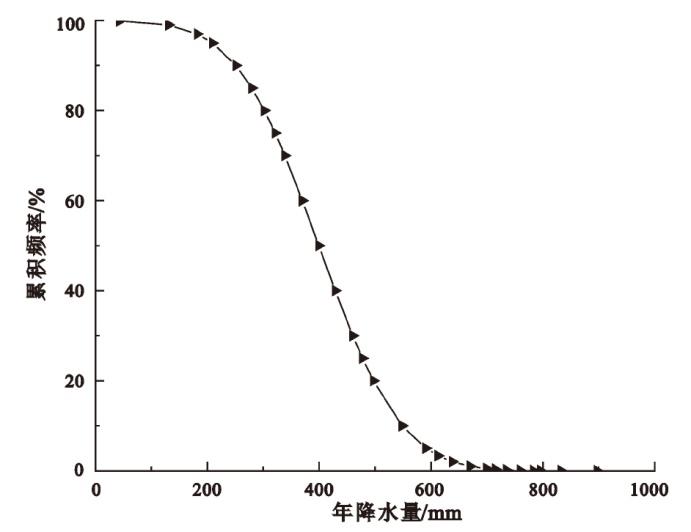
| 注:表中的E(mm)为水面蒸发量;Pn%(mm)为降水频率为n%下的水面降水量;A(hm2)为各部分需水量计算对应的面积。 | ||||
| 最小 | [(E-P5%)~(E-P20%)]×10A | (0.8~1)×104A | 0.9(0.1~0.15)×104A | (0.1~0.15)(0.3~0.5)×104A |
| 中等 | [(E-P20%)~(E-P50%)]×10A | (1~1.2)×104A | 0.9(0.15~0.25)×104A | (0.15~0.25)(0.5~0.7)×104A |
| 优等 | [(E-P50%)~(E-P75%)]×10A | (1.2~1.4)×104A | 0.9(0.25~0.45)×104A | (0.25~0.45)(0.7~1.0)×104A |
| 最优 | [(E-P75%)~(E-P95%)]×10A | (1.4~1.6)×104A | 0.9(0.45~0.65)×104A | (0.45~0.65)(1.0~1.5)×104A |
| 最大 | [(E-P95%)~(E-P99%)]×10A | (1.6~1.9)×104A | 0.9(0.9~1.0)×104A | (0.9~1.0)(2.0)×104A |
5 莫莫格国家级自然保护区生态服务功能需水量分级标准Classification standard of water requirement for ecological services in Momoge National Natural Reserve |
| 指标 | 最小需水量(108 m3) | 中等需水量(108 m3) | 优等需水量(108 m3) | 最优需水量(108 m3) | 最大需水量(108 m3) |
| 气候调节 | 1.71~1.97 | >1.97~2.32 | >2.32~2.92 | >2.92~3.44 | >3.44~4.01 |
| 资源供给 | 2.64~2.92 | >2.92~3.07 | >3.07~3.53 | >3.53~4.23 | >4.23~4.96 |
| 生态系统完整性 | 1.83~2.12 | >2.12~2.54 | >2.54~3.29 | >3.29~3.97 | >3.97~4.87 |
6 1988年至2020年间18个年份莫莫格国家级自然保护区的生态环境需水量Ecological water demand of Momoge National Natural Reserve in 18 years from 1988 to 2020 |
| 年份 | 水面蒸发需 水量(104 m³) | 植物需水 量(104 m³) | 渗漏需水 量(104 m³) | 栖息地需水 量(104 m³) |
| 1988年 | 8 736 | 53 531 | 16 068 | 21 852 |
| 1990年 | 7 606 | 61 026 | 16 170 | 24 650 |
| 1992年 | 16 982 | 72 461 | 17 058 | 37 056 |
| 1994年 | 12 602 | 57 394 | 16 874 | 28 233 |
| 1996年 | 15 306 | 40 697 | 17 098 | 31 666 |
| 1999年 | 29 385 | 54 066 | 18 470 | 61 643 |
| 2001年 | 15 054 | 54 569 | 14 865 | 21 442 |
| 2003年 | 13 888 | 33 937 | 14 893 | 25 292 |
| 2005年 | 10 513 | 38 069 | 14 513 | 22 390 |
| 2007年 | 12 272 | 52 798 | 15 185 | 24 091 |
| 2009年 | 9 143 | 51 003 | 15 128 | 21 789 |
| 2011年 | 8 959 | 50 937 | 15 037 | 22 306 |
| 2013年 | 6 855 | 52 993 | 15 117 | 23 165 |
| 2015年 | 8 074 | 54 951 | 15 172 | 23 179 |
| 2016年 | 7 632 | 52 857 | 15 037 | 23 350 |
| 2017年 | 12 107 | 42 348 | 14 716 | 21 428 |
| 2019年 | 8 048 | 50 577 | 14 810 | 20 520 |
| 2020年 | 8 297 | 69 212 | 15 283 | 25 356 |
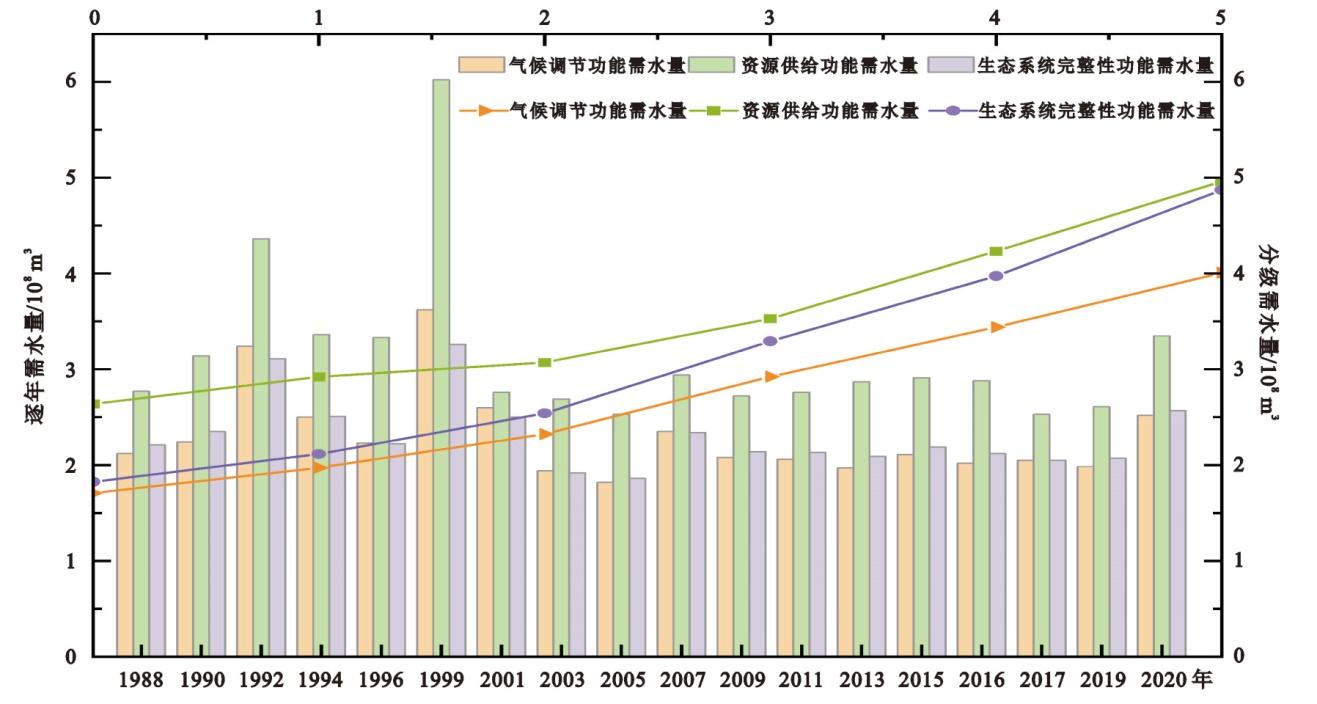
7 1988年至2020年间18个年份莫莫格国家级自然保护区的生态服务功能需水量Water requirement for ecological service functions in Momoge National Natural Reserve in 18 years from 1988 to 2020 |
| 年份 | 气候 调节(108 m³) | 资源 供给(108 m³) | 生态系统 完整性(108 m³) |
| 1988年 | 2.12 | 2.77 | 2.21 |
| 1990年 | 2.24 | 3.14 | 2.35 |
| 1992年 | 3.24 | 4.36 | 3.11 |
| 1994年 | 2.50 | 3.36 | 2.51 |
| 1996年 | 2.23 | 3.33 | 2.22 |
| 1999年 | 3.62 | 6.02 | 3.26 |
| 2001年 | 2.60 | 2.76 | 2.50 |
| 2003年 | 1.94 | 2.69 | 1.92 |
| 2005年 | 1.82 | 2.53 | 1.86 |
| 2007年 | 2.35 | 2.94 | 2.34 |
| 2009年 | 2.08 | 2.72 | 2.14 |
| 2011年 | 2.06 | 2.76 | 2.13 |
| 2013年 | 1.97 | 2.87 | 2.09 |
| 2015年 | 2.11 | 2.91 | 2.19 |
| 2016年 | 2.02 | 2.88 | 2.12 |
| 2017年 | 2.05 | 2.53 | 2.05 |
| 2019年 | 1.98 | 2.61 | 2.07 |
| 2020年 | 2.52 | 3.35 | 2.57 |
| 1 |
| 2 |
| 3 |
| 4 |
| 5 |
| 6 |
| 7 |
| 8 |
| 9 |
| 10 |
| 11 |
| 12 |
| 13 |
| 14 |
| 15 |
| 16 |
| 17 |
| 18 |
| 19 |
| 20 |
| 21 |
| 22 |
| 23 |
| 24 |
| 25 |
| 26 |
| 27 |
| 28 |
| 29 |
| 30 |
| 31 |
| 32 |
| 33 |
| 34 |
| 35 |
| 36 |
| 37 |
| 38 |
/
| 〈 |
|
〉 |