Big data of geography
This paper reveals the principle of geographic big data mining and its significance to geographic research. In this paper, big geodata are first categorized into two domains: earth observation big data and human behavior big data. Then, another five attributes except for "5V", including granularity, scope, density, skewness and precision, are summarized regarding big geodata. Based on this, the essence and effect of big geodata mining are uncovered by the following four aspects. First, as the burst of human behavior big data, flow space, where the OD flow is the basic unit instead of the point in traditional space, will become a new presentation form for big geodata. Second, the target of big geodata mining is defined as revealing the spatial pattern and the spatial relationship. Third, spatio-temporal distributions of big geodata can be seen as the overlay of multiple geographic patterns and the patterns may be changed with scale. Fourth, big geodata mining can be viewed as a tool for discovering geographic patterns while the revealed patterns are finally attributed to the outcome of human-land relationship. Big geodata mining methods are categorized into two types in light of mining target, i.e. classification mining and relationship mining. The future research will be facing the following challenges, namely, the aggregation and connection of big geodata, the effective evaluation of mining result and mining "true and useful" knowledge.
Using big data to analyze the spatial pattern of urban service facilities has become a new research hotspot, and catering industry is a typical representative of urban service industry. Therefore, it is of great significance to study the spatial layout of urban catering industry through open source big data. The restaurants in a city can be abstracted as point objects in the geographical study , and clustering analysis is a classical data mining method that quantificationally identifies geographical clustering among objects. In this paper, Beijing is selected as the research area, and the data of 153 895 restaurants in Dianping.com are obtained by using web crawler technology. The density-based CFSFDP clustering algorithm (clustering by fast search and find of density peaks) is adopted here to analyze the geographical clustering characteristics of catering industry in terms of spatial distribution density and per capita consumption level. This approach, which is based on the idea that cluster centers are characterized by a higher density than their neighbors and by a relatively larger distance from points with higher densities, can recognize clusters regardless of their shape and the dimensionality of the space in which they are embedded, so more accurate spatial analysis results can be obtained. The results show that: (1) the spatial pattern of Beijing restaurants is imbalanced, which generally presents the characteristics of multi-center spatial distribution, and the agglomeration degree of restaurants decreases with the distance increase from the main urban area which are regarded as the core. Besides, the restaurants hot spots mainly circles around important business centers, tourist attractions as well as residential areas, and extends along the traffic line evidently. (2) The catering stores with different per capita consumption levels have the characteristics of hierarchical system. That is to say, there are the number of high-grade restaurants is few, and mainly concentrated in the commercial centers, financial centers and famous tourist attractions in Dongcheng district, Xicheng district, Chaoyang district and Haidian district, while the number of middle and low-grade restaurants is much more and their spatial distribution are more scattered. (3) The density and price of restaurants accords with consumption level of consumers. At the same time, this paper also analyses the factors influencing the spatial distribution pattern of catering clusters by combining the two indicators of spatial agglomeration characteristics and consumption level, in order to provide useful reference of urban commercial spatial layout for the government planning departments.
The rapid growth of nation's economy has driven the unprecedented pace of urbanization in China over the past several decades. Urbanization process is a complicated geographical phenomenon involving human-nature interactions, such as population aggregation, land use change, infrastructure construction and eco-environmental changes. Hence, an understanding of the spatiotemporal dynamics of urban development is increasingly important for a variety of issues including research, planning, management and policy decision making. Owing to a spatially and temporally explicit manner of sensed information with respect to the magnitude of socio-economic activity related to urban development, the recent emergence of satellite-derived nighttime light data provides new means for investigating urban patterns and urbanization processes. In the present study, four kinds of quantitative information, including the spatial lighting area, temporal turning point, the spatial transformation of different types of lit areas and the velocity of spatial disperse of nighttime lightings signals, have been obtained and quantitatively analyzed based on time series of big data of annual composite products of nighttime light radiances during the period 1992-2013 from the Defense Meteorological Satellite Program (DMSP). Analysis results reveal the spatiotemporal patterns of China's urbanization over the past 22 years from the perspective of remotely sensed big data of artificial nighttime lighting signals in context of the spatial expansion, the distribution of urbanization onset time, the evolution of spatial structure and the urbanization velocity. This study can provide new insights into the understating of the fundamental spatiotemporal features of the rapid urbanization process in the present-day China using the remotely sensed big data of observed anthropogenic nighttime lighting signals.
The information of public security event contained in text can be the data source of the evaluation and the relief if it can be structured into a relational database. Although previous research can extract the information of events into different attributes, the determination on the attribution of the attribute information to specific event remains unsolved. To solve the problem, this paper proposes a theoretical frame of public security event themed web text structuring, which is composed of three parts. First, an event semantic model is used to construct the seismic event semantic framework which defines abstract elements of event and their semantic relationships. Taking seismicity as an example, spatial element, time element, attribute element, source element are defined as basic elements. Spatial element includes earthquake latitude, longitude, depth and location. Attribute element is further subdivided into four sub-elements: Cause, result, behavior and influence element. Next, an annotation system is applied to typical event materials to label semantic elements, e.g. the place name where an earthquake took place, that is, instantiation of the abstract elements. The key to this step is labeling the relations between elements and specific event. Finally, the event text is structured into event type, event name, event time, event location and other attributes by using the text information extraction algorithm. The algorithm used the labeled materials in the last step as training data to optimize parameters, which can incorporate linked information. The extracted event text (e.g. words, phrases) finally is normalized to structured information for further analysis. An event information mining platform following the whole frame is developed, which includes the modules of webpage searching, text cleaning, event information extraction, visualization and analyzing. The platform processed the whole Chinese webpages of 2014 and found 85 506 seismicity reports. Taking Yunnanludian earthquake as an example, we display the structuring process and result of related web text, which can be the important reference for the relief of the disaster and the analysis of public concern. With the platform, we can demonstrate the seismic text structuring result and its social concern across China, which can be a new tool of event information mining and analyzing.
The space pattern of urban population distribution is a classical research topic of urban science and urban planning. In terms of the current research situation of urban population distribution, the LBS big data technology which is considered as a new method and tool to observe the urban spatial and temporal characteristics is introduced into the research of urban population distribution based on the traditional space syntax model. Then, a new idea of urban population distribution research with the integration of theoretical distribution and actual distribution is established. The case study in the central urban area of Hefei City shows that: the spatial clustering areas obtained respectively by space syntax model and LBS big data analyses are different in space. According to the comprehensive comparison of space syntax model and LBS big data analysis, the central urban area of Hefei City is divided into 3 types of population distribution including high density, medium density and low density. The high density zoning consists of the old town, Shushan district and Baohe district. The medium density zoning includes Binhu district, Luyang district and High-tech area. Meanwhile, the low density zoning consists of economic developing area and Yaohai district. Finally, the suggestions of population distribution development in different density partitions are proposed. The research shows that the timely and dynamic characteristics of LBS big data can make up for the shortcomings of traditional data and greatly broaden the source and timeliness of basic data. Obviously, this will enhance the accuracy of the study. And, more importantly, it will provide more accurate and efficient tools and methods combined with the classical space syntax model for the study of urban population distribution. In addition, it is hoped that this research can make some exploration and reference for expanding the practical application field of LBS big data.
With the rapid development of the Internet, Internet of things, and cloud computing technology, data with geographical location and time tag are accumulated in an explosive way, and this indicates that we are in the era of big spatiotemporal data. In addition to the typical "4V" characteristics, big spatiotemporal data also contain rich semantic information and dynamic spatiotemporal patterns. Although massive spatiotemporal data have promoted the evolvement of various cross-disciplinary studies, traditional methods of data processing and analysis would no longer meet the requirements of efficient storage and real-time analysis of such data. Therefore, it is of great importance to integrate big spatiotemporal data with high-performance computing/cloud computing. To address this problem, this article begins with the concept and origin of big spatiotemporal data, and introduces its unique characteristics. Then, the performance requirements generated by current big data applications are analyzed, and the status quo of the underlying hardware and software is summarized. Furthermore, the article comprehensively reviews parallel processing, analysis, and mining methods for big spatiotemporal data. Finally, we conclude with the challenges and opportunities of storage, management, and parallel processing analysis of big spatiotemporal data.
Since 2010, big data has played a significant role in various fields of science, engineering and society. The paper introduces the concepts of geographic big-data, the fourth paradigm and nonlinear complex geographic system, and discusses interactive relationships of these concepts. It is proposed that geographic big-data and the fourth paradigm would become a new opportunity to research on geography complexity. Then the paper discusses how to use the methods of geographic big-data and complexity science to examine geography complexity. For example, based on big-data, a series of indicators of statistical physics fields could be constructed to describe the complex nonlinear characteristics of the real geographic world. Deep learning, complex network and multi-agent methods can be used to model and simulate the complex nonlinear geographic systems. These methods are important for a better understanding of the complexity of geographic phenomena and processes, as well as the analysis, simulation, inversion and prediction of complex geographic systems. Finally, the paper highlights that the combination of geographic big-data and complexity science would be the mainstream scientific method of geography in the 21st century.
Understanding human mobility patterns and spatial structure is of great important to urban planning, traffic management, emergence response, and so on. With the development of information and communication technologies, it is possible to collect large-scale, long-term human tracking data, which brings great opportunities and challenges for human mobility behavior studies. This article first introduces the main datasets being used for studying human mobility patterns, then reviews the recent progress from the perspectives of human travel behavior and urban spatial structure respectively. We found that most studies follow the route of "data-human travel behavior-urban spatial structure," mining and understanding human mobility patterns from the datasets and further giving insights on the characteristics of urban spatial structures. However, there exist few studies on the influence of urban spatial structure on human travel behavior. In the future, it is necessary to integrate multi-source spatiotemporal data to understand the interaction between human mobility and urban spatial structure, develop spatiotemporal analysis theory and models for dealing with mobile location big data, and focus on understanding the coupling relationship between human mobility and urban spatial structure.
Urban signs characterize the state of development and operation of a city, including construction conditions of built environment,driving force of urban economic and social development, operational status of facilities and urban activities of individuals in the city, etc. The diagnosis of urban signs equals to the health examination of urban development and operation, by which sticking points are recognized. A set of reliable and practical urban diagnostic indices is required not only to comprehensively reflect correlative sub urban systems that are static or dynamic, but also illustrate the status of urban system through quantitative methods and geo-visualization. Using traditional data and big data from different sources, this paper constructs a system of diagnostic index of urban signs based upon the integration of urban activity-travel system, urban population system, urban operation system, and urban environment system. The diagnostic index system is decomposed into 4 dimensions including fundamental force, driving force, pressure and vitality. The fundamental force index is used to describe basic attributes of land use and population; the driving force index reflects the state of development of spatial units through development of enterprises and quality of the environment; the pressure index is used to monitor the running status of the urban system, and as such, it plays a role in risk-evaluation and risk-warning; the vitality index reflects the real vitality of the spatial units by demonstrating the dynamic characteristics of the activity system and flows in time and space. 12 spatio-temporal scales are acquired through intersection of 4 levels of the spatial units(municipal Shanghai , district, Jiedao, census tract)and 3 levels of temporal scales(annual,daily and real time levels). The index weight is determined by fuzzy hierarchy analysis. Taking April 6, 2016 as an example, we calculate both comprehensive and dimensional diagnostic index of urban signs of Jiedaos (subdistrict that is sub-divided into several residential communities or neighbourhoods) in Shanghai and elaborate on how the diagnostic index of urban signs corresponds to actual state and facilitates detection of urban problems. Results show that comprehensive diagnostic index varies slightly while considerable variations emerge in diagnostic index of each dimension. Fundamental force index, driving force index and vitality index decline gradually from inner city to suburbs. On the contrary, pressure index increases from inner city to suburbs. Through visual and real-time analysis and evaluation, the diagnostic index of urban signs has huge potential for implementation in urban grid management, pressure warning and other needs of urban governance.
With the development of information technology, big data has become a research focus of all sectors. There is an increasing demand for big data in the urban planning management process. Big data acquisition and calculation is a key technology in the process of the smart city construction. This article covers the following major aspects: 1) Distance table linking to urban service physical store table is used to establish spatial association frequent rules model based on the concept of spatial neighbouring point and the property of spatial point entity; the article also introduces the method and procedure of how spatial frequent items and spatial association rules appear in urban service spatial association model; 2) “For xml path” technology is used in SQL Server to build spatial transaction database because transaction database is needed in association rules computing; 3) Python+sqlite3+lxml+BeautifulSoup technology is used to crawl the online data of the companies in Nanning which have all of their public information registered on “Baidu Nuomi” (https://nn.nuomi.com/); 4) Apriori algorithm is applied to analyze spatial frequent items and spatial association rules in urban service industry of 6 distance thresholds between 10 to 1 000 meters with the obtained data. In case study, the top six registered businesses in “Baidu Nuomi” are snacks and fast food, beauty, hotels, bakeries, sweets and drinks, budget hotels. The spatial association rule of {budget hotels, hotels} has a high degree of confidence and a high upgrading degree in the distance threshold of 10 m and 50 m, being a set of strong spatial association rules. This illustrates the Nanning hotel industry has the characteristics of a compact layout, with all kinds of hotels being together. The spatial association rule of {sweet drinks, snacks and fast food} is a set of strong spatial association rules in the distance threshold of 50 m, 500 m and 1 000 m. Snacks and fast food frequency is very high, especially in the succeeding rules with high support degree. In different distance thresholds, as a kind of mass consumer entity service, snacks and fast food restaurants are distributed around various industries. Because the lift degree of these rules is about 1, the snacks and fast food industry has the characteristics of no connection with other industries. This study is an attempt to use ubiquitous web data around us to analyze city management. Researchers can get a steady flow of big data so as to better carry out the studies on city big data in real time with this methods and thoughts.
This article analyzes perceptions concerning cultural heritage sites along the central axis of Beijing from community, temporal, and spatial perspectives by extracting keywords, word frequency, term frequency-inverse document frequency (TF-IDF) weight, mutual information, posterior probability, and other features in microblogs, newspapers and magazines, and academic publications in 2012 and 2015. On the community dimension, through media information of characteristic groups, we found that different groups have different understanding of cultural heritage sites. The core sites of Beijing Central Axis cultural heritage, such as the Imperial Palace, Tiananmen, and Temple of Heaven are perceived relatively consistently by different communities. But the perceptions of the Bell and Drum Towers, Imperial Ancestral Temple, and Di'anmen are varied: officials are concerned with their administrative aspects, scholars are concerned with their historical values, and the public are concerned with their leisure and entertainment qualities. On the temporal dimension, changes of level of attention and perception on these cultural heritage sites are also observed. In 2015, the public paid more attention to the Forbidden City, Tiananmen, the Temple of Heaven, and the Imperial Ancestral Temple for their historical values as compared to 2012. Public perception, compared with that of officials and scholars, is more likely to change and more sensitive to significant events. On the spatial dimension, this research has examined the transfer of perception and correlation between cultural heritage sites. First, Tiananmen, Zhengyang Gate, and Zhengyang Avenue, which are connected in space, show higher two-way perceptions. Second, the posterior probability of the Imperial Palace, Tiananmen, and the Temple of Heaven is higher among the central axis cultural heritage sites, showing a cross space perception convergence model. Thus the analytical framework for perception of cultural heritage based on big data is an important supplement for traditional methods such as questionnaires, literature research, and interview analysis, as it increases the dimension and efficiency of analysis and aids to discover hidden knowledge and patterns. The conclusion of this study can provide important support for policy making in the rediscovery and protection of cultural heritage values.
The contemporary studies of tourism big data are not sufficient to utilize online tourist-generated contents for evaluating tourism destinations, while the content-analysis studies in linguistic studies have yet to have qualified technics for conducting tourism research. In order to bridge this gap between these, this paper constructs an emotion model for evaluating tourism destinations based on tourists' online reviews. This model is composed of three emotional filtering factors including tourism lexicon, grammatical logics and emotional multipliers. The tourism lexicon contains 3507 positive emotional words and 3365 negative emotional words. It is used to depict the general emotional image of a tourist online review by calculating positive and negative words within the review. Every emotional word will be counted as one score, either positive or negative. Grammatical logics contain 13 rules which adjust the positive or negative scores and give the final emotional score of the review. Emotional multiplier in this study is set from three to five. It is used to correct the deviation of exaggerated positive emotions due to the existing pro-positive preference in human emotional expression. This paper collects 120731 pieces of tourists' online reviews among eight tourist destinations (Yangshuo, Zhangjiajie, Huangshan, Chengdu, Luoyang, Kanas, Jiaozuo and Xishuangbanna) and uses this model to evaluate the overall emotional images of these destinations. The result is compared to the questionnaire-based survey data conducted by UNWTO (United Nation, World Tourism Organization) among these destinations from 2013 to 2015. The verification proves that the three emotional filtering factors are effective in mapping emotional images of tourists' online reviews. Based on both single and multiple-year verification, the accuracy of the proposed six sub-models is ranged from high to low as follows: C2>C1>C3>B>Direct Scores>A. This outcome means that the model-based result is the closest to the UNWTO result under the C2 that emotional multiplier is set at 4 and the tourism lexicon and grammatical logics are applied. This paper contributes to the literature by paving alternative ways of destination evaluation and proves the usefulness of tourism big data in geographical studies. This effort will underpin subsequent theoretical and empirical studies in tourism geography.
Appearance of Information and communication technology has set off a new wave of big data to promote a transformation of the traditional methods in urban studies. However, types of limitations of big data also make scholars rethink the role of small data in specific applications for research. We believe that the small data will not lose its value, instead, it can be combined with big data in urban study, which is needed to focus on relationship between urban and resident activity in the information era. Therefore, we should discuss a new framework for such combination on complicated urban problems and diversified resident demands. Firstly, we put forward to three methodologies including combination between physical space and activity space, combination between correlativity and causality, and combination between macro-scale analysis and micro-scale analysis. Secondly, based on above methodologies, we build three method frameworks for urban studies in the information era, namely ‘Spatial development evaluations for big samples+Spatial difference and connection discovery+Factors discussions for small samples’, ‘Model building for small samples+Factors discussions+Verifications and explorations for big samples’, and ‘Micro-analysis of activities+Delineations of activity space+Factors discussions’. Finally, we discuss applications of above three method frameworks.
Along with the accelerating urbanization, there are more and more contradictions between the number of cars and urban transportation facilities. The congestion time and congested roads in cities are increasing. Intelligent urban traffic management platform is the effective method to alleviate the increasingly serious urban congestion problems. By using prediction results of traffic flow big data, the platform can guide users to adjust the travel plan, and ease the traffic pressure effectively. How to use a large number of spatio-temporal data related to traffic activities to predict the traffic flow is the key to realizing traffic guidance. In this article, a distributed incremental aggregation method for traffic flow data is studied. The method combines the distributed incremental data aggregation method with the traffic flow data cleaning rules, makes cleaning and counting of traffic flow big data, and provides data for traffic flow forecast. With the analysis of traffic flow correlation in the network of upstream and downstream, this article uses the multi-order of turning rate in the intersection to quantize the correlation, builds the spatial weight matrix based on the road network correlation, and improves the STARIMA model. In this article, two groups of contrast experiments were made. Through the contrast experiment between MapReduce method and MPI method, the result proves that the method proposed in this article is better than the MPI method in the development cycle and stable operation. The method’s efficiency can meet the need of traffic flow data aggregation. The traffic flow statistics can be used as the basis of traffic flow forecasting. Through the contrast experiment between the Improved STARIMA model and the Dynamic STARIMA model, the result proves that the Improved STARIMA model, which considers the multi-order correlation between the upstream and downstream sections, matches the distribution rules of traffic flow in road network better. Therefore, the forecast results are more accurate. In conclusion, the method of this article is a new method of traffic flow forecasting in the background of big data, and it can realize accurate prediction.
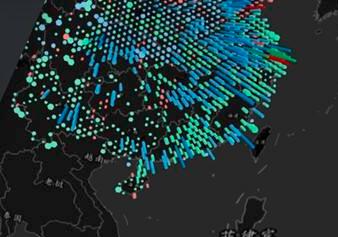
This article researched into the pig’s circulation in China by using data visualization and combined analysis of the current status of pig’s circulation and the Chinese urban agglomeration. At the end of the study, the results showed the spatial distribution pattern of pigs in China based on the status quo of the development of urban agglomeration, and provided the basis for policy formulation for the relevant agricultural sector. In this article, Beijing, Tianjin, Shanghai, Chongqing, Heilongjiang, Jilin, Liaoning, Shandong, Hebei, Henan, Hubei, Hunan, Anhui, Jiangsu, Zhejiang, Sichuan, Yunnan, Guangdong, Guangxi and municipalities were chosen as the research object. Firstly, statistical data on pigs was integrated with GIS data, remote sensing data and network data to result in an integrated multi-source data. When big data technology and GIS was used to visualize this integrated multi-source data we can get the status quo of pig’s circulation in 19 provinces and municipalities. The visualization process was based on the New national urbanization plan (2014-2020) and the results of previous studies for dividing China into urban agglomeration. The results of the study was due to the combined analysis of the status quo of the pig’s circulation and the visualization results of the urban agglomeration in china. The study summed up the current situation of the pigs circulation of the city group to get the spatial distribution pattern of pigs based on the development of urban agglomeration in China. Finally, the problems of the distribution pattern of pigs in China was analyzed to give the corresponding solutions. According to the analysis of the spatial distribution of pigs, the research object was divided into 4 categories: The first category showed that the region needs to be supplied with a large number of pigs, including Beijing, Shanghai, Jiangsu, Zhejiang, Guangdong; The second category showed that, the region have both pigs inflow and outflow, including the three northeastern provinces, Henan, Shandong, Hubei, Hunan, Sichuan; The third category showed that, live pigs move out of the region including Hebei, Anhui, Yunnan, Guangxi; The fourth category is Chongqing, there is not a lot of pigs inflow and outflow. Beijing, Tianjin city group, the Yellow River Delta city group and the Zhujiang River Delta city group is the most important pork consumption areas, 69.6% of the pigs flow is related to the three groups. The main pigs production areas are concentrated in the middle, the east, the southwest and the northeast of China, and the east and southeast coastal areas are the main pigs consumption—it can be summarized as ‘pigs of the west supply in the east, pigs of the north supply in the south’. The eastern coastal areas are the most important part of the pig’s circulation system in China, the production and consumption of the pigs in the eastern coastal areas is the key factor for the change of the pig’s circulation pattern in China.
With the further process of urbanization and industrialization, the structure of industrial space has been restructuring, which leads to a sharp contradictions between demand and supply of land resources. Because of this serious disorder development of land resources, it is a primary task of ecological civilization to optimize the spatial pattern of land resources.Meanwhile, a higher requirement of land use planning is needed to allocate scientifically and reasonably land resources. Therefore, the traditional methods of land use planning need to be reformed. In this paper, in order to achieve the purpose of coordination development based on the strategy of ‘Community life of mountain-water-forest-cropland-lake’, we follow the concept of respecting and conforming to nature, and summarize the impact of land-based physical process on land use planning. Moreover, with the advent of the era of ‘big data’, we find that many technical methods, such as cloud computing, spatial data integration, cloud analysis, provide a new technical support to land use planning.Finally, considering the special characteristic of land use planning data and mobile user terminal is needed, we suggest that cloud services platform should be created, which enables integrated management and updating data of land planning, thereby, it will improve the quality of land use planning.
With the wide applications of information and communication technologies in port infrastructures and operations, huge volumes of maritime sensing data have been generated. These data come from various sources and demonstrate heterogeneous structures, providing us with new opportunities to understand port performance and regional economic development. In this paper, we introduce the recent work on port sensing and computation based on maritime big data. Specifically, by making use of ship GPS trajectories, ship attributes, port geographic information and port facility parameters, we can automatically estimate a set of metrics for the measurement and comparison of port performance. First, we can use ship GPS trajectories and port geographic information to detect the events of ships arriving at different ports and terminals. Second, we can use ship attributes and port facility parameters to estimate the cargo throughput of each arrived ship. Third, we can aggregate the ship arriving events and the cargo throughput in different terminals and ports to derive a set of port performance metrics, including ship traffic, port throughput, terminal productivity and facility utilization rate. Evaluation results using real-world maritime data collected in 2011. Results showed that these methods accurately estimated the port performance metrics. We also presented a case study in port of Hong Kong to showcase the effectiveness of our framework in port performance analysis.
With the development of Information and Communication Technology (ICT), big data is now becoming an important tool to carry on researches in many fields. In the domain of human geography, big data technology has gained more and more attention, and there are extensive studies carried out which could be categorized into three groups of research hotspots: the residential behavioral spatial pattern, the urban space and the regional structure. But few researches have explored the regional hierarchical spatial structure systematically based on the big data, and the relevant researches are primarily based on the survey data, which has a bottleneck towards the volume and the detailed micro-data acquisition. This study combined the internet big data mined from internet with the GDP and the spatial traffic network data, etc. to identify the regional spatial structure. The gathered data was categorized into three categories: the point data, the line data and the polygon data. They are used to specify the urban overall capacity and the intensity of interactions between city pairs and the serving area respectively. Based on the obtained data, an algorithm was developed to identify the hierarchical regional structure. This method was applied to the Beijing-Tianjin-Hebei region. And a hierarchical regional structure was demonstrated by a multi-way tree created with this algorithm. The established multi-way tree identifies a regional urban ranking system in detail and can be of great help to decision makers in delineating the regional spatial policies. The results shows that Beijing which has the highest overall capacity becomes the core city (root node) and has the largest serving area, but the matured secondary cities around Beijing are still expected to share Beijing's serving functions, and there is a development inequality existing between the north and south part of this region. This study provides a good reference to researches in the domain of human geography with the application of big data.
The ability to acquire the remote sensing data is increasing day by day, which directly causes the remote sensing data to become diverse and massive, and the issue that the massive amount of data is being non-affordable to store has become more and more prominent. On the other hand, due to the lack of an effective and efficient method of storage management, the data that theterminal application need is difficult to found in a timely manner, therefore, is stored but useless. This paper focuses on the storage and management problems of the massive, high through put and spatially structured remote sensing data and the basic land information products. We have presented a storage and management method which uses the big data structure and can integrate both the vector and raster data. Based on the MongoDB database, the prototype system is realized and we use the data of PB rangeto test it. Eventually, we have proved that this method meets the demand for the storage and management of the remote sensing vector-raster data in the era of big data. On the basis of the study results and prototype system, the following studies need to be further explored: (1) The organization and management methods for internal data of resources, especially the objective and timely management for the vector data; (2) Real-time interactive visualization methods for different data types and storage modes of resources, achieving dynamic extraction and rendering ability based on in the heterogeneous data model; (3) To construct large data computing architecture on the heterogeneous type storage mode, and to implement multimodal computing framework to meet the needs of the remote sensing applications require.
Data visualization is an important service in remote sensing applications. To address the problems that it is difficult for the static pre-built map tile service to meet the requirements of professional data view, map configuration, spatial analysis and other applications, this paper presented a solution architecture for the real-time rendering and interactive visualization of remote sensing big data. Firstly, on the rendering nodes, a rendering-tile structure for image was constructed to improve the reading speed of remote sensing images. Secondly, on the visualization servers, a data-computing load balancing strategy was proposed to optimize the rendering efficiency of map tiles. Thirdly, a set of service interfaces for the interactive visualization was designed for the front ends of services. Compared with the traditional technology, this solution can not only achieve the real-time rendering and the interactive visualization of remote sensing data, but also obtain an equivalent service performance to the pre-built tile map service. Finally, based on the above solutions, an interactive visualization prototype system of remote sensing data was developed and was applied into the demonstrations of the real-time viewing of remote sensing images, the visualized computing and the visualized analysis.
In the era of big data, the rapid growth of geographic spatial temporal data has challenged the conventional application concepts, technical framework and service modes. In this paper, the concept and features of geographic spatial temporal big data is elaborated firstly. Then, the characteristics and challenges of the geographic spatial temporal big data computation are analyzed. Particularly, the theory of collaborative computing and service for the geographic spatial temporal big data is developed, which includes four levels of collaboration: data collaboration, technology collaboration, service collaboration and producing collaboration. According to the demand of the market-oriented operation and platform-based service, the technical frameworks of the geographic spatial temporal big data collaborative computing are designed. Furthermore, four common key technologies are discussed, including the remote sensing data preprocessing, the geographic spatial temporal data storage and management, the high performance computing and the visualization of geographic spatial temporal big data. Next, the remote sensing data processing system is developed, and is taken as a case to illustrate the implementation of collaborative computing and service of geographic spatial temporal big data. At last, this paper forecasts the future application mode of geographic spatial temporal big data.
In the internet era, "Big data" wave spread rapidly to the economic and social fields. Geography is the natural laboratory in which big data research and application can be seen at work. The written speech focused on collision between geography and big data. It reviewed big data research and application in geography study. We also discussed the opportunities and challenges we would face during this collision. In summary, big data has had a certain influence on the geography research, especially in the human geography domain. Geographic information science will develop rapidly in the internet era of big data. But there are few disturbances in physical geography. Big data can not change the core proposition and the basic paradigm of geography. We should hold an open inclusive attitude to big data theory study and application research in geography.
The rapid development of information and communication technologies and the wide use of smart devices in people′s daily life have generated a large amount of data-the big data. The information exploration has not only greatly influenced our life, work and thinking, but also presented a new paradigm of social science research, that is, from data-scarce to data-rich study, from static to dynamic analysis, from relatively simple hypothesis and model to comprehensive simulations and theory. Especially these big data with spatial information brings opportunities for human geography. Big data meets geography’s quantitative revolution and social transition and should not be overlooked, since it provides a large amount of timely and detailed data of human behavior. In the meantime, geographers also face risks and challenges. Firstly, geographers require careful rethinking with respect to the philosophy of science and consideration on the important distinction between data and knowledge. Data never speak for themselves and require contextual knowledge with respect to analysis and interpretation. Secondly, it is hard to say that geographers have well underprepared for big data. Geographers have long been used to the traditional statistical methods which are designed with regard to data-scarce science. New methods of handling and analyzing data sets that consist of millions or billions of observations are urgently needed. Thirdly, despite the emerging data deluge, there are a number of ethical and security challenges in working with these data. How to define the scale and boundary of data is also a challenge, since the data are growing all the time. Then this paper points out that emphasis should be equally placed on quantitative and qualitative research and small-data and big-data research. Geographers should pay attention to the "digital divide" since access to big data is limited, and geographers should cooperate with scholars in other academic fields.
The technology of "big data" has profoundly changed our life and society, and advanced scientific research. By taking social and human activities as main data source, this technology is of great potential of applications in human and economic geography. Drawing on recent progress in research, this article analyzes the new applications of big data to the research of urban hotspots, functional areas and boundaries, transportation and consumption behaviors and social geography. Based on these analyses, this article articulates the roles of big data in enriching data sources, adding new research themes, bringing new research paradigms, and stimulating the research of coupling to human-spatial research in human and economic geography. However, the technology of "big data" still needs improved, especially the "bias" issue in collection and the attributes of data. It also needs appropriately positioned in the application in human and economic geography because big data cannot replace the data that are collected from field work, or be applied without proper theoretical grounding and hypothesis, and replace the independent thinking of researchers and decision processes. These factors limit the application of big data, which requires more efforts on big data infrastructure development as well as exploration of human and economic geography. Acknowledging the opportunities and roles of big data application, human and economic geographers should emphasize the following to advance the research of this filed: exploring new data sources and paying closer attention to database construction inhuman and economic geography, establishing a research paradigm towards big data applications, facilitating cross-disciplinary and cross-domain research to strengthen the study of human-nature relations, and emphasizing the research towards human behaviors and demands.
The uneven spatial and temporal distribution of taxi passengers not only affects cabdrivers' income-but also has an effect on development and enhance of taxi efficiency.Since taxi is regarded as the supplementation of city public transit, it is important to improve the taxi efficiency.According to many former researches done on taxi driving strategies, the objects always aim to focus on the taxi driver, and researchers merely consider the effects of an empty taxi situation, which may affect the taxi efficiency due to the fuel consumption and time cost.In this paper, in order to improve taxis' profits and efficiency, we used the taxis' GPS big data to optimizethe evaluation model of taxi efficiency by taking its empty state into consideration, and proposed the concept of high efficiency passengers for the first time. Then, we defined and quantified the high efficiency passengers, and established a new spatial and temporal analysis method for high efficiency passengers. Finally, we extracted high efficiency passenger source information and its spatial and temporal distribution pattern from taxi driving routs.To further verify this method, we took Wuhan's taxi data asan example, extracted the high efficiency passenger source from different aspects, such as time, space and screening conditions, and found some distribution patterns of the city passengers through comparison and analysis.According to the distribution patterns, the quantity of high efficiency passengers is associated with traffic conditions, and most high efficiency passengers are distributed far from the downtown area.These facts have proved that the studies on temporal and spatial distribution of high efficiency taxi passengers can provide scientific evidence and references for improving cab drivers' income and taxi efficiency.