
基于ECOSTRESS数据的天津市热岛时空特征分析
|
秦嘉凯(2002-),男,硕士研究生,主要从事热红外遥感研究。Email: rs_qjk@qq.com。 |
Copy editor: 陈昊旻
收稿日期: 2024-10-30
修回日期: 2025-06-13
网络出版日期: 2026-06-03
Spatiotemporal characteristics of the surface urban heat island effect in Tianjin City based on ECOSTRESS data
Received date: 2024-10-30
Revised date: 2025-06-13
Online published: 2026-06-03
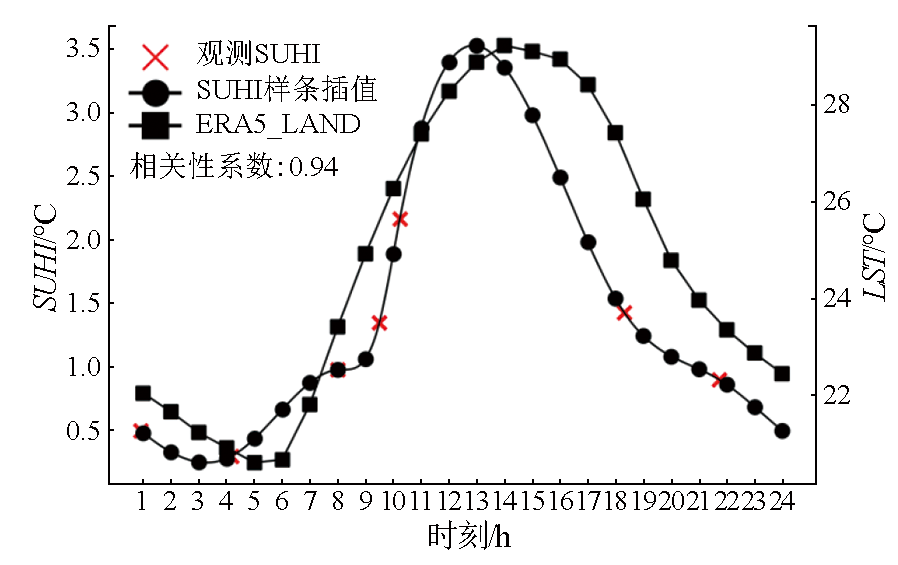
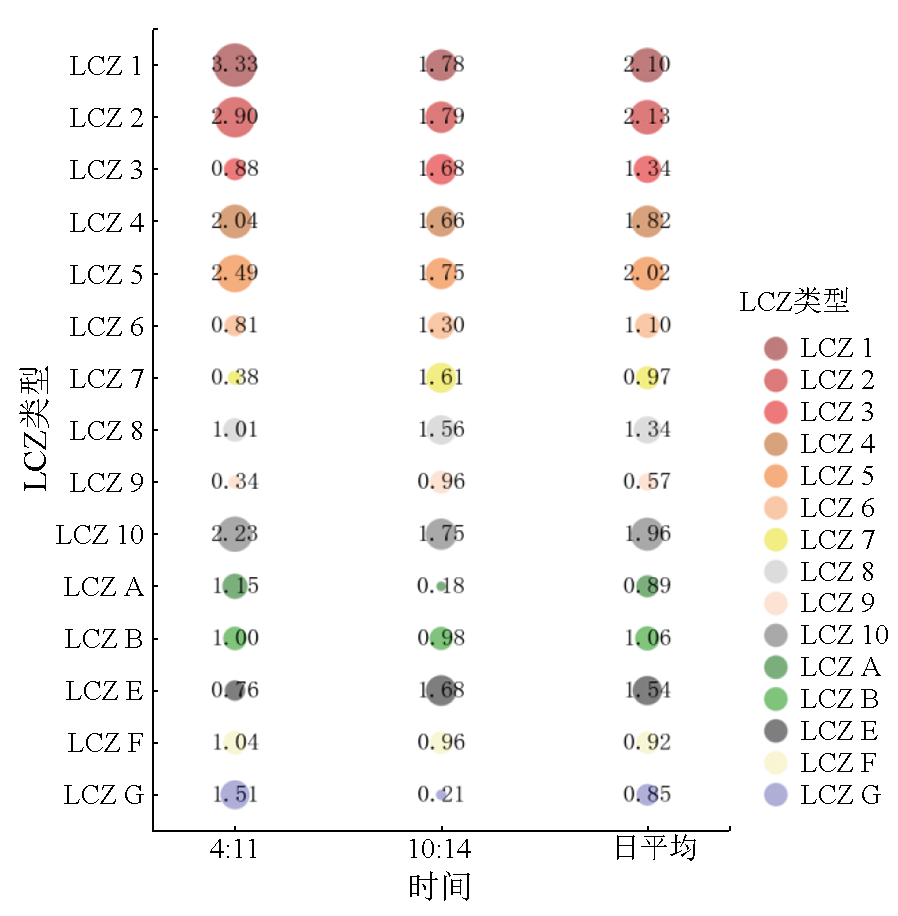
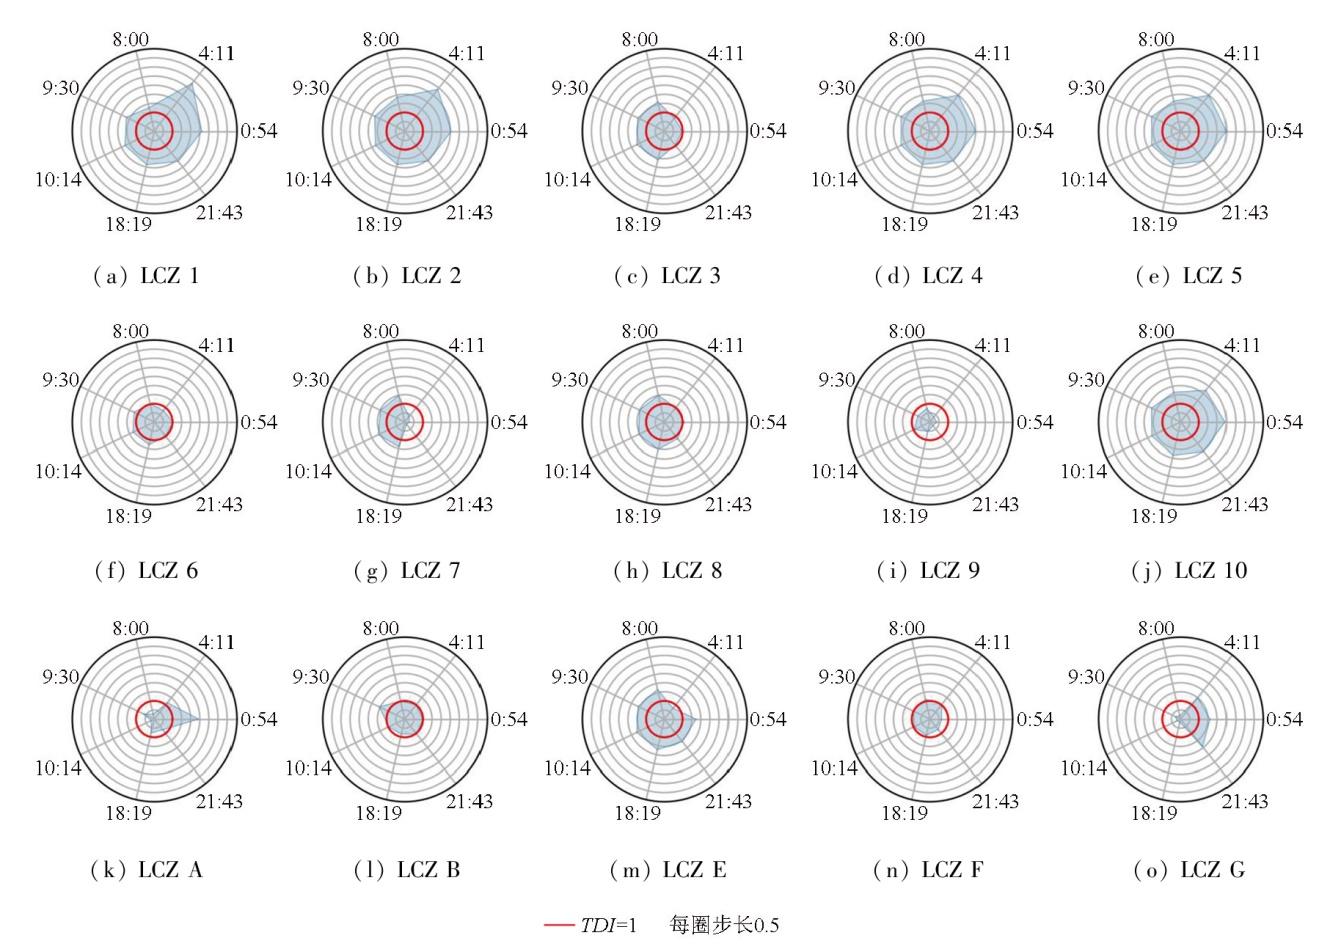
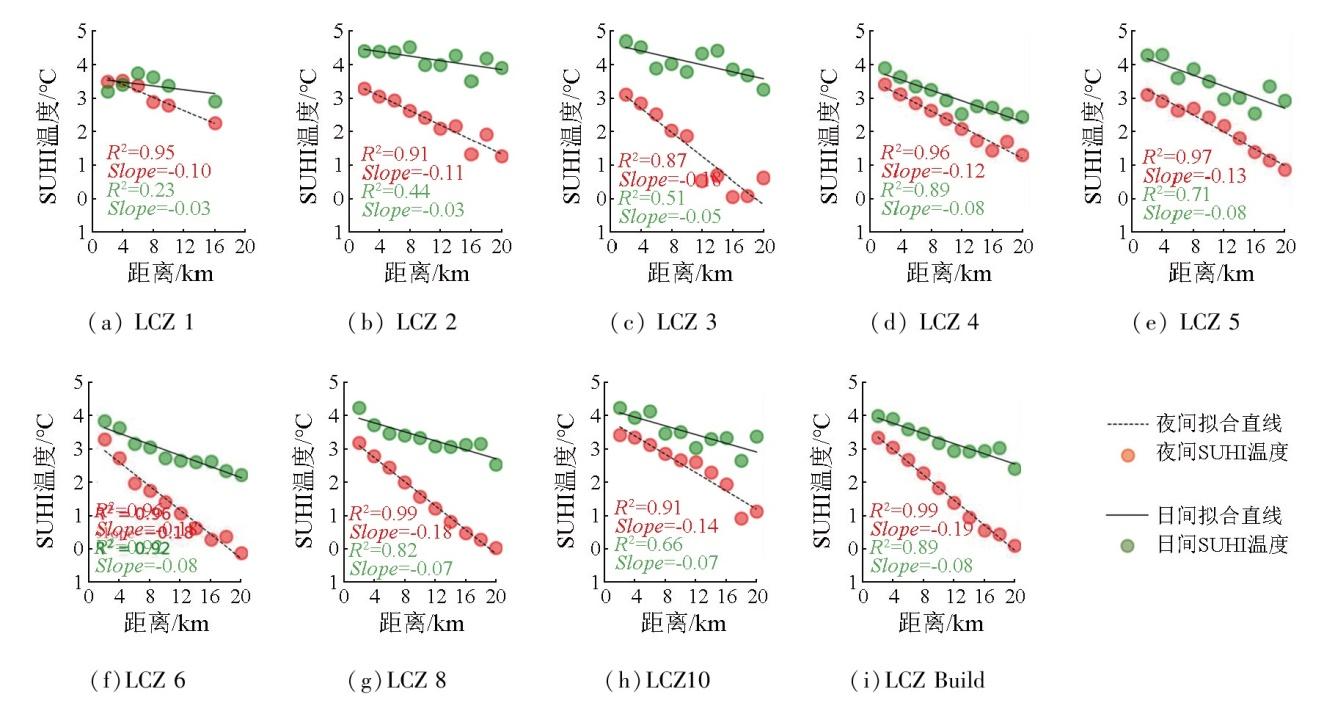
随着城市化进程不断发展,城市局部热环境和小气候发生了不同程度的改变,导致发生地表城市热岛(surface urban heat island,SUHI)效应。该文利用ECOSTRESS数据,以天津市作为研究区,结合局地气候区(local climate zone,LCZ)探索了SUHI的日内变化特征以及各LCZ类型对于SUHI的昼夜贡献和梯度衰减差异。结果表明: ①天津市中心城区SUHI日内变化较大,于3: 00达到最小值0.14,于13: 00达到最大值3.56,昼夜SUHI均差1.59; ②在日尺度上,不同LCZ类型对SUHI的贡献存在较明显的类内间差异,总体来看,LCZ 1(紧凑型高层建筑)和LCZ 2(紧凑型中层建筑)的热差异指数(thermal difference index,TDI)为2.10和2.13,是主要的热源,LCZ A(繁密树木)和LCZ G(水体)的TDI是0.89和0.85,是主要的冷源,LCZ 7(轻质低层建筑)、LCZ A(繁密树木)和LCZ G(水体)昼夜冷热源角色发生了显著转变; ③天津市中心城区SUHI存在明显的梯度效应,SUHI强度与距市中心距离、建筑高度、建筑密度负相关,日间莫兰指数为0.70,夜间SUHI莫兰指数为0.84,夜间SUHI空间聚集效应强于日间,其梯度效应强于日间梯度效应。本研究为城市规划和可持续发展政策提供了新的理解视角,对于缓解城市热岛效应、提高城市的居住舒适性和可持续发展有借鉴意义。
秦嘉凯 , 朱忠礼 , 吴青霞 , 张凯丽 . 基于ECOSTRESS数据的天津市热岛时空特征分析[J]. 自然资源遥感, 2025 , 37(6) : 275 -285 . DOI: 10.6046/zrzyyg.2024358
With the continuous advancement of urbanization, the local thermal environments and microclimates of cities have undergone varying degrees of change, leading to the surface urban heat island (SUHI) effect. Based on the ECOsystem Spaceborne Thermal Radiometer Experiment on Space Station (ECOSTRESS) data and local climate zones (LCZs), this study investigated the diurnal variations of the SUHI effect in Tianjin City, the contributions of various LCZs to the SUHI effect during daytime and nighttime, and the SUHI gradient attenuation differences. The results indicate that the central urban area of Tianjin exhibited significant diurnal variations in the SUHI effect, reaching a minimum value of 0.14 at 3:00 and a maximum value of 3.56 at 13:00, with an average diurnal-nocturnal difference of 1.59. On a daily scale, the contributions of various LCZs to the SUHI effect displayed notable intra-class and inter-class differences. Generally, LCZ1 (compact high-rise buildings) and LCZ2 (compact mid-rise buildings) showed thermal difference indices (TDIs) of 2.10 and 2.13, respectively, serving as the primary heat sources. In contrast, LCZA (dense trees) and LCZG (water bodies) yielded TDIs of 0.89 and 0.85, respectively, serving as the primary cold sources. Notably, the roles of LCZ7 (lightweight low-rise buildings), LCZA, and LCZG as cold/heat sources changed significantly during daytime and nighttime. A pronounced SUHI gradient effect was observed in the central urban area of Tianjin, with the SUHI intensity negatively correlated with the distance from the urban center, building height, and building density. The Moran’s I of the SUHI effect was 0.70 during daytime and 0.84 during nighttime, indicating that the SUHI effect exhibited stronger spatial aggregation and gradient effect during nighttime. Overall, by analyzing the diurnal dynamic changes of the SUHI effect and the contributions of various LCZs to the SUHI effect, this study reduces the errors associated with previous analyses that rely solely on fixed-time images. It provides a novel insight into understanding urban planning and sustainable development policies. Moreover, this study can be referenced for alleviating the SUHI effect and improving the livability and sustainable development of cities.
表1 ECOSTRESS数据获取时间Tab.1 Acquisition times of ECOSTRESS data |
| 北京 时刻 | 北京日期 | ECOSTRESS 影像时刻 (UTC) | ECOSTRESS 影像日期 (UTC) | 昼夜 |
|---|---|---|---|---|
| 00:54 | 2022年05月22日 | 16:54 | 2022年05月21日 | 夜间 |
| 04:11 | 2020年07月15日 | 20:11 | 2020年07月14日 | 夜间 |
| 08:00 | 2023年06月15日 | 00:00 | 2023年06月15日 | 日间 |
| 09:30 | 2019年09月02日 | 01:30 | 2019年09月02日 | 日间 |
| 10:14 | 2022年08月10日 | 02:14 | 2022年08月10日 | 日间 |
| 18:19 | 2023年07月19日 | 10:19 | 2023年07月19日 | 日间 |
| 21:43 | 2022年05月29日 | 13:43 | 2022年05月29日 | 夜间 |
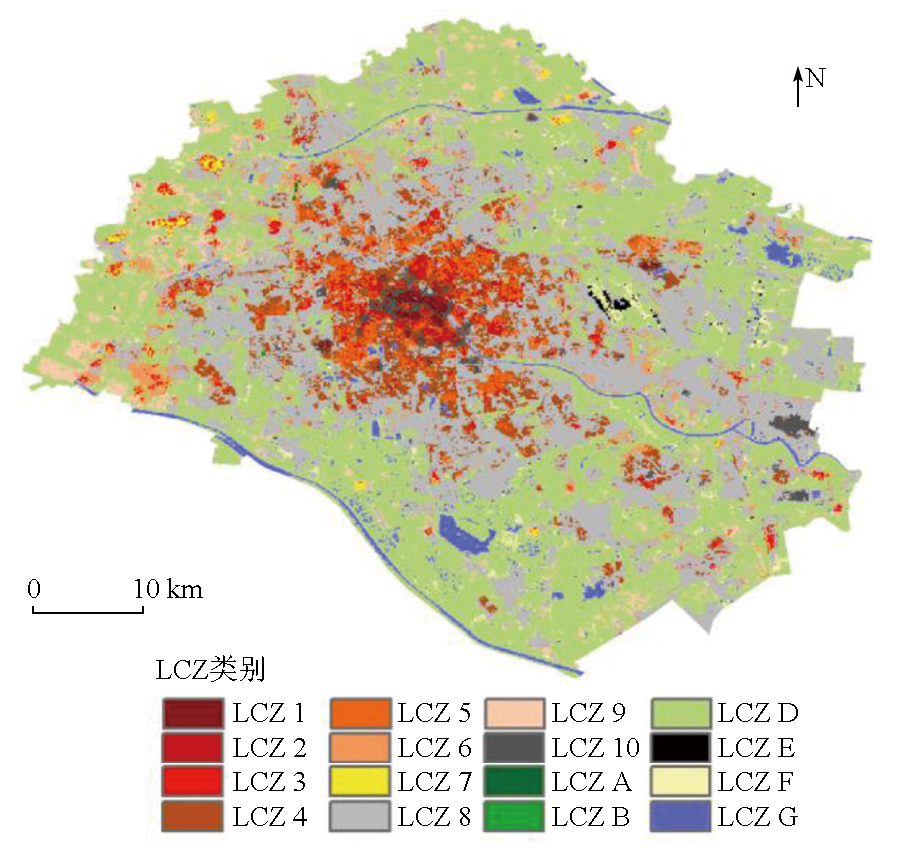
表2 局地气候区定义Tab.2 Local climate zone definition |
| 建成景观 | 描述 | 自然景观 | 描述 |
|---|---|---|---|
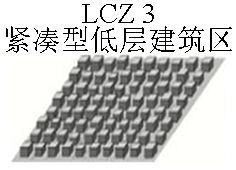
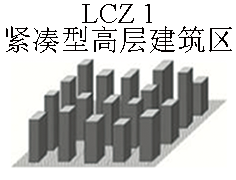 | 高密度的高层建筑(>10层),少或无绿地。 | 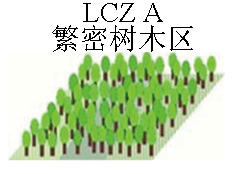 | 高密度树木,土地覆盖多为低矮植物。 |
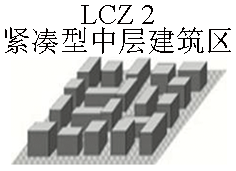 | 高密度的中层建筑(3~9层),少或无绿地。 | 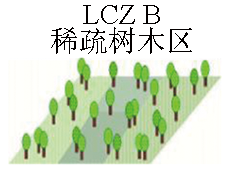 | 低密度林地,地表覆盖多为低矮植被。 |
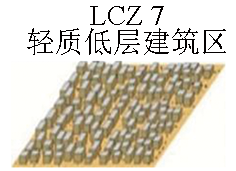
 | 高密度的低层建筑(1~3层),少或无绿地。 | 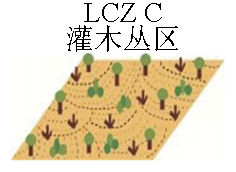 | 灌木和矮小树木开放排列。土地覆盖多为裸露土壤或沙子。 |
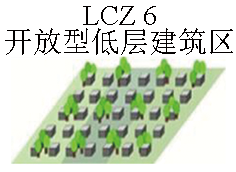
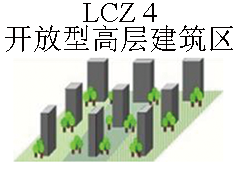 | 低密度的高层建筑(>10层),丰富的树木和植被。 |  | 草或草本植物、农作物的无特征景观,很少或没有树木。 |
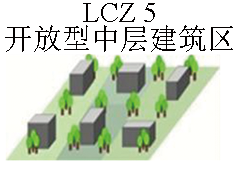 | 低密度的中层建筑(3~9层),丰富的树木和植被。 | 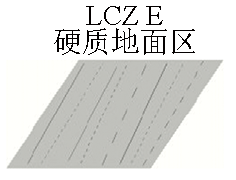 | 岩石或铺砌覆盖物的无特色景观。很少或没有植被。 |
 | 低密度的低层建筑(1~3层),丰富的树木和植被。 | 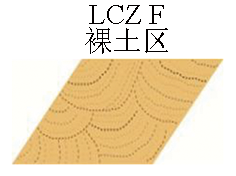 | 土壤或沙子覆盖的无特征景观。很少或没有树木或植物。 |
 | 高密度单层建筑(1~2层),少树木,地表覆盖多为硬土。 | 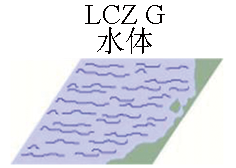 | 大型、开放的水体区域,如海洋、湖泊、河流、水库等。 |
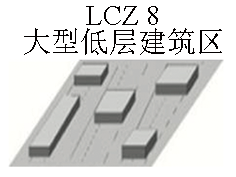 | 低密度的大型低层建筑(1~3层),几乎没有树木,地表覆盖多为硬化地面。 | ||
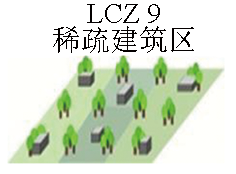 | 低密度的中小型建筑,丰富的植被。 | ||
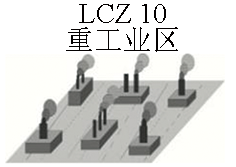 | 中低层重工业建筑(塔、罐、烟囱),少树木,地表覆盖多为硬化地面。 |
表3 SUHI等级划分标准Tab.3 Classification standards for surface urban heat island levels |
| 等级 | 划分标准 | 等级 | 划分标准 |
|---|---|---|---|
| 强冷岛 | SUHI<-5 | 弱热岛 | $1\le SUHI<3$ |
| 较强冷岛 | $-5\le SUHI<-3$ | 较强热岛 | $3\le SUHI<5$ |
| 弱冷岛 | $-3\le SUHI<-1$ | 强热岛 | $SUHI\ge 5$ |
| 中温区 | $-1\le SUHI<1 $ |
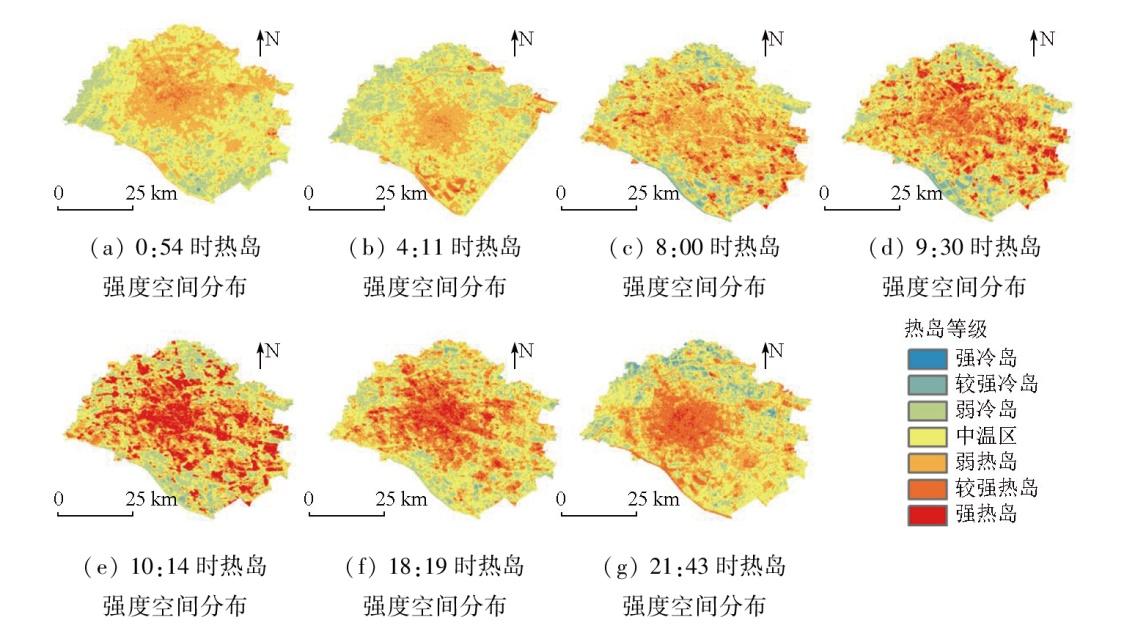
图3 不同时刻热岛强度空间分布Fig.3 Spatial distribution of urban heat island intensity at different times |
表4 不同时刻各等级热岛占比Tab.4 Proportion of each urban heat island level at different times (%) |
| 时间 | 强冷岛 | 较强 冷岛 | 弱冷岛 | 中温区 | 弱热岛 | 较强 热岛 | 强热岛 |
|---|---|---|---|---|---|---|---|
| 0:54 | 0.06 | 0.47 | 16.20 | 44.76 | 35.37 | 3.10 | 0.04 |
| 4:11 | 0.01 | 0.47 | 21.82 | 45.60 | 27.86 | 4.17 | 0.08 |
| 8:00 | 0.01 | 2.37 | 13.76 | 32.50 | 38.20 | 10.70 | 2.46 |
| 9:30 | 0.01 | 2.66 | 14.42 | 28.78 | 30.76 | 16.52 | 6.85 |
| 10:14 | 0.00 | 0.67 | 16.87 | 26.48 | 22.03 | 14.79 | 19.14 |
| 18:19 | 0.01 | 0.86 | 13.42 | 32.26 | 26.95 | 20.60 | 5.90 |
| 21:43 | 0.29 | 3.44 | 14.50 | 34.31 | 28.79 | 17.61 | 1.06 |
表5 天津市中心城区温度空间自相关指数Tab.5 Spatial autocorrelation index of temperature in the central urban area of Tianjin City |
| 时刻 | I值 | Z值 | P值 |
|---|---|---|---|
| 00:54 | 0.96 | 464.24 | <0.01 |
| 04:11 | 0.66 | 345.88 | <0.01 |
| 08:00 | 0.73 | 442.06 | <0.01 |
| 09:30 | 0.76 | 583.45 | <0.01 |
| 10:14 | 0.69 | 792.32 | <0.01 |
| 18:19 | 0.64 | 458.76 | <0.01 |
| 21:43 | 0.90 | 548.91 | <0.01 |
| [1] |
|
| [2] |
|
| [3] |
肖达. 北京市城市热环境的多时间尺度分析研究[D]. 西安: 长安大学, 2021.
|
| [4] |
|
| [5] |
|
| [6] |
|
| [7] |
|
| [8] |
黄群芳. 城市空间形态对城市热岛效应的多尺度影响研究进展[J]. 地理科学, 2021, 41(10):1832-1842.
|
| [9] |
|
| [10] |
|
| [11] |
|
| [12] |
|
| [13] |
|
| [14] |
|
| [15] |
|
| [16] |
|
| [17] |
|
| [18] |
|
| [19] |
|
| [20] |
|
| [21] |
|
| [22] |
|
| [23] |
|
| [24] |
袁博. 城市三维空间形态对地表热环境的影响及热暴露风险评估[D]. 兰州: 兰州交通大学, 2022.
|
| [25] |
|
| [26] |
赵欣, 赵凯旭, 黄晓军. 基于ECOSTRESS地表温度和手机信令数据的城市人口热环境暴露风险评价——以西安市为例[J]. 地理科学进展, 2022, 41(11):2061-2072.
|
| [27] |
|
| [28] |
|
| [29] |
|
| [30] |
|
| [31] |
彭敏, 姚娜, 孙培蕾, 等. 基于ECOSTRESS的城市热环境昼夜空间特征分析[J]. 测绘通报, 2024(6):151-156,181.
|
| [32] |
|
| [33] |
|
| [34] |
|
| [35] |
|
| [36] |
伍肖肖. 城市绿地对热岛效应的缓解作用及其优化策略研究——以贵阳市主城区为例[D]. 贵阳: 贵州师范大学, 2024.
|
| [37] |
张沁, 张守平, 杨清伟. 山地新城市化进程的热岛效应时空演变特性研究[J]. 中国农业大学学报, 2024, 29(10):290-304.
|
| [38] |
何苗. 基于多源遥感的北京城市高温热浪风险评估[D]. 南京: 南京信息工程大学, 2019.
|
| [39] |
|
| [40] |
王杉. 基于LCZ的长三角城市群热岛的时空特征及规划对策研究[D]. 杭州: 浙江大学, 2023.
|
| [41] |
张策, 吕王勇, 张萍, 等. 基于Moran’s I的多变量空间自相关研究与应用[J]. 四川师范大学学报(自然科学版), 2024, 47(6):818-829.
|
| [42] |
|
| [43] |
|
| [44] |
刘晓娟. 城市发展对生物多样性的影响研究——以中国鸟类多样性为例[D]. 上海: 华东师范大学, 2024.
|
| [45] |
方云皓, 顾康康, 马晴. 基于多源数据的城市通风廊道构建及效能评估研究——以合肥市主城区为例[J]. 地理科学进展, 2024, 43(8):1597-1608.
|
| [46] |
|
| [47] |
|
/
| 〈 |
|
〉 |