
基于RSEI模型的滇西北高山峡谷区生态环境质量动态监测及驱动因子分析
|
张 萍(1996-),女,硕士研究生,从事GIS应用、遥感信息提取与生态遥感研究。Email:2437174233@qq.com。 |
Copy editor: 陈昊旻
收稿日期: 2024-10-08
修回日期: 2025-03-17
网络出版日期: 2026-06-03
基金资助
中国地质调查局地质调查项目“三江源及周边地区生态修复综合调查(昆明中心)”(DD20230467)
“滇西北高山峡谷区生态修复综合调查”(DD20230483)
Dynamic monitoring and driving factor analysis for eco-environmental quality in alpine gorges of northwest Yunnan based on a remote sensing ecological index model
Received date: 2024-10-08
Revised date: 2025-03-17
Online published: 2026-06-03
张萍 , 庞咏 , 陈庆松 , 杨坤 , 邹祖建 , 侯云花 , 王彩琼 , 冯思齐 . 基于RSEI模型的滇西北高山峡谷区生态环境质量动态监测及驱动因子分析[J]. 自然资源遥感, 2025 , 37(5) : 243 -253 . DOI: 10.6046/zrzyyg.2024316
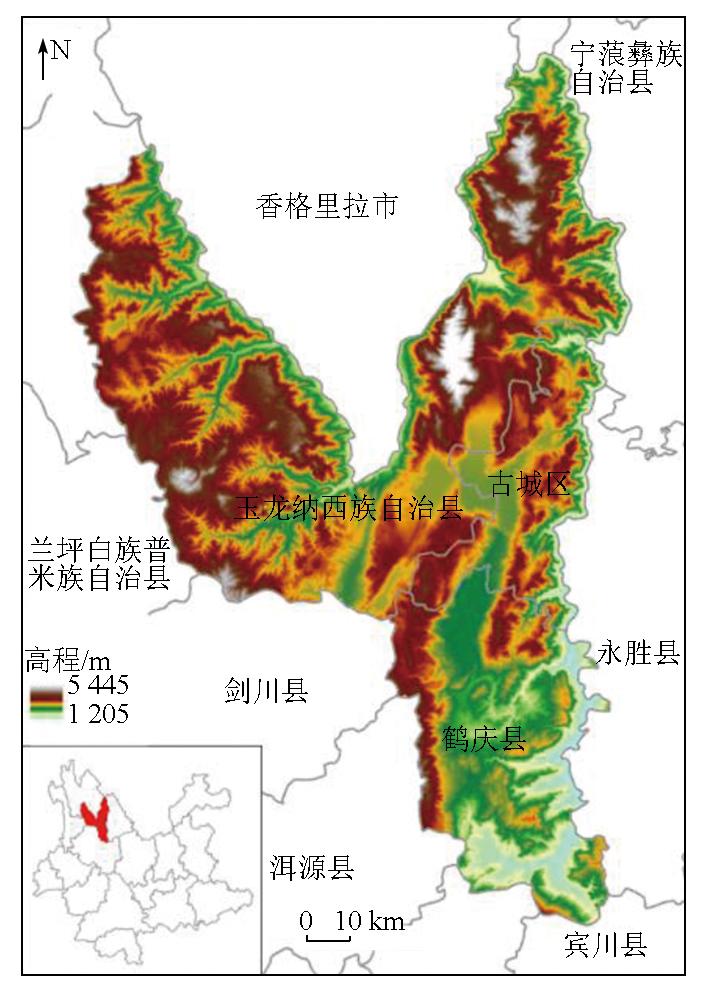
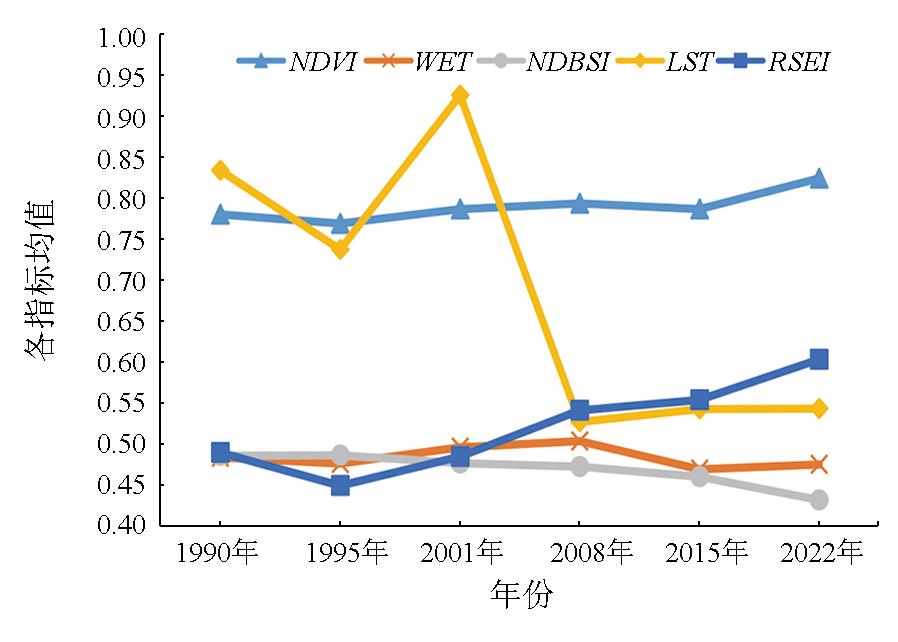
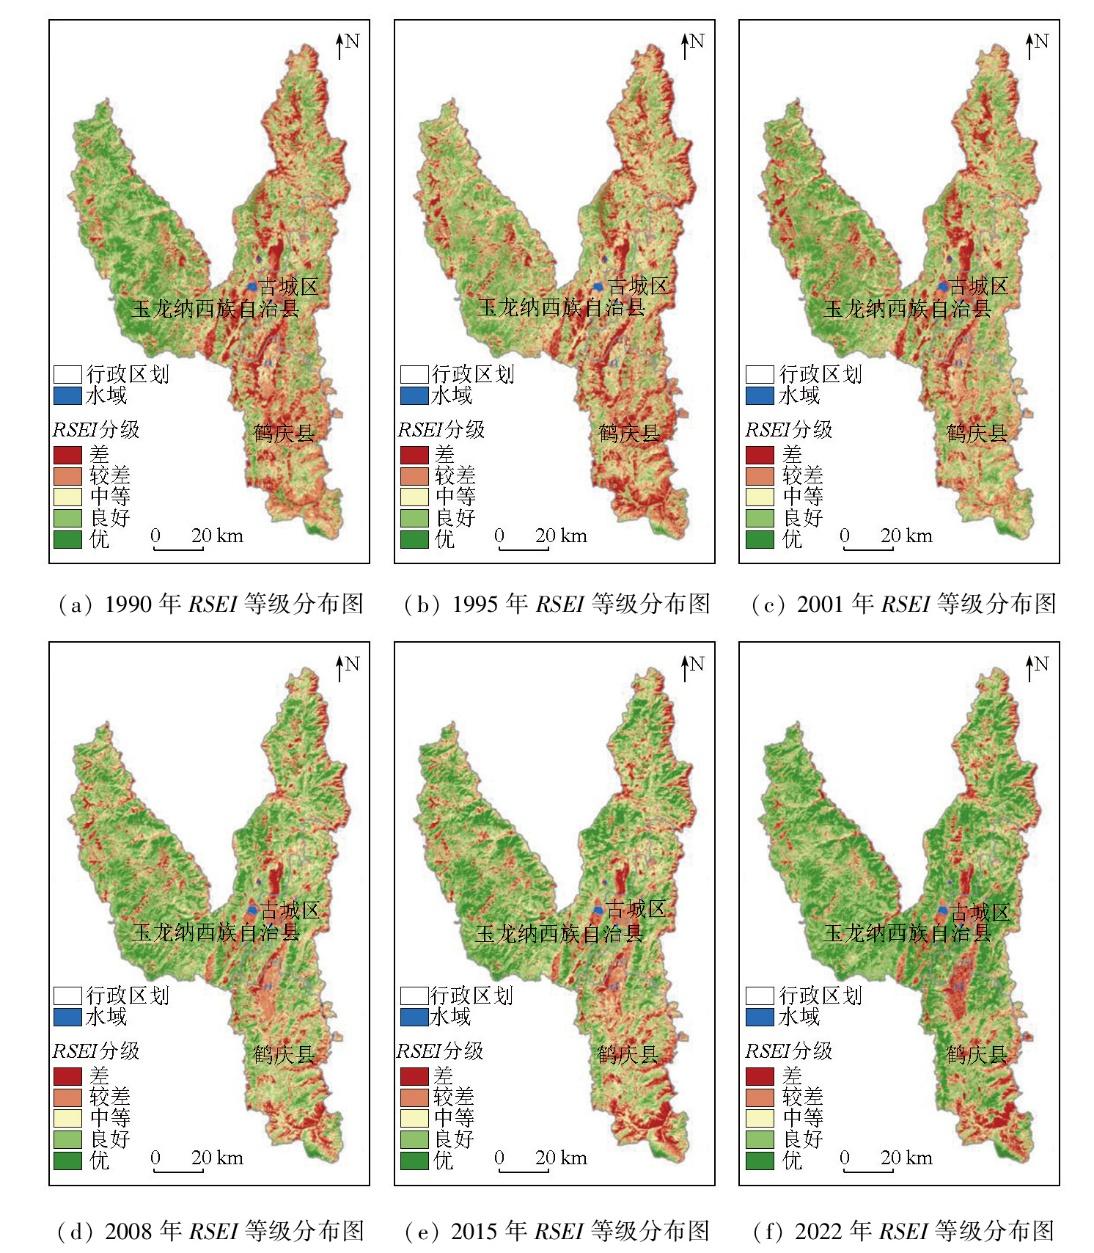
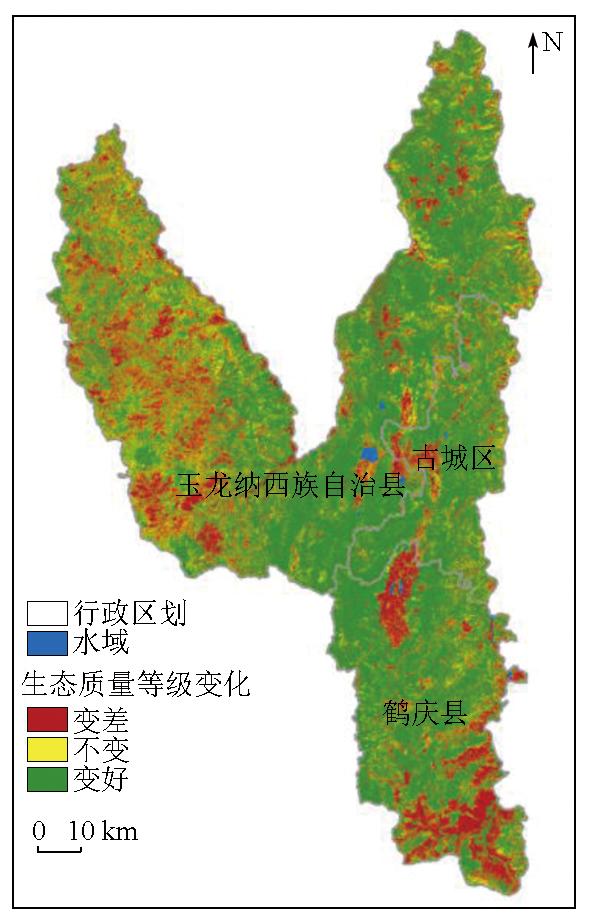
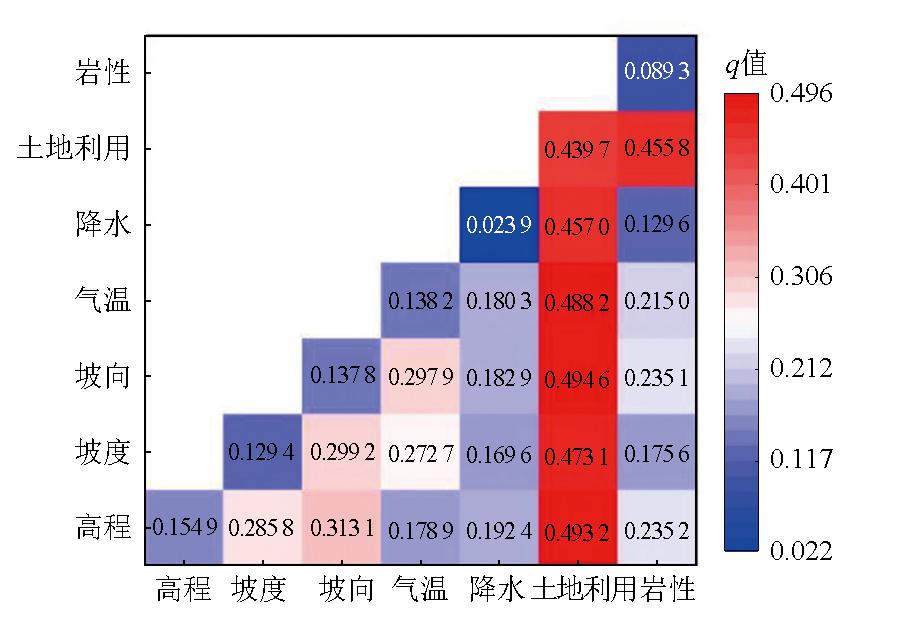
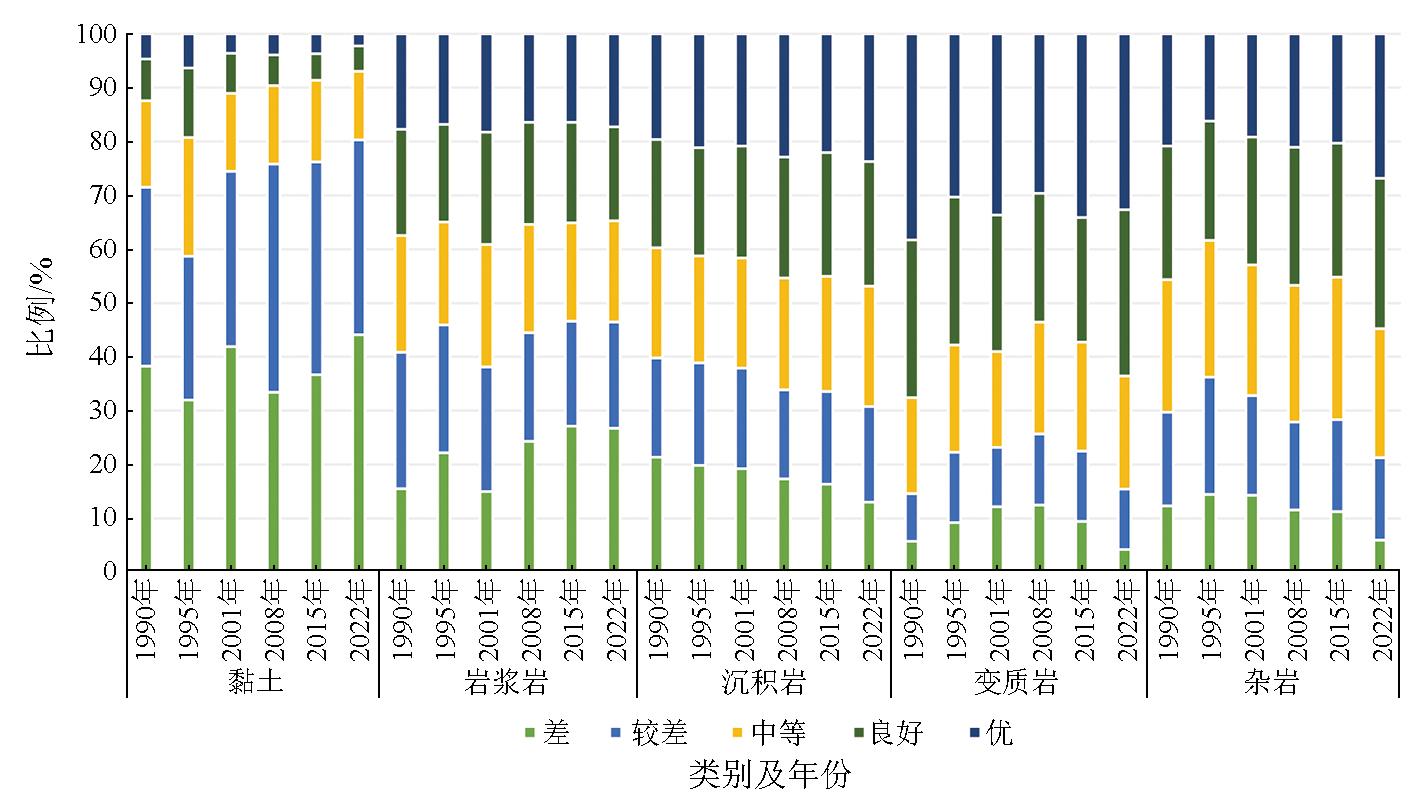
The alpine gorges in northwest Yunnan,important ecological reserves in China,are facing increasingly prominent environmental problems due to accelerated urbanization. Insights into the spatiotemporal changes in eco-environmental quality are of great significance for eco-environmental protection and construction in the alpine gorges of Northwest Yunnan. This study selected Landsat TM/OLI remote sensing images from 1990,1995,2001,2008,2015,and 2022 as the data source to extract four ecological indices:normalized difference vegetation Index (NDVI),wetness (WET),normalized difference bare soil index (NDBSI),and land surface temperature (LST). Consequently,a remote sensing ecological index (RSEI) was constructed to assess and monitor the eco-environmental quality of the alpine gorges in northwest Yunnan from 1990 to 2022. The results indicate that from 1990 to 2022,the average RSEI in the study area showed a trend of an initial decline followed by an increase. Specifically,the RSEI reached its lowest value of 0.450 in 1995 and then increased continuously from 0.450 in 1995 to 0.604 in 2022. Over this period,the proportion of areas with excellent and good eco-environmental quality increased by 22.03%,while those classified as poor and very poor eco-environmental quality decreased by 14.49%. These variations were predominantly composed of improvements,covering 62.42% of the study area. Spatially,areas with very poor quality were primarily concentrated in agricultural areas,urban construction land,along the Jinsha River,low-altitude areas with sparse vegetation,and the slopes of landform intermontane basins (Bazi) in Heqing County. In contrast,areas with excellent quality were mainly distributed in high-altitude mountainous regions characterized by lush vegetation and minimal human disturbance. Moreover,the land use type was identified as the main driving factor influencing the eco-environmental quality in the study area. The strongest interaction was observed between elevation (X1) and land use (X6),exerting the greatest impacts on eco-environmental quality in the study area. Besides,areas with clay soils were dominated by poor and very poor quality. The magmatic rock areas displayed a clear trend of ecological deterioration,while the sedimentary rock area presented significant improvements. Conversely,the metamorphic and complex rock areas maintained relative stability.
表1 数据类型及来源Tab.1 Data type and source |
| 数据类型 | 数据时期 | 分辨率/m | 数据来源 |
|---|---|---|---|
| 年均降水量 | 1990—2022年 | 1 000 | 国家地球系统科学数据中心(https://www.geodata.cn) |
| 年均气温 | 1990—2022年 | 1 000 | 国家地球系统科学数据中心(https://www.geodata.cn) |
| 高程 | 2019年 | 30 | 欧洲航天局(European Space Agency,ESA) |
| 坡度 | — | 30 | 由DEM提取得到 |
| 坡向 | — | 30 | 由DEM提取得到 |
| 土地利用 | 1990—2022年 | 30 | https://zenodo.org/ |
| 1∶25万 地质图 | — | — | 云南省测绘资料档案馆(云南省基础地理信息中心) |
表2 不同年份各生态指标主成分载荷值与贡献率Tab.2 Principal component loadings and contribution rates of various ecological indicators in different years |
| 年份 | 指标 | NDVI | WET | NDBSI | LST | 特征值 | 贡献率/% |
|---|---|---|---|---|---|---|---|
| 1990年 | PC1 | -0.733 019 | -0.675 479 | 0.080 012 | -0.002 920 | 0.017 3 | 76.24 |
| PC2 | -0.268 505 | 0.183 089 | -0.904 060 | 0.277 595 | 0.003 9 | 17.05 | |
| PC3 | 0.622 254 | -0.713 416 | -0.321 146 | 0.026 516 | 0.001 4 | 6.11 | |
| PC4 | 0.058 204 | -0.035 280 | 0.270 440 | 0.960 328 | 0.000 1 | 0.60 | |
| 1995年 | PC1 | -0.693 931 | -0.704 739 | 0.143 292 | -0.035 632 | 0.019 4 | 65.37 |
| PC2 | -0.251 984 | 0.124 664 | -0.389 030 | 0.877 279 | 0.005 9 | 19.79 | |
| PC3 | 0.626 182 | -0.691 483 | -0.336 319 | 0.128 981 | 0.003 6 | 12.25 | |
| PC4 | 0.250 717 | -0.098 249 | 0.845 584 | 0.460 951 | 0.000 8 | 2.59 | |
| 2001年 | PC1 | -0.716 393 | -0.691 728 | 0.088 302 | 0.022 252 | 0.015 9 | 77.99 |
| PC2 | -0.271 631 | 0.178 840 | -0.886 031 | 0.330 426 | 0.003 2 | 15.70 | |
| PC3 | 0.638 512 | -0.699 655 | -0.315 282 | 0.058 156 | 0.001 1 | 5.52 | |
| PC4 | 0.072 801 | -0.003 198 | 0.328 250 | 0.941 776 | 0.000 2 | 0.79 | |
| 2008年 | PC1 | 0.621 550 | 0.463 497 | -0.630 783 | -0.030 969 | 0.020 7 | 66.68 |
| PC2 | 0.257 623 | -0.146 374 | 0.099 662 | 0.949 880 | 0.006 0 | 19.23 | |
| PC3 | -0.530 956 | -0.318 177 | -0.765 585 | 0.175 300 | 0.003 8 | 12.29 | |
| PC4 | -0.515 162 | 0.813 946 | 0.077 846 | 0.256 980 | 0.000 6 | 1.80 | |
| 2015年 | PC1 | 0.624 463 | 0.641 042 | -0.443 251 | 0.051 381 | 0.020 8 | 65.23 |
| PC2 | 0.177 633 | -0.089 233 | 0.231 590 | 0.952 287 | 0.007 4 | 23.14 | |
| PC3 | -0.473 379 | -0.132 025 | -0.825 767 | 0.276 751 | 0.003 4 | 10.57 | |
| PC4 | -0.595 319 | 0.750 781 | 0.260 776 | 0.117 979 | 0.000 3 | 1.06 | |
| 2022年 | PC1 | 0.707 173 | 0.407 722 | -0.577 196 | 0.022 692 | 0.019 9 | 68.28 |
| PC2 | 0.155 665 | -0.032 550 | 0.205 687 | 0.965 609 | 0.005 8 | 19.96 | |
| PC3 | -0.522 730 | -0.220 301 | -0.786 452 | 0.244 367 | 0.003 2 | 11.09 | |
| PC4 | -0.449 921 | 0.885 534 | 0.077 664 | 0.085 839 | 0.000 2 | 0.67 |
表3 1990—2022年研究区不同生态环境质量等级面积和占比统计Tab.3 Statistics of area and proportion of different ecological environment quality grades in the study area from 1990 to 2022 |
| RSEI | 1990年 | 1995年 | 2001年 | 2008年 | 2015年 | 2022年 | ||||||
|---|---|---|---|---|---|---|---|---|---|---|---|---|
| 面积/km2 | 占比/% | 面积/km2 | 占比/% | 面积/km2 | 占比/% | 面积/km2 | 占比/% | 面积/km2 | 占比/%/ | 面积/km2 | 占比/% | |
| 差 | 1 449.33 | 14.75 | 1 726.05 | 17.57 | 1 313.17 | 13.37 | 852.63 | 8.68 | 880.38 | 8.96 | 825.95 | 8.41 |
| 较差 | 2 274.26 | 23.15 | 2 340.74 | 23.83 | 2 121.28 | 21.60 | 1 792.07 | 18.24 | 1 923.64 | 19.58 | 1 474.42 | 15.01 |
| 中等 | 2 391.87 | 24.35 | 2 733.98 | 27.83 | 2 437.65 | 24.82 | 2 369.45 | 24.12 | 2 359.77 | 24.02 | 1 651.31 | 16.81 |
| 良好 | 2 367.18 | 24.10 | 2 428.64 | 24.72 | 2 838.56 | 28.90 | 3 243.93 | 33.02 | 2 970.30 | 30.24 | 3 205.67 | 32.63 |
| 优 | 1 340.19 | 13.64 | 593.43 | 6.04 | 1 112.18 | 11.32 | 1 564.75 | 15.93 | 1 688.75 | 17.19 | 2 665.49 | 27.14 |
表4 研究区各时期生态环境质量变化统计表Tab.4 Statistical table of changes in ecological environment quality in various periods of the study area |
| 时间 | 类别 | 情况 | 级差 | 级面积/km2 | 占比/% | 类面积/km2 | 占比/% |
|---|---|---|---|---|---|---|---|
| 1990—1995年 | 变差 | 显著变差 | -3 | 374.94 | 3.82 | 4 502.79 | 45.84 |
| 明显变差 | -2 | 1 189.09 | 12.11 | ||||
| 略微变差 | -1 | 2 938.76 | 29.92 | ||||
| 不变 | 无明显变化 | 0 | 3 292.22 | 33.52 | 3 292.22 | 33.52 | |
| 变好 | 略微变好 | 1 | 1 356.62 | 13.81 | 2 027.83 | 20.64 | |
| 明显变好 | 2 | 480.61 | 4.89 | ||||
| 显著变好 | 3 | 190.60 | 1.94 | ||||
| 时间 | 类别 | 情况 | 级差 | 级面积/km2 | 占比/% | 类面积/km2 | 占比/% |
| 1995—2001年 | 变差 | 显著变差 | -3 | 215.70 | 2.20 | 1 787.01 | 18.19 |
| 明显变差 | -2 | 492.72 | 5.02 | ||||
| 略微变差 | -1 | 1 078.59 | 10.98 | ||||
| 不变 | 无明显变化 | 0 | 2 975.98 | 30.30 | 2 975.98 | 30.30 | |
| 变好 | 略微变好 | 1 | 3 188.69 | 32.46 | 5 059.85 | 51.51 | |
| 明显变好 | 2 | 1 576.49 | 16.05 | ||||
| 显著变好 | 3 | 294.67 | 3.00 | ||||
| 2001—2008年 | 变差 | 显著变差 | -3 | 106.47 | 1.08 | 2 060.14 | 20.97 |
| 明显变差 | -2 | 466.05 | 4.74 | ||||
| 略微变差 | -1 | 1 487.62 | 15.14 | ||||
| 不变 | 无明显变化 | 0 | 2 888.91 | 29.41 | 2 888.91 | 29.41 | |
| 变好 | 略微变好 | 1 | 2 846.38 | 28.98 | 4 873.79 | 49.62 | |
| 明显变好 | 2 | 1 621.02 | 16.50 | ||||
| 显著变好 | 3 | 406.40 | 4.14 | ||||
| 2008—2015年 | 变差 | 显著变差 | -3 | 153.69 | 1.56 | 2 328.07 | 23.70 |
| 明显变差 | -2 | 422.85 | 4.30 | ||||
| 略微变差 | -1 | 1 751.52 | 17.83 | ||||
| 不变 | 无明显变化 | 0 | 5 000.81 | 50.91 | 5 000.81 | 50.91 | |
| 变好 | 略微变好 | 1 | 2 120.45 | 21.59 | 2 493.96 | 25.39 | |
| 明显变好 | 2 | 326.11 | 3.32 | ||||
| 显著变好 | 3 | 47.40 | 0.48 | ||||
| 2015—2022年 | 变差 | 显著变差 | -3 | 100.56 | 1.02 | 1 299.58 | 13.23 |
| 明显变差 | -2 | 290.16 | 2.95 | ||||
| 略微变差 | -1 | 908.86 | 9.25 | ||||
| 不变 | 无明显变化 | 0 | 3 108.71 | 31.65 | 3 108.71 | 31.65 | |
| 变好 | 略微变好 | 1 | 3 887.83 | 39.58 | 5 414.54 | 55.12 | |
| 明显变好 | 2 | 1 417.94 | 14.44 | ||||
| 显著变好 | 3 | 108.77 | 1.11 |
表5 研究区各时期因子探测结果Tab.5 Results of factor detection in different periods of the study area |
| 驱动因子 | 1990年 | 1995年 | 2001年 | 2008年 | 2015年 | 2022年 | 1990—2022 年平均值 | |||||||
|---|---|---|---|---|---|---|---|---|---|---|---|---|---|---|
| q | 排序 | q | 排序 | q | 排序 | q | 排序 | q | 排序 | q | 排序 | q | 排序 | |
| 高程 | 0.125 8 | 3 | 0.113 7 | 2 | 0.088 8 | 3 | 0.166 7 | 3 | 0.197 6 | 3 | 0.236 5 | 2 | 0.154 9 | 2 |
| 坡度 | 0.129 3 | 2 | 0.064 5 | 5 | 0.120 6 | 2 | 0.131 3 | 5 | 0.146 0 | 5 | 0.184 6 | 4 | 0.129 4 | 5 |
| 坡向 | 0.085 7 | 6 | 0.105 0 | 4 | 0.086 6 | 4 | 0.197 7 | 2 | 0.218 9 | 2 | 0.132 8 | 6 | 0.137 8 | 4 |
| 气温 | 0.120 2 | 4 | 0.109 9 | 3 | 0.074 4 | 5 | 0.141 7 | 4 | 0.180 5 | 4 | 0.202 2 | 3 | 0.138 2 | 3 |
| 降水 | 0.016 8 | 7 | 0.011 7 | 7 | 0.017 9 | 7 | 0.017 3 | 7 | 0.041 8 | 7 | 0.038 0 | 7 | 0.023 9 | 7 |
| 土地利用 | 0.398 5 | 1 | 0.339 4 | 1 | 0.387 9 | 1 | 0.486 5 | 1 | 0.470 5 | 1 | 0.555 4 | 1 | 0.439 7 | 1 |
| 岩性 | 0.086 6 | 5 | 0.035 8 | 6 | 0.070 7 | 6 | 0.083 7 | 6 | 0.102 4 | 6 | 0.156 8 | 5 | 0.089 3 | 6 |
图6 不同年份不同地层单元的生态环境质量空间分布情况Fig.6 Spatial distribution of ecological environment quality in different geological units in different years |
表6 1990—2022年研究区不同岩性生态环境质量变化情况Tab.6 Changes in ecological environment quality of different lithologies in the study area from 1990 to 2022 (%) |
| 岩性 | 恶化 | 不变 | 改善 |
|---|---|---|---|
| 黏土 | 19.24 | 10.17 | 6.32 |
| 岩浆岩 | 24.24 | 19.17 | 18.46 |
| 沉积岩 | 40.61 | 49.75 | 62.47 |
| 变质岩 | 12.83 | 17.77 | 9.70 |
| 杂岩 | 1.86 | 2.48 | 2.88 |
表7 1990—2022年研究区不同地层单元生态环境质量变化情况Tab.7 Changes in ecological environment quality of different stratigraphic units in the study area from 1990 to 2022 (%) |
| 地层单元 | 恶化 | 不变 | 改善 | |
|---|---|---|---|---|
| 新生界 | 第四系 | 19.22 | 10.16 | 6.33 |
| 新近系 | 0.05 | 0.07 | 0.08 | |
| 古近系 | 18.90 | 17.58 | 10.32 | |
| 中生界 | 白垩系 | 0.22 | 0.16 | 0.34 |
| 三叠系 | 15.63 | 24.31 | 42.93 | |
| 古生界 | 二叠系 | 19.30 | 14.78 | 17.10 |
| 石炭系 | 0.86 | 1.16 | 0.94 | |
| 泥盆系 | 2.72 | 3.29 | 4.01 | |
| 志留系 | 0.51 | 0.64 | 0.77 | |
| 奥陶系 | 0.53 | 0.56 | 0.37 | |
| 新元古界 | 5.16 | 6.55 | 4.13 | |
| 古元古界 | 7.37 | 10.86 | 5.36 | |
| [1] |
徐燕, 周华荣. 初论我国生态环境质量评价研究进展[J]. 干旱区地理, 2003, 26(2):166-172.
|
| [2] |
田佳良. 区域生态环境质量评价研究综述[J]. 环境保护与循环经济, 2013, 33(11):63-66.
|
| [3] |
|
| [4] |
潘明慧, 袁轶男, 王亚蕾, 等. 基于 RSEI 的福州旗山国家森林公园生态环境质量变化研究[J]. 山东农业大学学报(自然科学版), 2020, 51(1):57-63.
|
| [5] |
范雅慧, 刘英, 衡文静, 等. 基于遥感生态指数的神东矿区 1990—2022 年煤炭开采对生态环境的影响分析[J]. 绿色矿山, 2024, 2(1):41-53.
|
| [6] |
|
| [7] |
杨泽康, 田佳, 李万源, 等. 黄河流域生态环境质量时空格局与演变趋势[J]. 生态学报, 2021, 41(19):7627-7636.
|
| [8] |
李应鑫, 李石华, 彭双云. 云南省九大高原湖泊流域 NDVI 时空演变及其与气候的响应关系[J]. 水土保持研究, 2020, 27(4):192-200.
|
| [9] |
温旭丁, 罗赵慧, 符良刚. 气候与土地利用变化对粤港澳大湾区增强型植被指数时空变化影响[J]. 生态科学, 2023, 42(6):222-232.
|
| [10] |
伍明飞, 林杰. 基于 Landsat 影像的杭州市主城区地表温度和热岛效应研究[J]. 科学技术与工程, 2022, 22(24):10812-10817.
|
| [11] |
徐尚昭, 陈斌, 周阳阳, 等. 矿区植被覆盖度时空变化遥感监测研究——以广东省大宝山矿区为例[J]. 安徽农业科学, 2023, 51(5):46-50.
|
| [12] |
徐涵秋. 城市遥感生态指数的创建及其应用[J]. 生态学报, 2013, 33(24):7853-7862.
|
| [13] |
程琳琳, 王振威, 田素锋, 等. 基于改进的遥感生态指数的北京市门头沟区生态环境质量评价[J]. 生态学杂志, 2021, 40(4):1177-1185.
|
| [14] |
|
| [15] |
|
| [16] |
|
| [17] |
林雪, 季建万, 沙晋明. 大田县近22a环境变化遥感监测研究[J]. 福建师范大学学报(自然科学版), 2018, 34(5):24-31.
|
| [18] |
徐涵秋. 水土流失区生态变化的遥感评估[J]. 农业工程学报, 2013, 29(7):91-97,294.
|
| [19] |
|
| [20] |
|
| [21] |
|
| [22] |
|
| [23] |
王劲峰, 徐成东. 地理探测器:原理与展望[J]. 地理学报, 2017, 72(1):116-134.
|
| [24] |
中华人民共和国环境保护部. 生态环境状况评价技术规范:HJ 192—2015[S]. 北京: 中国环境科学出版社, 2015.
Ministry of Environmental Protection of the People’s Republic of China. Technical specification for ecological environment assessment:HJ 192—2015[S]. Beijing: China Environmental Science Press, 2015.
|
/
| 〈 |
|
〉 |