
MuSyQ,MODIS和GLASS LAI产品在安徽省的对比分析
|
赵 萍(1975-),女,博士,副教授,主要从事资源环境遥感与GIS应用。Email:njuzhp@sina.com。 |
Copy editor: 陈昊旻
收稿日期: 2024-09-02
修回日期: 2024-11-25
网络出版日期: 2026-06-03
基金资助
安徽省自然资源厅公益性地质调查项目“淮南市生态地质调查”(2021-g-2-7)
中国电子科技集团公司第五十四研究所委托项目“航天多源数据语义标签体系设计与知识图谱构建”(HTWB230717201)
Comparative analysis of MuSyQ LAI,MODIS LAI,and GLASS LAI exemplified by Anhui Province
Received date: 2024-09-02
Revised date: 2024-11-25
Online published: 2026-06-03
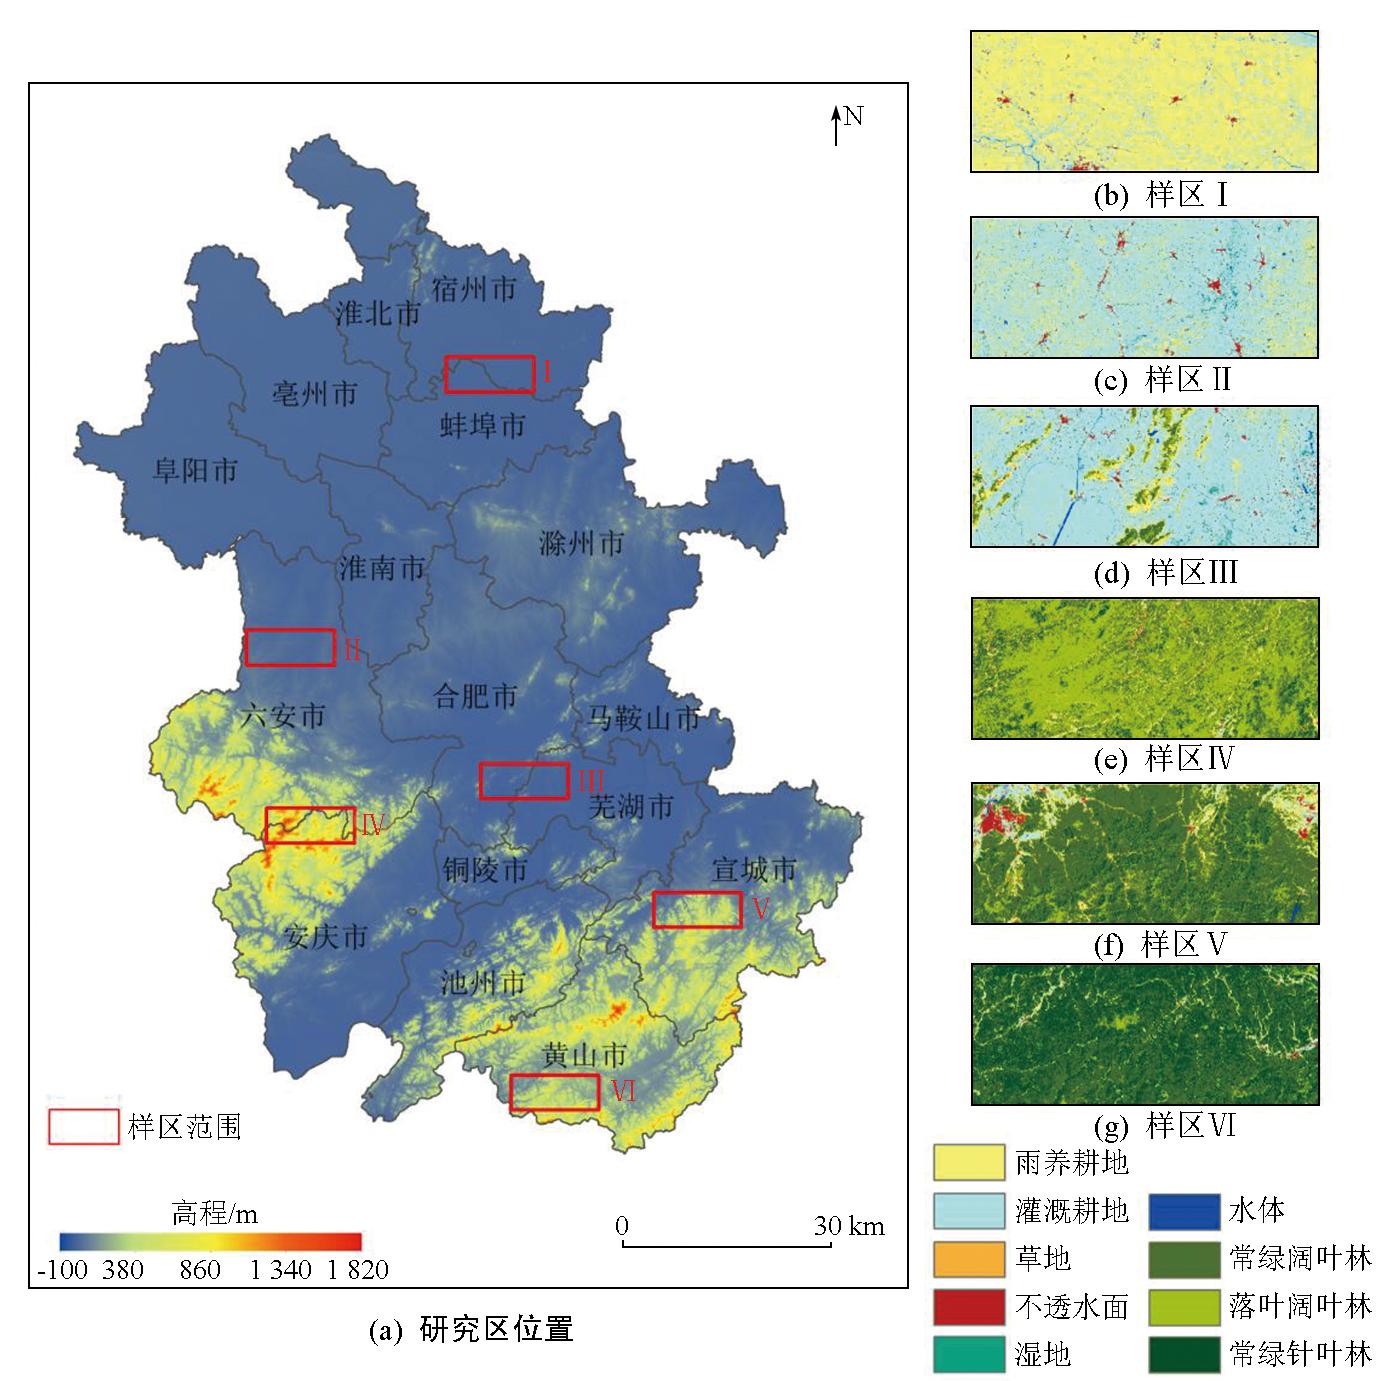
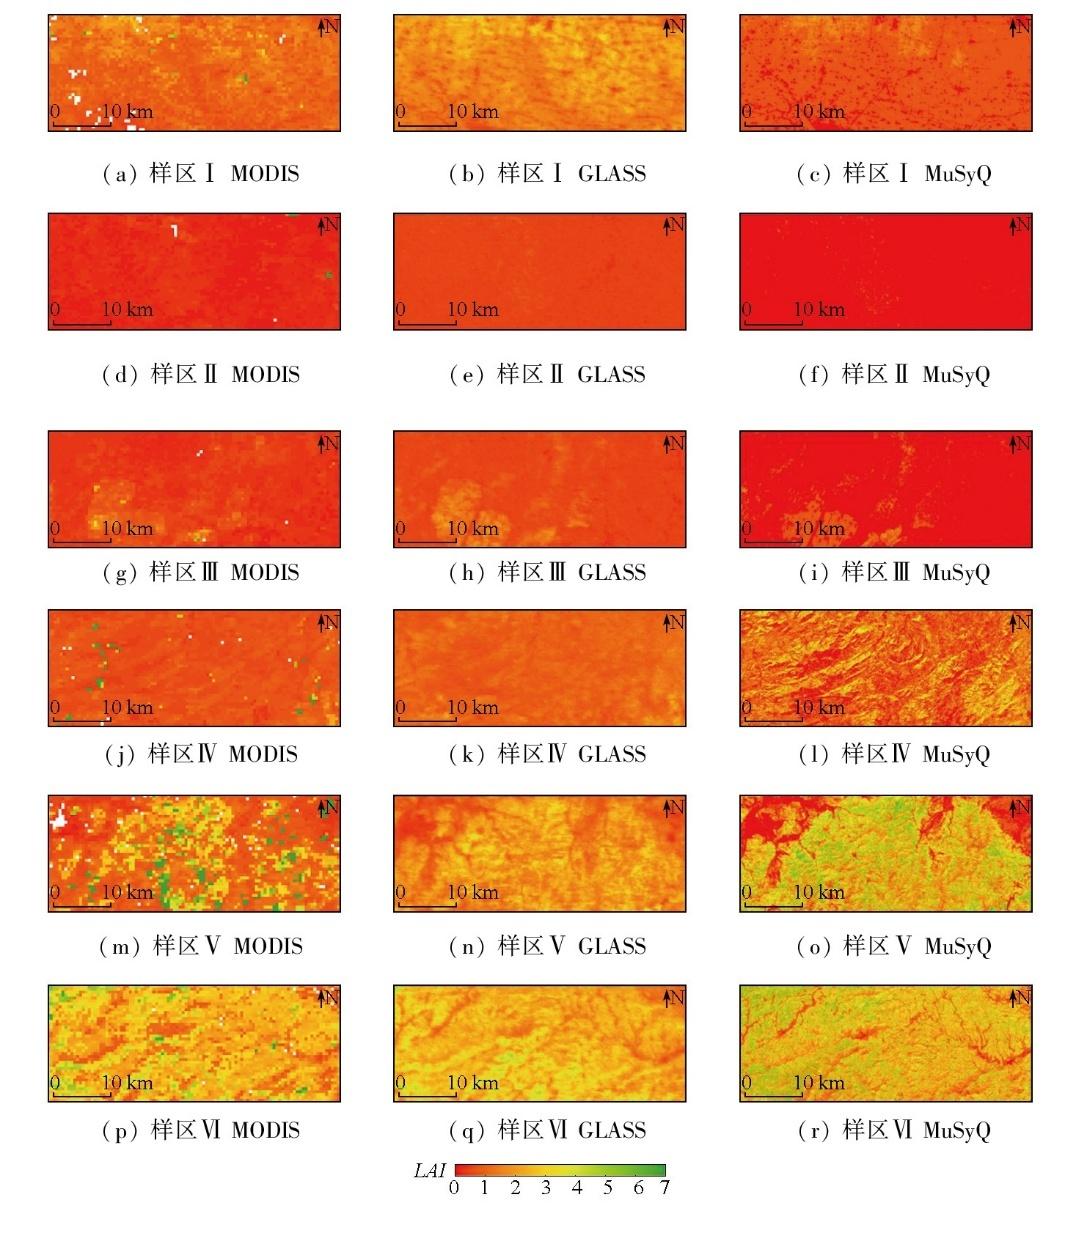
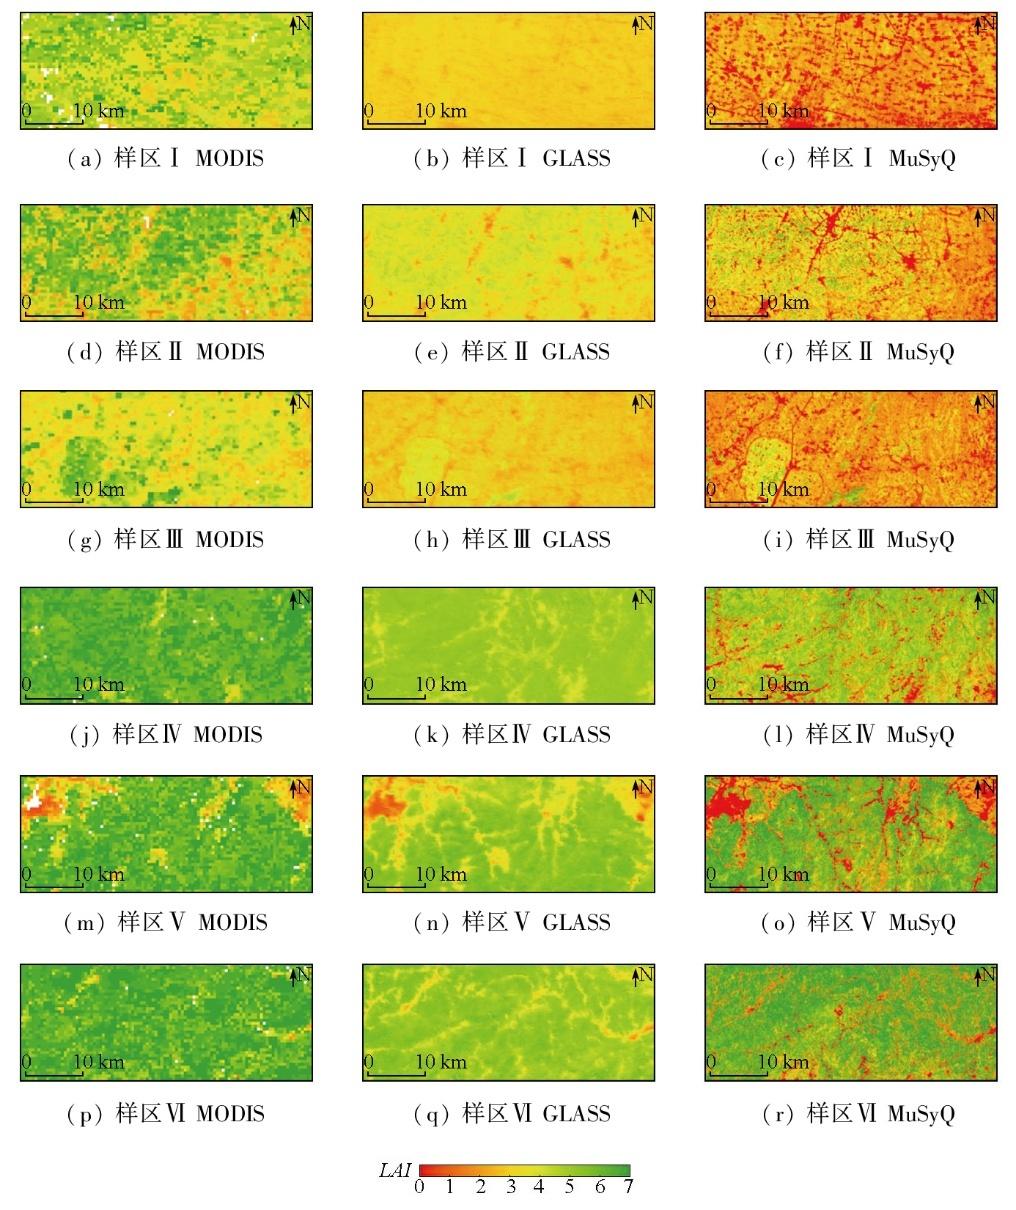
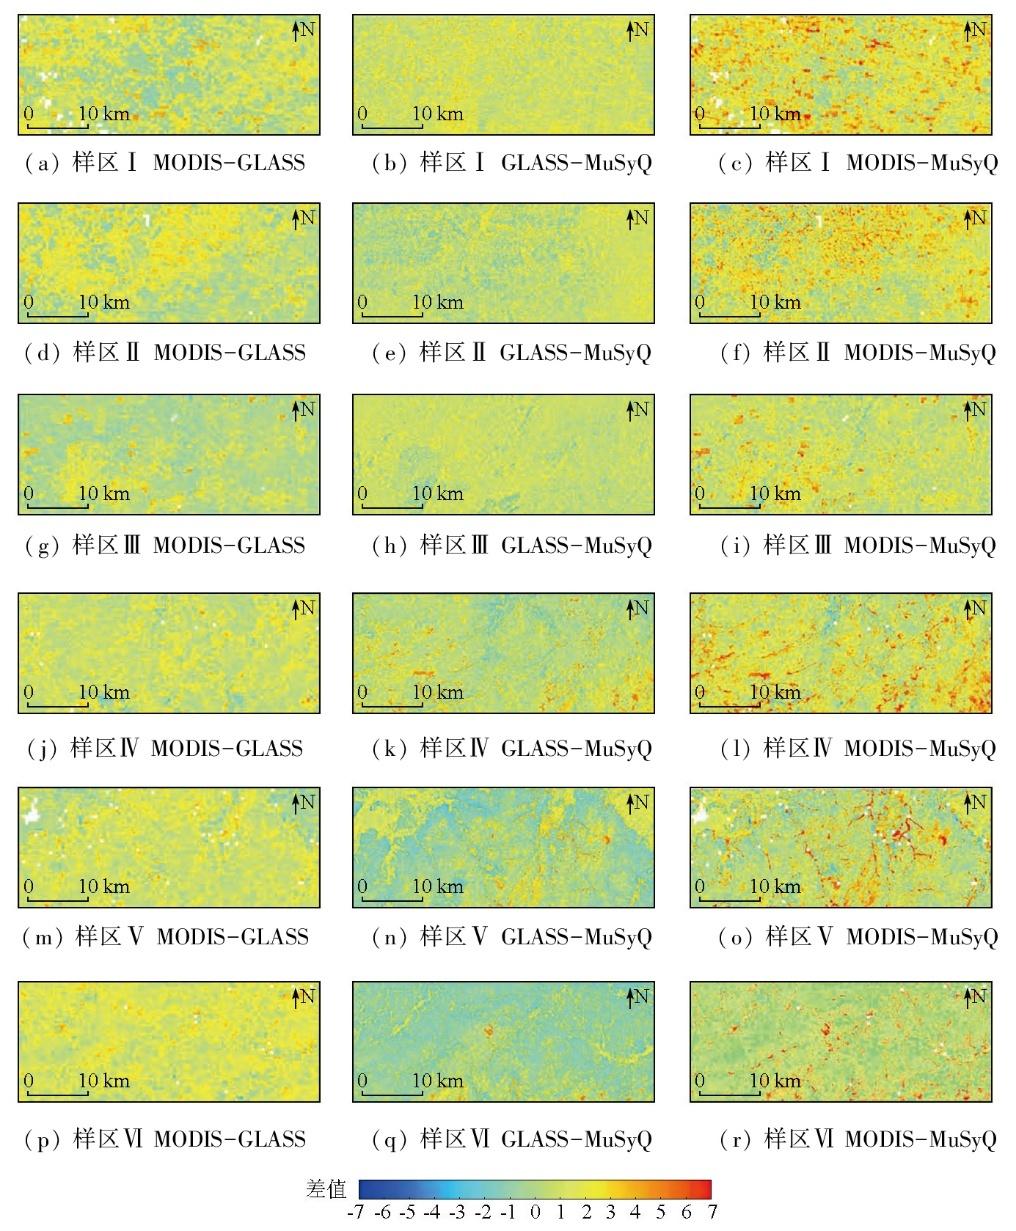
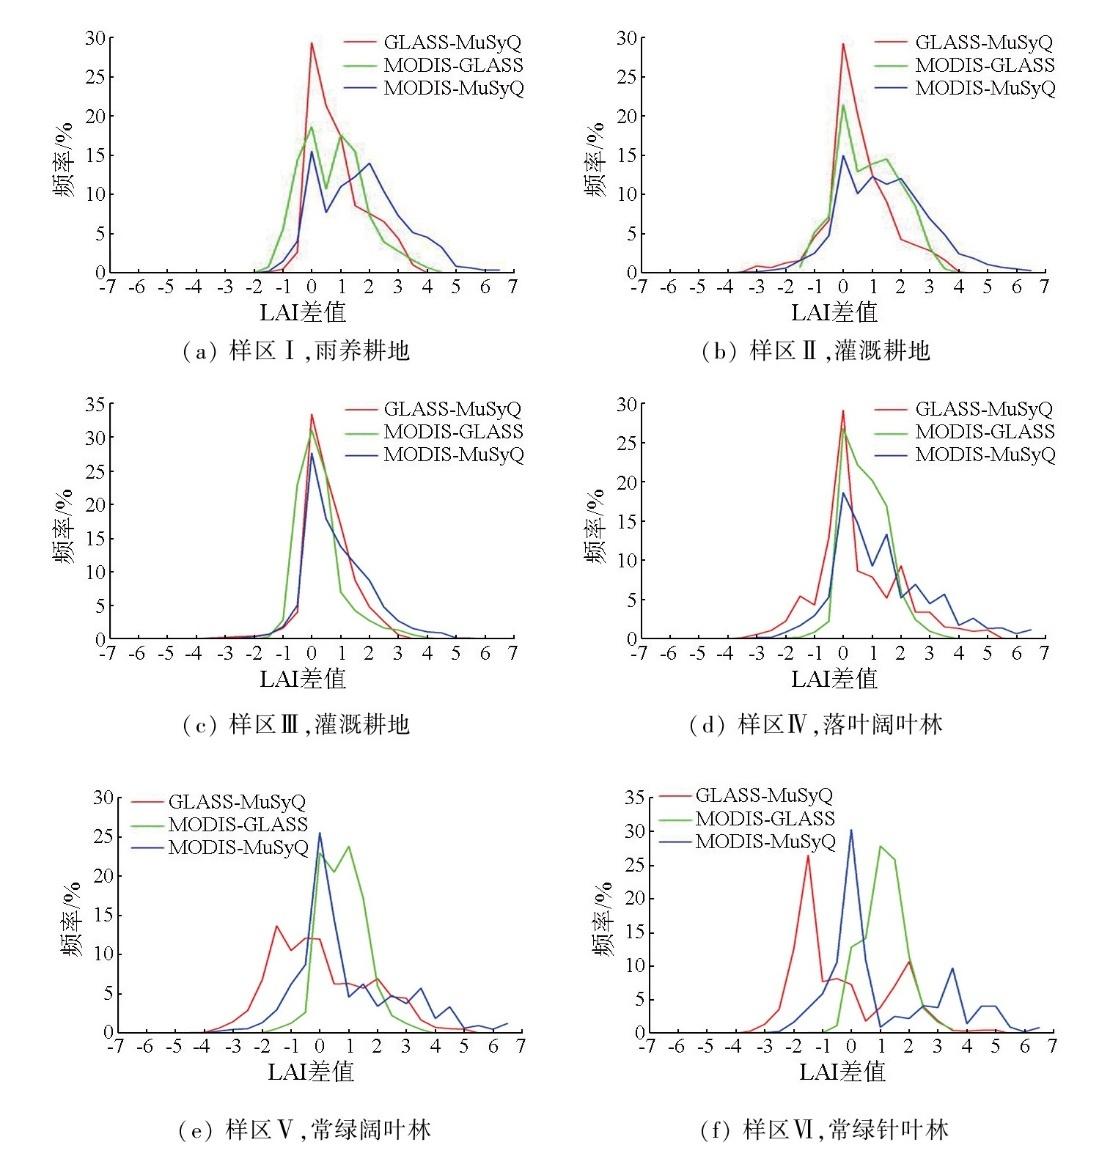
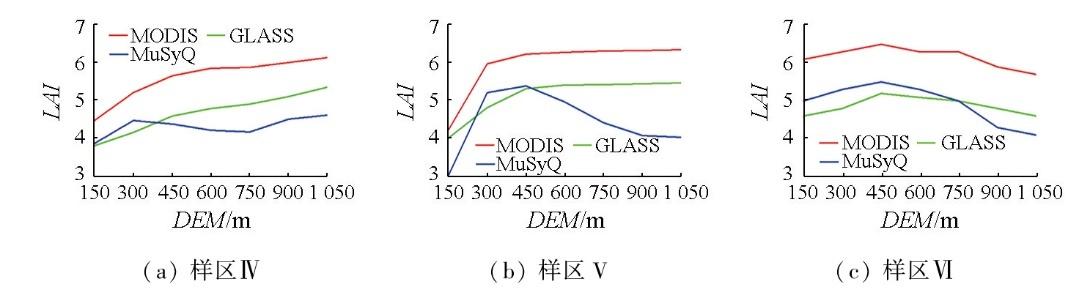
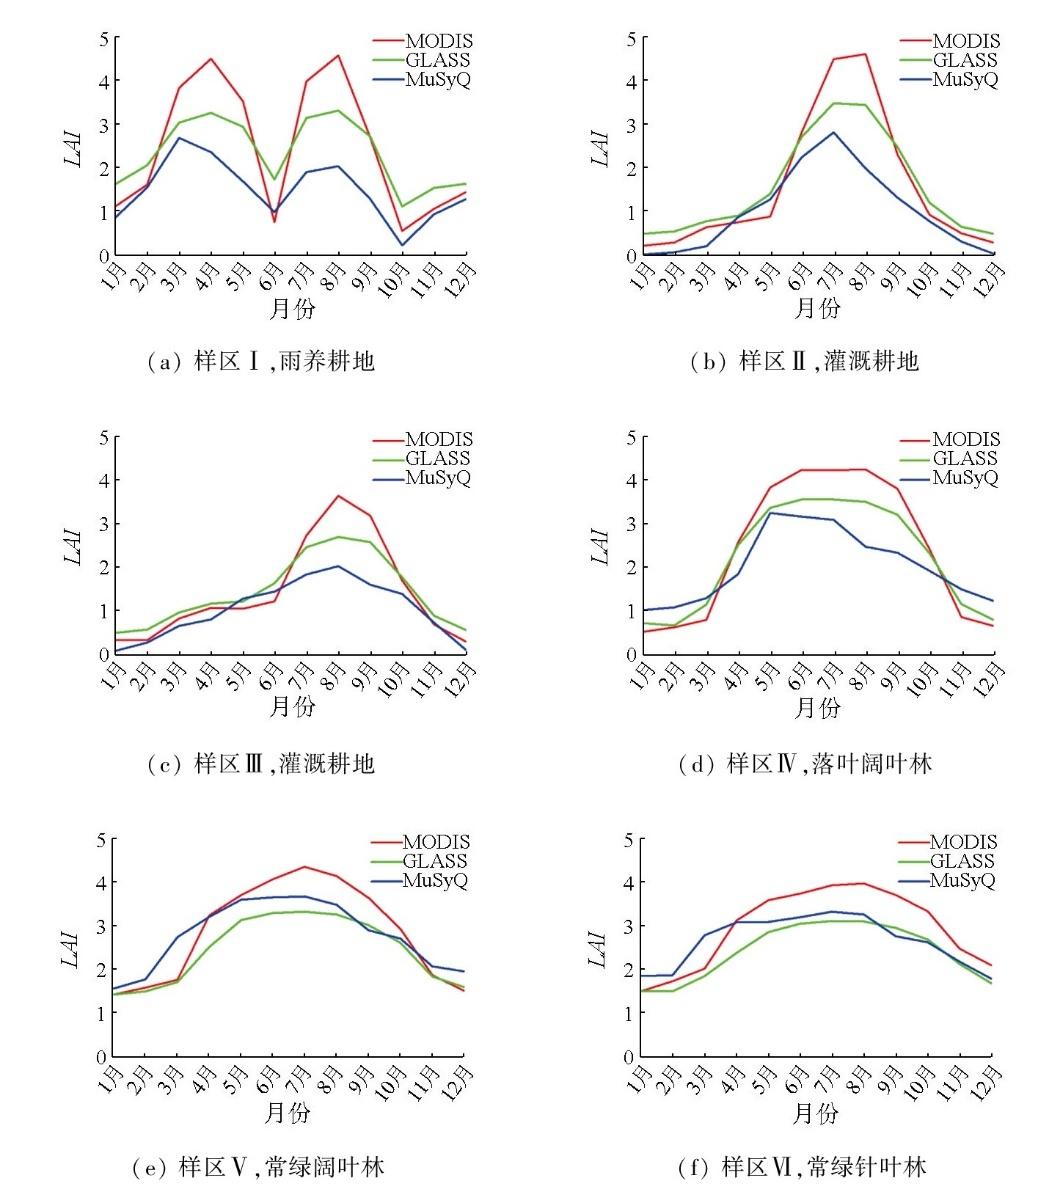
叶面积指数(leaf area index,LAI)是研究全球碳循环、水循环、能量交换以及气候变化的重要参数之一。目前存在多个不同时间序列和分辨率的LAI产品,对不同产品进行对比分析,不仅可以揭示LAI产品在各区域的适用性,还可以为产品算法的改进提供建议。该文选取安徽省典型样区,从对植被时空特征表征能力方面对MuSyQ LAI、MODIS LAI和GLASS LAI产品的时空一致性进行对比和评价。研究结果表明:①空间上,3种产品空间分布与植被空间分布格局相吻合,空间一致性相对较好,但在LAI大小和空间异质性的表现上存在差异。MODIS LAI值整体高于其他2种产品,MuSyQ LAI值相对GLASS LAI值在耕地和落叶阔叶林地区偏低,在常绿林地区偏高。3种产品随着空间分辨率的提高,空间细节表现力增强,MuSyQ LAI所表征地物分布的空间异质性最显著;②MODIS LAI和GLASS LAI值随高程变化规律较一致,而MuSyQ LAI变化与两者存在差异,3种产品LAI值在低海拔地区随高程增加而增加,在高海拔处变化趋势因样区不同存在差异;③时间上,各产品多年平均的时间序列曲线完整性较好,呈现出相似的季节变化趋势,能很好地表征农作物的物候特征及不同植被的季节变化规律。3种产品时空一致性相对较好,均能反映植被的空间分布特征和时间变化规律,但在LAI大小和空间异质性的表现上存在差异,MuSyQ LAI产品数据更适用于地形复杂、地物分布异质性高的区域年内变化研究,GLASS LAI更适于长时间序列大区域的研究。
赵萍 , 常杰 , 周俊 , 吴松 , 申奥 , 楚博策 . MuSyQ,MODIS和GLASS LAI产品在安徽省的对比分析[J]. 自然资源遥感, 2025 , 37(5) : 183 -194 . DOI: 10.6046/zrzyyg.2024285
The leaf area index (LAI) serves as an important parameter for investigating the global carbon cycle,water cycle,energy exchange,and climate change. At present,there are multiple LAI products with different time series and resolutions. Comparative analysis of these products can not only reveal their suitability in various regions,but also provide suggestions for optimizing their algorithms. Focusing on the typical areas in Anhui province,this study compared and assessed the spatiotemporal consistency of MuSyQ LAI,MODIS LAI,and GLASS LAI products from the perspective of their capacity to characterize the spatiotemporal characteristics of vegetation. The results indicate that the spatial distribution of LAI obtained from the three products was consistent with the spatial distribution of vegetation,revealing good spatial consistency. However,there existed differences in LAI values and spatial heterogeneity. To be specific,the MODIS LAI displayed generally higher values than the other two products. The MuSyQ LAI exhibited lower values than the GLASS LAI in cultivated land and deciduous broad-leaved forests,but higher values in evergreen forests. As spatial resolution increases,the three products all showed better spatial details,with the MuSyQ LAI featuring the most pronounced spatial heterogeneity in land cover distribution. As the elevation varies,the MODIS LAI and GLASS LAI values vary in a consistent pattern,while the MuSyQ LAI value varies in a different pattern. The three products presented altitude-varying LAI values at low-altitude areas,whereas they showed varying change patterns at high-altitude areas across different sample areas. Temporally,the three products presented relatively complete time-series curves of the annual average LAI value over the years and similar seasonal trends,which can effectively characterize the phenological characteristics of crops and the seasonal variations of different plants. Overall,the three products exhibited good spatiotemporal consistency,all of which can reflect the spatial distribution and temporal changes of vegetation. However,they were different in the LAI value and spatial heterogeneity. Among them,the MuSyQ LAI is more suitable for investigating inter-annual changes in areas featuring complex terrains and high heterogeneity in land cover distribution,while the GLASS LAI is more suitable for long-time-series studies in large areas.
表1 各样区概况Tab.1 Overview of various districts |
| 样区 编号 | 位置 | 高程/m | 地貌区 | 主要植被 类型 |
|---|---|---|---|---|
| Ⅰ | 蚌埠市、 宿州市 | 3~88 | 淮河平原区 | 雨养耕地 |
| Ⅱ | 六安市 | 16~87 | 江淮台地丘陵区 | 灌溉耕地 |
| Ⅲ | 合肥市、 芜湖市 | 1~225 | 沿江平原区 | 灌溉耕地 |
| Ⅳ | 六安市、 安庆市 | 125~1 759 | 皖西山地丘陵区 | 落叶阔叶林 |
| Ⅴ | 宣城市 | 12~1 126 | 皖南山地丘陵区 | 常绿阔叶林 |
| Ⅵ | 黄山市 | 73~1 065 | 皖南山地丘陵区 | 常绿针叶林 |
表2 LAI产品主要特征Tab.2 Main features of LAI products |
| 名称 | 时间分辨率/d | 空间分辨率/m | 时间范围 | 区域 | 主要算法 |
|---|---|---|---|---|---|
| MOD15A2H | 8 | 500 | 2000—2022年 | 全球 | 三维辐射传输模型构建查找表 |
| GLASS | 8 | 250 | 2000—2021年 | 全球 | 双向长短期记忆时间循环神经网络 |
| MuSyQ | 10 | 16 | 2018—2020年 | 中国 | 三维随机辐射传输模型构造查找表 |
表3 7月份各产品在各样区主要植被类型的统计特征值Tab.3 Statistical characteristic values of various products in different regions in July |
| 样区编号 | LAI产品 | 最大值 | 最小值 | 平均值 | 标准差 |
|---|---|---|---|---|---|
| Ⅰ | MODIS | 7.0 | 0.9 | 4.0 | 1.1 |
| GLASS | 5.0 | 0.9 | 3.2 | 0.4 | |
| MuSyQ | 7.0 | 0.0 | 2.2 | 1.3 | |
| Ⅱ | MODIS | 7.0 | 1.3 | 4.5 | 1.3 |
| GLASS | 5.1 | 1.0 | 3.5 | 0.5 | |
| MuSyQ | 7.0 | 0.0 | 2.9 | 1.4 | |
| Ⅲ | MODIS | 7.0 | 1.3 | 3.3 | 1.1 |
| GLASS | 5.7 | 1.0 | 3.0 | 0.5 | |
| MuSyQ | 7.0 | 0.0 | 2.3 | 1.3 | |
| Ⅳ | MODIS | 7.0 | 1.9 | 6.0 | 0.7 |
| GLASS | 6.4 | 1.7 | 5.2 | 0.5 | |
| MuSyQ | 7.0 | 0.0 | 4.7 | 1.5 | |
| Ⅴ | MODIS | 7.0 | 1.4 | 6.0 | 1.0 |
| GLASS | 6.8 | 0.7 | 4.9 | 0.7 | |
| MuSyQ | 7.0 | 0.0 | 5.3 | 2.0 | |
| Ⅵ | MODIS | 7.0 | 2.4 | 6.3 | 0.7 |
| GLASS | 6.8 | 1.4 | 5.0 | 0.5 | |
| MuSyQ | 7.0 | 0.0 | 5.7 | 1.8 |
表4 7月份各产品在各样区各种植被类型的年平均LAI值Tab.4 Annual average LAI values of various products in different vegetation types in various regions in July |
| 样区 编号 | LAI产品 | 雨养 耕地 | 灌溉 耕地 | 常绿阔 叶林 | 落叶阔 叶林 | 常绿针 叶林 | 草地 | 灌木 地 |
|---|---|---|---|---|---|---|---|---|
| Ⅰ | MODIS | 4.0 | 3.8 | 4.1 | - | - | 3.1 | - |
| GLASS | 3.2 | 3.0 | 3.1 | - | - | 2.4 | - | |
| MuSyQ | 2.2 | 1.5 | 3.0 | - | - | 1.1 | - | |
| Ⅱ | MODIS | 4.3 | 4.5 | 4.6 | 4.8 | 5.9 | 3.7 | - |
| GLASS | 3.4 | 3.5 | 3.7 | 3.7 | 3.2 | 2.9 | - | |
| MuSyQ | 2.7 | 2.9 | 3.2 | 3.1 | 2.7 | 1.5 | - | |
| Ⅲ | MODIS | 3.1 | 3.3 | 4.0 | 3.9 | 5.2 | 3.2 | - |
| GLASS | 2.9 | 3.0 | 3.6 | 3.7 | 4.0 | 2.7 | - | |
| MuSyQ | 1.9 | 2.3 | 3.5 | 3.3 | 4.4 | 1.5 | - | |
| Ⅳ | MODIS | 5.2 | 4.2 | 5.9 | 6.1 | 6.1 | 5.4 | - |
| GLASS | 4.1 | 3.6 | 4.9 | 5.2 | 5.1 | 4.2 | - | |
| MuSyQ | 2.6 | 1.7 | 4.4 | 4.7 | 3.5 | 2.5 | - | |
| Ⅴ | MODIS | 3.8 | 3.3 | 6.0 | 5.9 | 6.1 | 5.6 | - |
| GLASS | 3.2 | 2.8 | 4.9 | 5.1 | 5.2 | 3.7 | - | |
| MuSyQ | 1.9 | 1.5 | 5.3 | 4.8 | 4.5 | 2.1 | - | |
| Ⅵ | MODIS | 6.0 | 5.6 | 6.3 | 6.2 | 6.3 | 5.5 | 6.4 |
| GLASS | 4.1 | 3.7 | 5.1 | 5.0 | 5.0 | 3.4 | 5.2 | |
| MuSyQ | 3.1 | 2.4 | 5.1 | 5.0 | 5.8 | 1.6 | 5.3 |
表5 7月份各产品在各样区的SHDI和SHEITab.5 Shannon diversity index and Shannon uniformity index of each product in various regions in July |
| 样区编号 | LAI产品 | SHDI | SHEI |
|---|---|---|---|
| Ⅰ | MODIS | 1.11 | 0.63 |
| GLASS | 0.82 | 0.51 | |
| MuSyQ | 1.37 | 0.86 | |
| Ⅱ | MODIS | 1.51 | 0.74 |
| GLASS | 0.86 | 0.53 | |
| MuSyQ | 1.74 | 0.84 | |
| Ⅲ | MODIS | 1.27 | 0.55 |
| GLASS | 0.89 | 0.50 | |
| MuSyQ | 1.48 | 0.71 | |
| Ⅳ | MODIS | 1.24 | 0.69 |
| GLASS | 1.07 | 0.66 | |
| MuSyQ | 1.84 | 0.88 | |
| Ⅴ | MODIS | 1.51 | 0.77 |
| GLASS | 1.40 | 0.71 | |
| MuSyQ | 1.83 | 0.88 | |
| Ⅵ | MODIS | 1.02 | 0.57 |
| GLASS | 0.89 | 0.46 | |
| MuSyQ | 1.76 | 0.84 |
图4 3种 LAI 产品7月份年平均两两之间差异的空间分布图Fig.4 Spatial distribution of the two-by-two differences between the annual averages of the three LAI products for the month of July |
表6 样区Ⅳ不同植被类型在不同高程段分布面积比例Tab.6 Distribution area ratio of different vegetation types in different elevation sections of sample area IV (%) |
| 植被类型 | [0,150]m | (150,300]m | (300,450]m | (450,600]m | (600,750]m | (750,900]m | (900,1 050]m |
|---|---|---|---|---|---|---|---|
| 雨养耕地 | 30.76 | 14.81 | 10.25 | 9.28 | 8.12 | 5.74 | 1.63 |
| 灌溉耕地 | 5.88 | 3.15 | 1.25 | 0.90 | 0.91 | 0.32 | 0.02 |
| 常绿阔叶林 | 33.87 | 47.12 | 44.69 | 38.62 | 32.24 | 27.07 | 18.94 |
| 落叶阔叶林 | 27.63 | 30.55 | 39.94 | 45.18 | 51.78 | 58.85 | 71.14 |
| 常绿针叶林 | 0.00 | 1.75 | 2.63 | 5.00 | 6.46 | 7.70 | 8.19 |
| 草地 | 1.86 | 2.61 | 1.24 | 1.02 | 0.51 | 0.31 | 0.08 |
表7 样区Ⅴ的不同植被类型在不同高程段分布面积比例Tab.7 Distribution area ratio of different vegetation types in different elevation segments of sample area V (%) |
| 植被类型 | [0,150]m | (150,300]m | (300,450]m | (450,600]m | (600,750]m | (750,900]m | (900,1 050]m |
|---|---|---|---|---|---|---|---|
| 雨养耕地 | 26.82 | 5.85 | 0.62 | 0.08 | 0.05 | 0.00 | 0.00 |
| 灌溉耕地 | 16.80 | 0.93 | 0.02 | 0.00 | 0.00 | 0.00 | 0.00 |
| 常绿阔叶林 | 47.35 | 73.42 | 69.95 | 61.58 | 53.29 | 39.46 | 61.53 |
| 落叶阔叶林 | 3.74 | 7.49 | 9.69 | 16.09 | 25.60 | 44.89 | 28.89 |
| 常绿针叶林 | 3.95 | 11.40 | 19.43 | 22.18 | 20.99 | 15.59 | 9.56 |
| 草地 | 1.34 | 0.91 | 0.29 | 0.06 | 0.07 | 0.07 | 0.02 |
表8 样区Ⅵ的不同植被类型在不同高程段分布面积比例Tab.8 Distribution area ratio of different vegetation types in different elevation segments of sample area VI (%) |
| 植被类型 | [0,150]m | (150,300]m | (300,450]m | (450,600]m | (600,750]m | (750,900]m | (900,1 050]m |
|---|---|---|---|---|---|---|---|
| 雨养耕地 | 13.74 | 6.12 | 1.03 | 0.11 | 0.00 | 0.00 | 0.00 |
| 灌溉耕地 | 6.72 | 2.84 | 0.29 | 0.01 | 0.00 | 0.00 | 0.00 |
| 常绿阔叶林 | 26.70 | 31.41 | 35.81 | 36.60 | 36.15 | 30.74 | 35.37 |
| 落叶阔叶林 | 2.37 | 2.73 | 3.45 | 6.62 | 11.88 | 25.23 | 38.80 |
| 常绿针叶林 | 49.91 | 56.30 | 59.01 | 56.46 | 51.86 | 44.00 | 25.83 |
| 灌木丛 | 0.56 | 0.60 | 0.41 | 0.20 | 0.11 | 0.03 | 0.00 |
| [1] |
|
| [2] |
冯一鸣, 张娜, 乐荣武, 等. 中国北方温性草地最大叶面积指数的时空变化及其对气候变化的响应[J]. 中国科学院大学学报(中英文), 2024, 41(2):195-211.
|
| [3] |
|
| [4] |
曾也鲁, 李静, 柳钦火. 全球LAI地面验证方法及验证数据综述[J]. 地球科学进展, 2012, 27(2):165-174.
|
| [5] |
|
| [6] |
|
| [7] |
|
| [8] |
|
| [9] |
|
| [10] |
|
| [11] |
|
| [12] |
|
| [13] |
|
| [14] |
|
| [15] |
|
| [16] |
张虎, 李静, 柳钦火, 等. 基于三维随机辐射传输模型的高分一号中国叶面积指数产品算法[J]. 遥感学报, 2023, 27(3):677-688.
|
| [17] |
方红亮. 我国叶面积指数卫星遥感产品生产及验证[J]. 遥感技术与应用, 2020, 35(5):990-1003.
|
| [18] |
刘远, 周买春. MODIS, CYCLOPES和GLASS 3种LAI产品在韩江流域的对比[J]. 国土资源遥感, 2018, 30(1):14-21.doi:10.6046/gtzyyg.2018.01.03.
|
| [19] |
|
| [20] |
喻樾, 张方敏, 陈镜明. 国产叶面积指数产品在中国区域的一致性检验[J]. 遥感技术与应用, 2023, 38(5):1239-1249.
|
| [21] |
|
| [22] |
杨帆, 李振旺, 包玉海, 等. 不同叶面积指数遥感产品在呼伦贝尔草甸草原的应用对比[J]. 农业工程学报, 2016, 32(S1):153-160.
|
| [23] |
杨勇帅, 李爱农, 靳华安, 等. 中国西南山区GEOV1、GLASS和MODIS LAI产品的对比分析[J]. 遥感技术与应用, 2016, 31(3):438-450.
|
| [24] |
|
| [25] |
|
| [26] |
|
| [27] |
|
| [28] |
张虎, 李静, 张召星, 等. MuSyQ高分16米分辨率10天合成的叶面积指数产品(2018-2020年中国01版)[J]. 中国科学数据, 2022, 7(1):217-226.
|
| [29] |
林世滔, 谢弟炳, 刘郁林, 等. 景观格局特征与区域生物多样性的关系研究[J]. 生态环境学报, 2017, 26(10):1681-1688.
|
| [30] |
连虎刚, 曲张明, 刘春芳, 等. 北方防沙带河西走廊段景观格局时空演变及其防风固沙服务响应[J]. 应用生态学报, 2023, 34(9):2518-2526.
|
| [31] |
赵方圆, 杨宇翔, 张华堂, 等. 土地利用及景观格局动态变化分析——以甘肃省党河流域为例[J]. 水土保持研究, 2021, 28(3):235-241.
|
/
| 〈 |
|
〉 |