
2020—2023年全国大陆地区沿海区域变化图斑高频次时空演变分析
|
李 威(2000-),男,硕士研究生,研究方向为海洋遥感、智能信息处理。Email: 64429476@qq.com。 |
Copy editor: 张仙
收稿日期: 2024-01-02
修回日期: 2024-08-09
网络出版日期: 2026-06-03
基金资助
国家自然科学基金青年基金项目“面向海山底栖生境图的多波束地形因子精确提取方法研究”(42206200)
国家海洋信息中心科技攻关创新基金项目(2301GJZD01)
Analysis of high-frequency spatiotemporal evolution of patches reflecting 2020—2023 changes in coastal areas of the Chinese mainland
Received date: 2024-01-02
Revised date: 2024-08-09
Online published: 2026-06-03
李威 , 赵彬如 , 梁建峰 , 周鹏 , 张峰 . 2020—2023年全国大陆地区沿海区域变化图斑高频次时空演变分析[J]. 自然资源遥感, 2025 , 37(4) : 77 -87 . DOI: 10.6046/zrzyyg.2024002
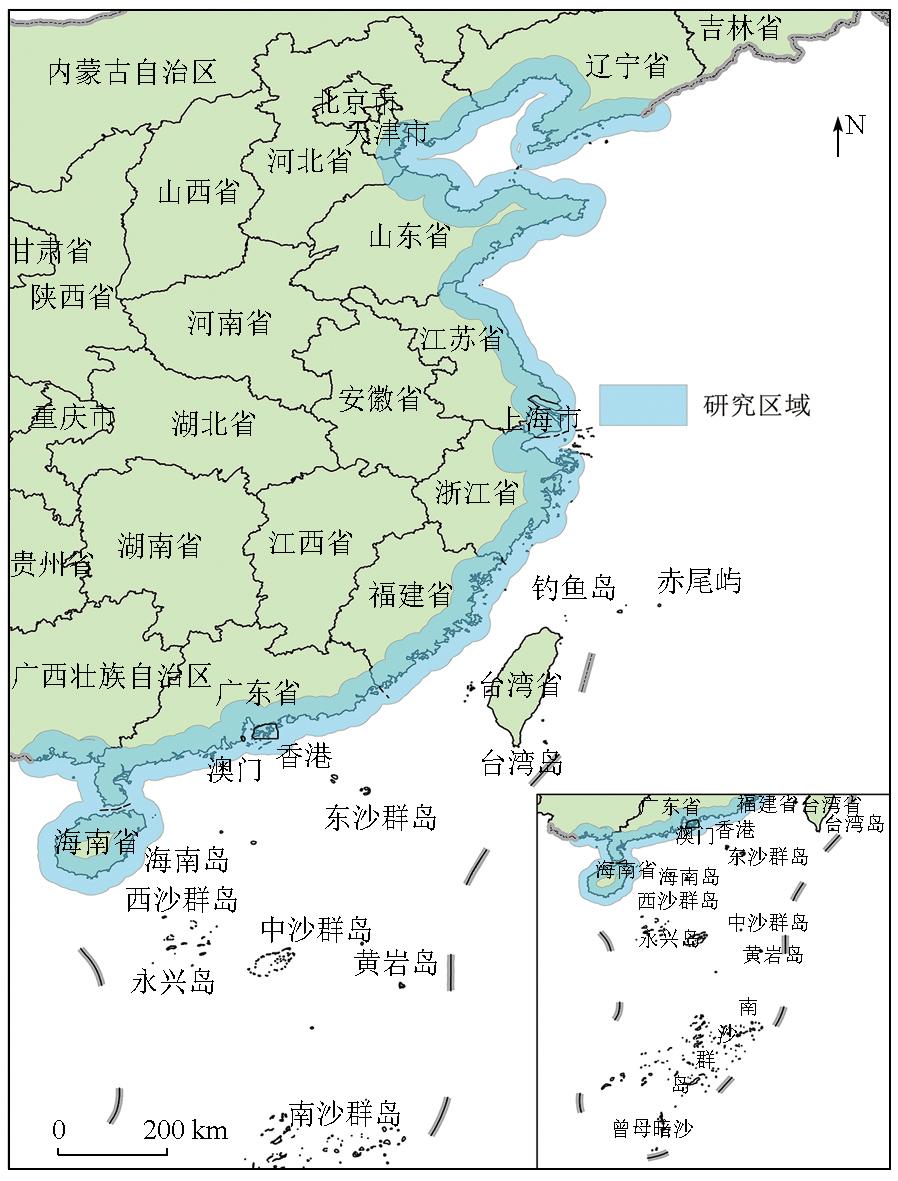
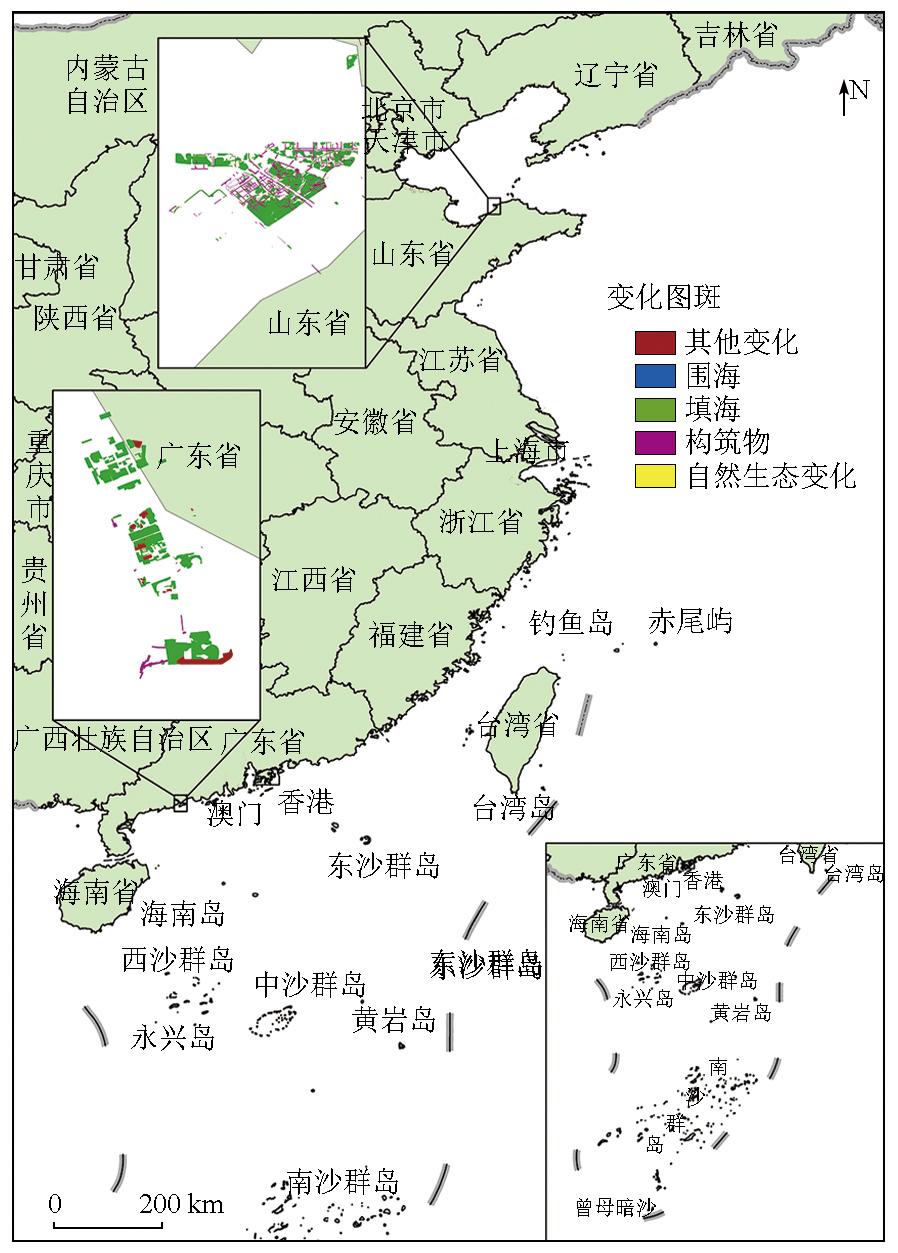
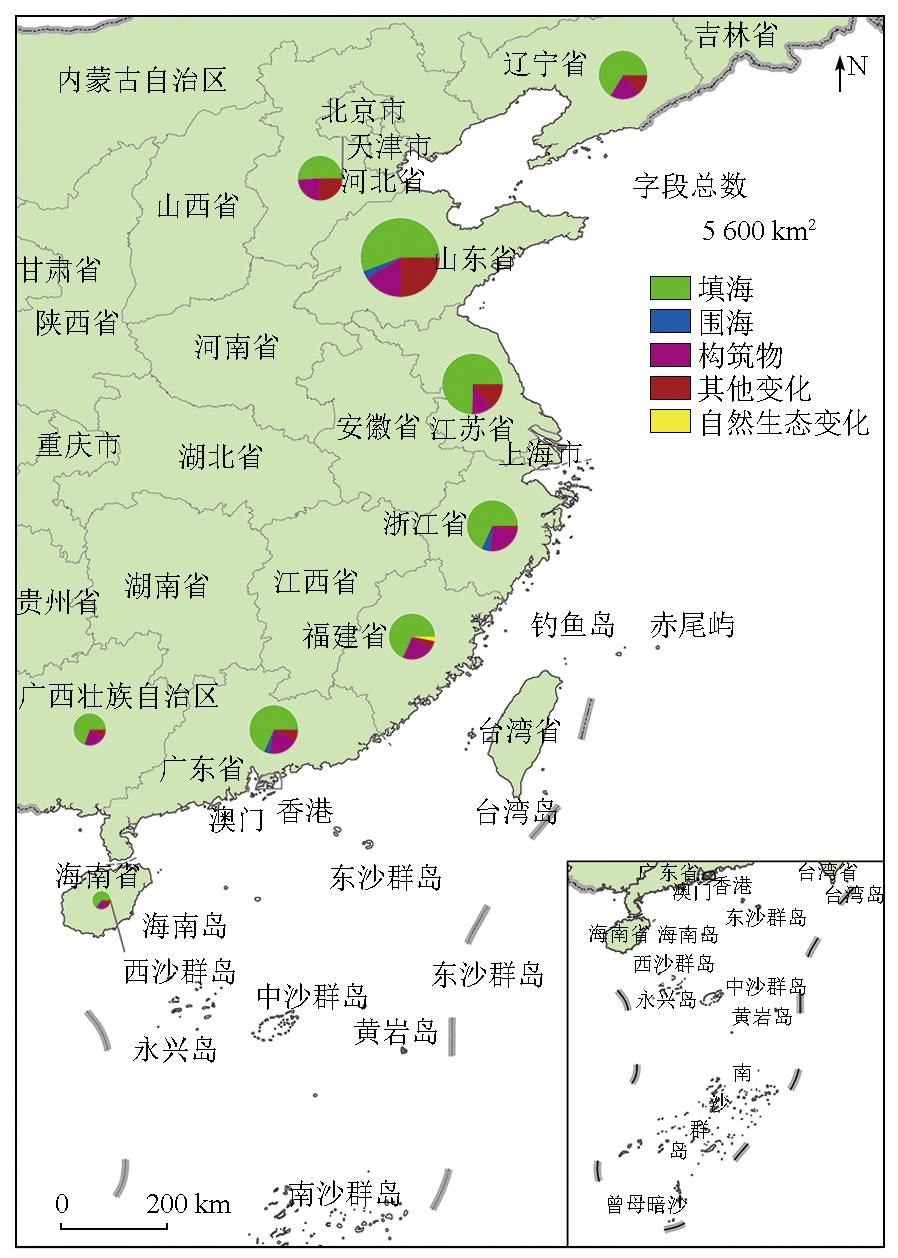
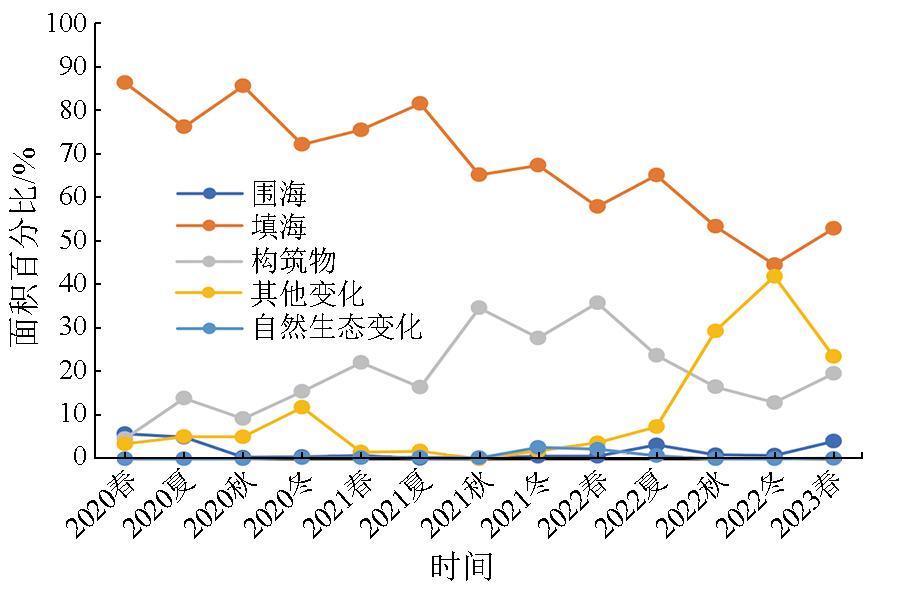
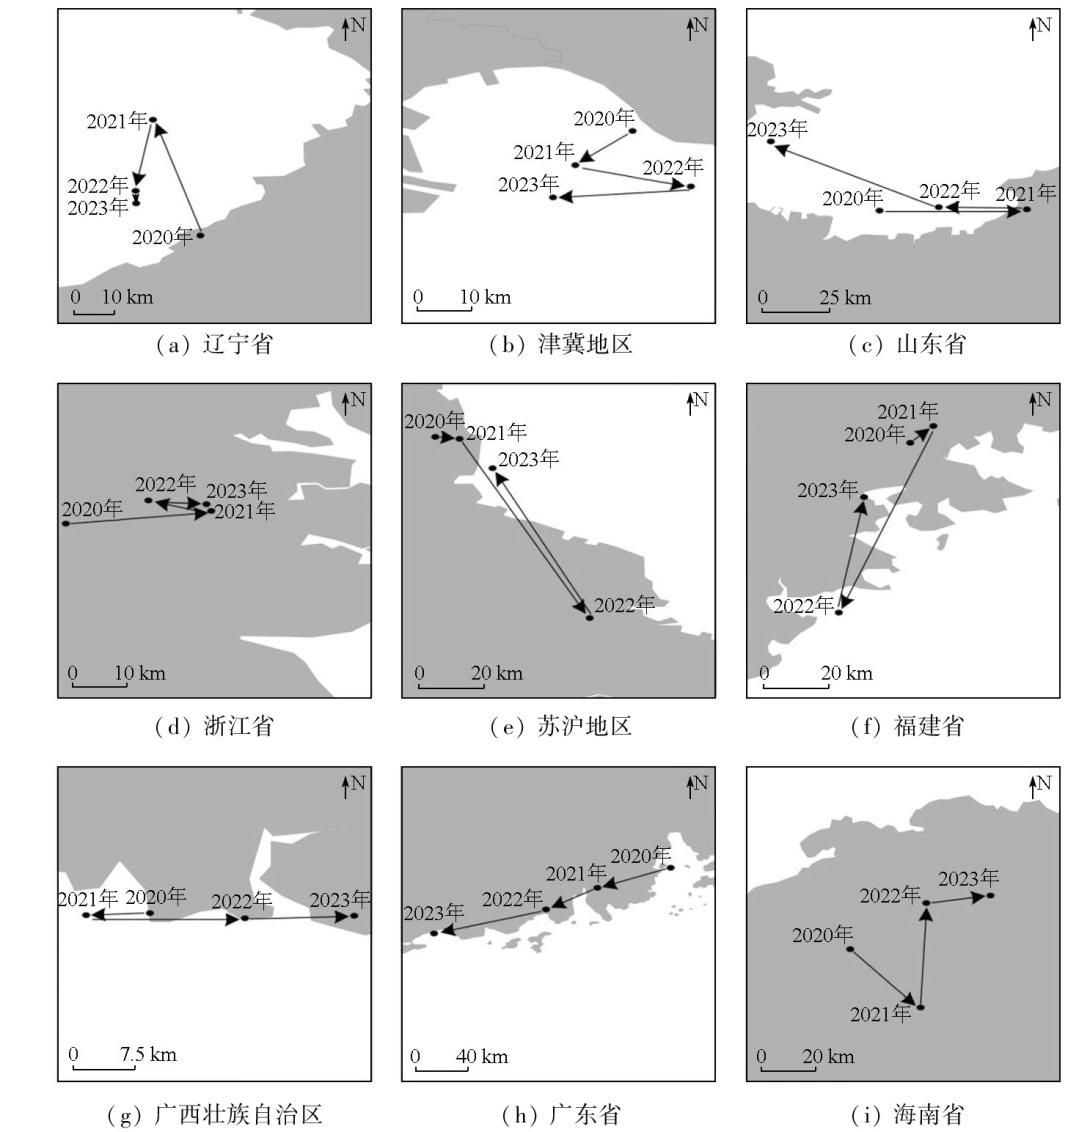
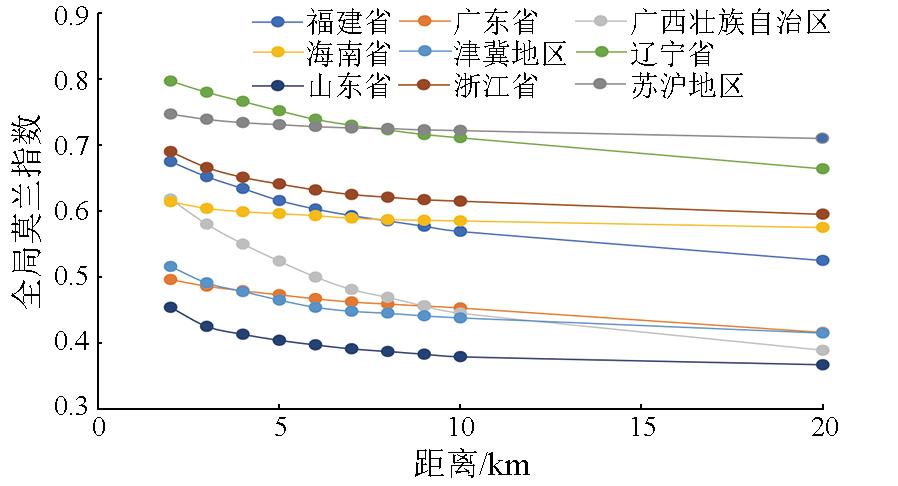
The analysis of patches showing changes in coastal areas of the Chinese mainland tends to encounter challenges such as low image resolution, long time intervals, and limited spatial coverage. This study aims to obtain high-frequency, accurate information on changes in coastal areas nationwide. This will facilitate the dynamic monitoring of marine resources and the implementation of relevant protection policies for coastal areas in China. To this end, using domestic high-resolution remote sensing data of 15 days (i.e., one cycle), as well as the iteratively reweighted multivariate alteration detection (IR-MAD) algorithm combined with visual interpretation, this study extracted patches reflecting 2020—2023 changes along the coasts of 11 provinces and cities in the Chinese mainland. Accordingly, this study analyzed their spatiotemporal characteristics, landscape patterns, and spatial correlation. The results indicate distinct directional changes in the patches. The patches reflecting changes from sea enclosure to reclamation exhibited the largest areas across various investigated areas. Except for Hainan Province, the area of this type of patches exceeded 1 000 km2. The proportions of patches reflecting different types of changes gradually tended to be balanced. In the winter of 2022, the proportion of patches showing changes in the reclamation dropped below 50% for the first time. The aggregation degree of patches reflecting various types of changes showed increasing trends, suggesting that patches reflecting various changes will become more concentrated in the future. The centroids of these patches of various regions shifted in varying directions, and these patches exhibited significant spatial correlation within a 20 km range.
表1 数据源卫星参数Tab.1 Data source satellite parameters |
| 参数 | GF-1 | GF-2 | GF-6 | ZY-3 | |
|---|---|---|---|---|---|
| 光谱范 围/μm | 全色 | 0.45~0.90 | 0.45~0.90 | 0.45~0.90 | 0.45~0.80 |
| 多光谱 | 0.45~0.52 | 0.45~0.52 | 0.45~0.52 | 0.45~0.52 | |
| 0.52~0.59 | 0.52~0.59 | 0.52~0.59 | 0.52~0.59 | ||
| 0.63~0.69 | 0.63~0.69 | 0.63~0.69 | 0.63~0.69 | ||
| 0.77~0.89 | 0.77~0.89 | 0.77~0.89 | 0.77~0.89 | ||
| 空间分辨 率/m | 全色 | 2 | 0.8 | 2 | 2.1 |
| 多光谱 | 8 | 3.2 | 8 | 5.8 | |
| 重访周期/d | 4 | 5 | 2 | 5 | |
| 幅宽/km | 60 | 45 | 90 | 50 | |
表2 不同类型地类NDWI经验值Tab.2 NDWI empirical values for different types |
| 类型 | 取值范围 |
|---|---|
| 干旱、非水性表面 | -1≤NDWI<-0.3 |
| 中度干旱区、水面 | -0.3≤NDWI< 0 |
| 洪水 | 0≤NDWI<0.2 |
| 水体 | -0.3<NDWI≤1 |
表3 变化图斑类型划分及解译标志Tab.3 Change mapping type classification and deciphering flags |
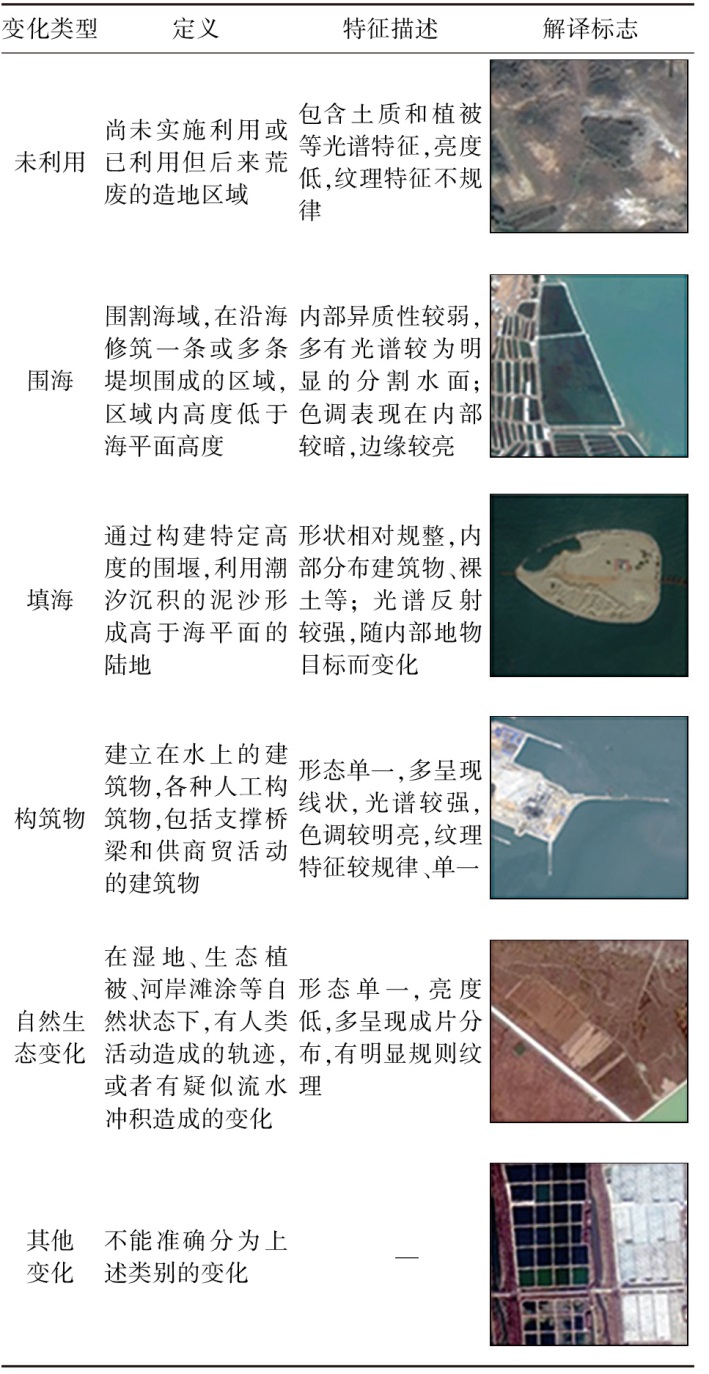 |
表4 实验数据阈值Tab.4 Experimental data thresholds |
| 影像日期 | 自然间断点 分级法阈值 | 经验阈值 | 最终阈值 |
|---|---|---|---|
| 2020-10-27 | 0.202 416 | 0.2 | 0.201 208 |
| 2020-11-13 | 0.294 445 | 0.2 | 0.247 223 |
表5 各地区变化图斑土地利用转移面积Tab.5 Land use transition areas of changed patches in different regions(km2) |
| 变化图斑转换类型 | 辽宁省 | 津冀地区 | 山东省 | 苏沪地区 | 浙江省 | 福建省 | 广东省 | 广西壮族自治区 | 海南省 |
|---|---|---|---|---|---|---|---|---|---|
| 未利用-围海 | 45.563 | 6.625 | 466.123 | 6.818 | 326.119 | 4.732 | 185.261 | 15.990 | 8.918 |
| 未利用-填海 | 717.986 | 53.325 | 181.044 | 138.660 | 335.543 | 656.009 | 379.416 | 241.736 | 135.487 |
| 未利用-构筑物 | 426.002 | 824.917 | 1 884.672 | 474.307 | 851.167 | 758.629 | 993.499 | 529.517 | 129.003 |
| 未利用-其他变化 | 633.681 | 40.071 | 1 509.616 | 45.870 | 38.317 | 103.296 | 111.409 | 27.319 | 66.556 |
| 未利用-自然生态变化 | 5.779 | 0.413 | 9.445 | 37.310 | 15.069 | 162.547 | 0.259 | 3.702 | 6.510 |
| 围海-填海 | 3 055.425 | 2 424.417 | 8 295.326 | 6 515.486 | 3 965.218 | 2 872.597 | 3 570.030 | 1 501.415 | 358.201 |
| 围海-构筑物 | 729.380 | 288.740 | 575.847 | 472.987 | 677.733 | 397.950 | 211.111 | 54.658 | 40.354 |
| 围海-其他变化 | 127.838 | 1 225.246 | 2 298.705 | 1 230.013 | 85.949 | 191.845 | 248.491 | 151.440 | 26.957 |
| 围海-自然生态变化 | 0.093 | 0.062 | 0.599 | 7.369 | — | — | — | — | — |
| 填海-构筑物 | 13.101 | 0.650 | 7.258 | 29.115 | 5.471 | 0.676 | 0.326 | 1.703 | — |
| 填海-其他变化 | 0.907 | — | — | — | 0.641 | 14.588 | 31.722 | — | 0.936 |
| 填海-自然生态变化 | — | — | — | — | — | 1.489 | — | — | — |
| 构筑物-其他变化 | — | — | — | — | 0.251 | — | 13.287 | — | — |
表6 类型水平景观格局指数Tab.6 Type level landscape pattern indexes |
| 景观指数 | 年份 | 围海 | 填海 | 构筑物 | 其他 变化 | 自然生 态变化 |
|---|---|---|---|---|---|---|
| LPI | 2020年 | 0.983 7 | 4.274 1 | 0.486 2 | 0.260 1 | — |
| 2021年 | 0.094 2 | 3.984 9 | 1.198 2 | 0.848 1 | 0.094 2 | |
| 2022年 | 0.228 7 | 3.304 0 | 1.558 8 | 2.295 8 | 0.330 4 | |
| 2023年 | 0.807 1 | 2.402 4 | 0.503 3 | 2.165 0 | 0.019 0 | |
| AI | 2020年 | 47.308 3 | 51.565 2 | 16.026 3 | 32.190 0 | — |
| 2021年 | 23.214 3 | 48.692 0 | 26.871 2 | 54.411 8 | 28.358 2 | |
| 2022年 | 37.000 0 | 52.010 5 | 25.221 5 | 70.824 4 | 56.903 8 | |
| 2023年 | 58.463 7 | 57.765 8 | 28.721 3 | 59.702 4 | 0 | |
| DII | 2020年 | 2.978 5 | 59.165 5 | 7.999 2 | 4.548 6 | — |
| 2021年 | 0.198 0 | 44.674 1 | 14.408 1 | 1.603 2 | 3.160 3 | |
| 2022年 | 1.287 2 | 56.646 1 | 23.045 0 | 16.125 2 | 9.782 3 | |
| 2023年 | 1.700 1 | 39.468 4 | 16.660 1 | 23.774 2 | 0.569 3 |
表7 景观水平景观格局指数Tab.7 Landscape level landscape pattern indexes |
| 年份 | SHDI | SHEI | CONTAG |
|---|---|---|---|
| 2020年 | 0.727 6 | 0.524 8 | 67.013 0 |
| 2021年 | 0.718 2 | 0.446 2 | 71.151 4 |
| 2022年 | 1.053 3 | 0.587 9 | 64.620 8 |
| 2023年 | 1.096 1 | 0.681 1 | 61.421 0 |
| [1] |
|
| [2] |
魏帆, 韩广轩, 张金萍, 等. 1985—2015年围填海活动影响下的环渤海滨海湿地演变特征[J]. 生态学杂志, 2018, 37(5):1527-1537.
|
| [3] |
|
| [4] |
寇财垚, 满卫东, 张永彬, 等. 围填海背景下唐山市滨海湿地景观格局演变研究[J]. 湿地科学, 2023, 21(4):533-540
|
| [5] |
|
| [6] |
崔保山, 谢湉, 王青, 等. 大规模围填海对滨海湿地的影响与对策[J]. 中国科学院院刊, 2017, 32(4):418-425.
|
| [7] |
苏涛, 牛超, 詹诚, 等. 广西围填海进程及其对近海生态和生物资源的影响分析[J]. 广西科学院学报, 2018, 34(3):228-234.
|
| [8] |
陈克亮, 吴侃侃, 黄海萍, 等. 我国海洋生态修复政策现状、问题及建议[J]. 应用海洋学学报, 2021, 40(1):170-178.
|
| [9] |
徐鹤, 张玉新, 侯西勇, 等. 2010—2020年中国沿海主要海湾形态变化特征[J]. 自然资源学报, 2022, 37(4):1010-1024.
|
| [10] |
王琎, 吴志峰, 李少英, 等. 珠江口湾区海岸线及沿岸土地利用变化遥感监测与分析[J]. 地理科学, 2016, 36(12):1903-1911.
|
| [11] |
王娟, 赵吉祥, 单春芝, 等. 基于集成学习的海岸带变化检测方法研究[J]. 海洋开发与管理, 2021, 38(7):48-54.
|
| [12] |
|
| [13] |
|
| [14] |
|
| [15] |
付杰, 宋伦, 雷利元, 等. 最优尺度和随机森林算法下盘锦海岸带遥感监测[J]. 遥感信息, 2022, 37(2):7-15.
|
| [16] |
|
| [17] |
侯英卓, 纪灵, 邢前国, 等. 卫星遥感辅助的大型海藻养殖动态对比监测——以威海市为例[J]. 自然资源遥感, 2023, 35(2):34-41.doi:10.6046/zrzyyg.2022296.
|
| [18] |
易凤佳, 李仁东, 常变蓉, 等. 长株潭地区建设用地扩张遥感时空特征分析[J]. 国土资源遥感, 2015, 27(2):160-166.doi:10.6046/gtzyyg.2015.02.25.
|
| [19] |
匡文慧, 张树文, 杜国明, 等. 2015—2020年中国土地利用变化遥感制图及时空特征分析[J]. 地理学报, 2022, 77(5):1056-1071.
|
| [20] |
应超, 高扬, 田鹏, 等. 陆海统筹视角下温州市海岸带国土空间开发利用时空变化特征研究[J]. 海洋通报, 2023, 42(2):202-215.
|
| [21] |
温礼, 吴海平, 姜方方, 等. 高分遥感影像的围填海变化图斑自动提取方法[J]. 测绘科学, 2015, 40(6):42-45,76.
|
| [22] |
于枫世, 隋毅, 王常颖, 等. 基于深度学习的高分辨率卫星遥感影像围填海检测识别[J]. 遥感技术与应用, 2022, 37(4):789-799.
|
/
| 〈 |
|
〉 |