
融合多源遥感数据的河南省淅川县植被动态演变研究
|
葛利玲(1978-),女,高级工程师,主要从事国土空间规划、土地复垦、土地评价等。Email: geliling@163.com。 |
Office editor: 李瑜
收稿日期: 2024-01-04
修回日期: 2024-06-26
网络出版日期: 2026-06-03
Exploring the dynamic evolution of vegetation cover in Xichuan County, Henan Province by integrating multisource remote sensing data
Received date: 2024-01-04
Revised date: 2024-06-26
Online published: 2026-06-03
关键词: 淅川县; 南水北调中线工程; 时空自适应反射率融合模型; 植被覆盖度
葛利玲 , 王璐 . 融合多源遥感数据的河南省淅川县植被动态演变研究[J]. 自然资源遥感, 2025 , 37(3) : 192 -202 . DOI: 10.6046/zrzyyg.2024011
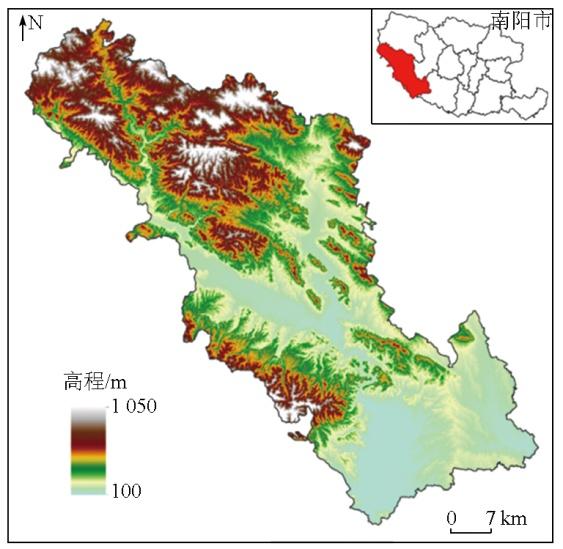
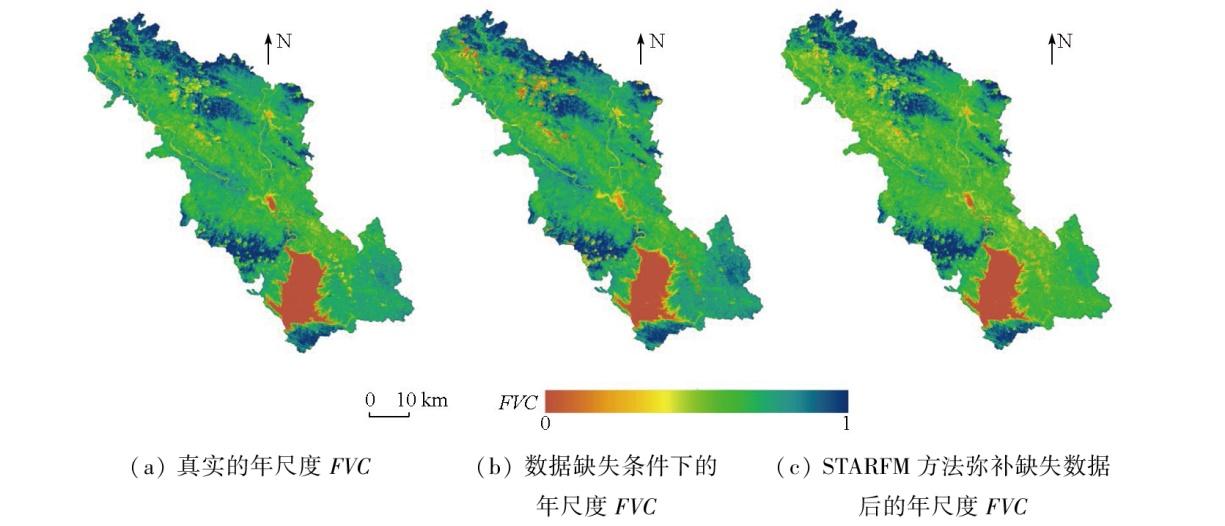
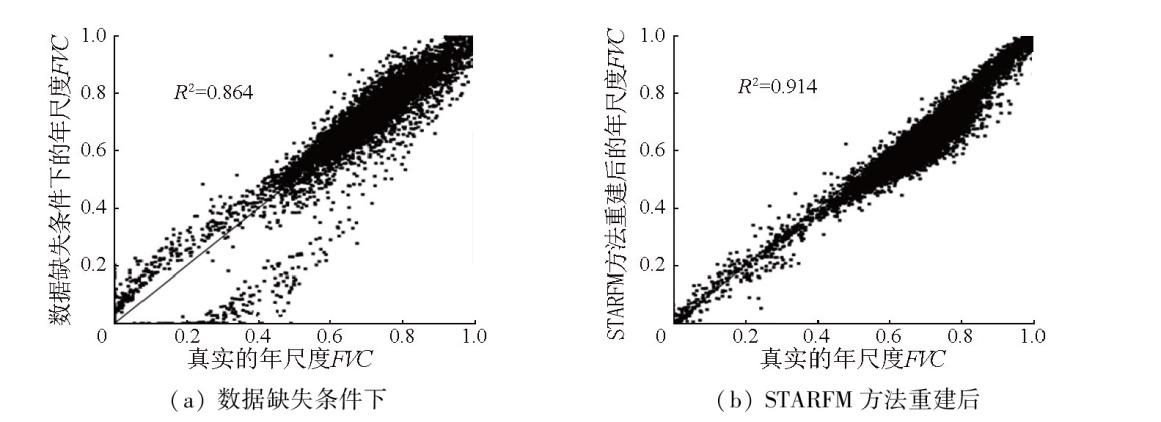
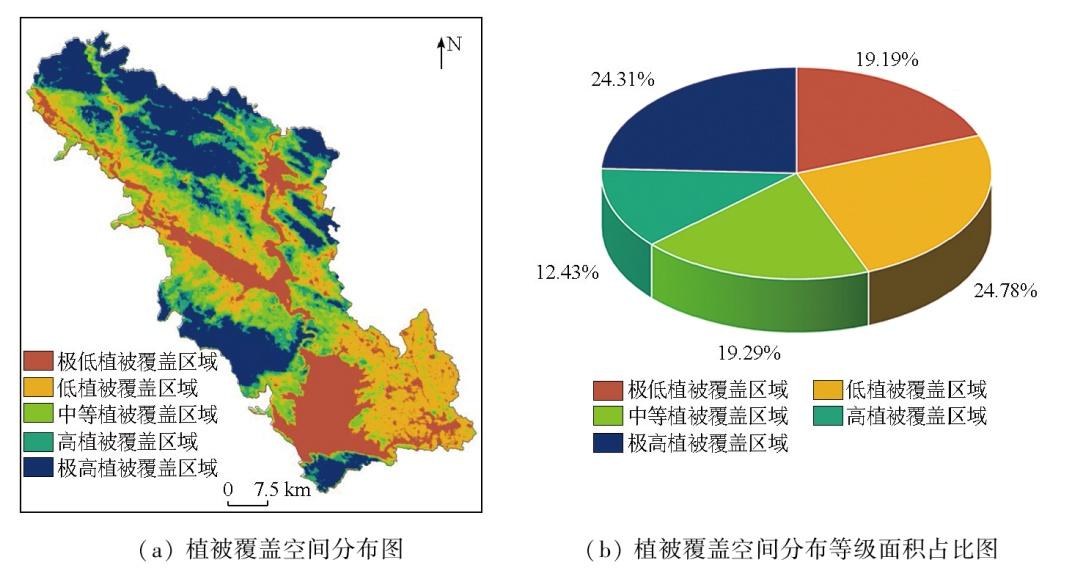
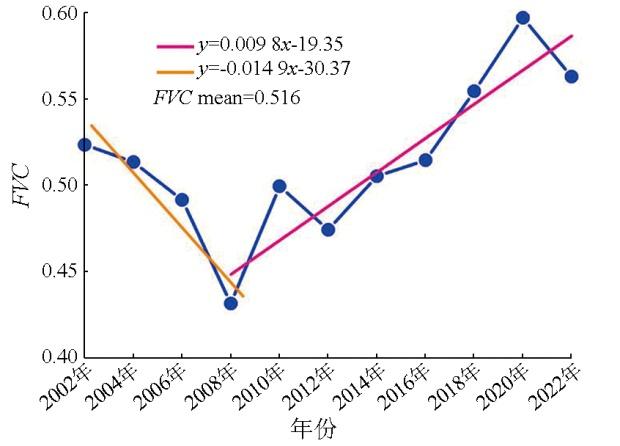
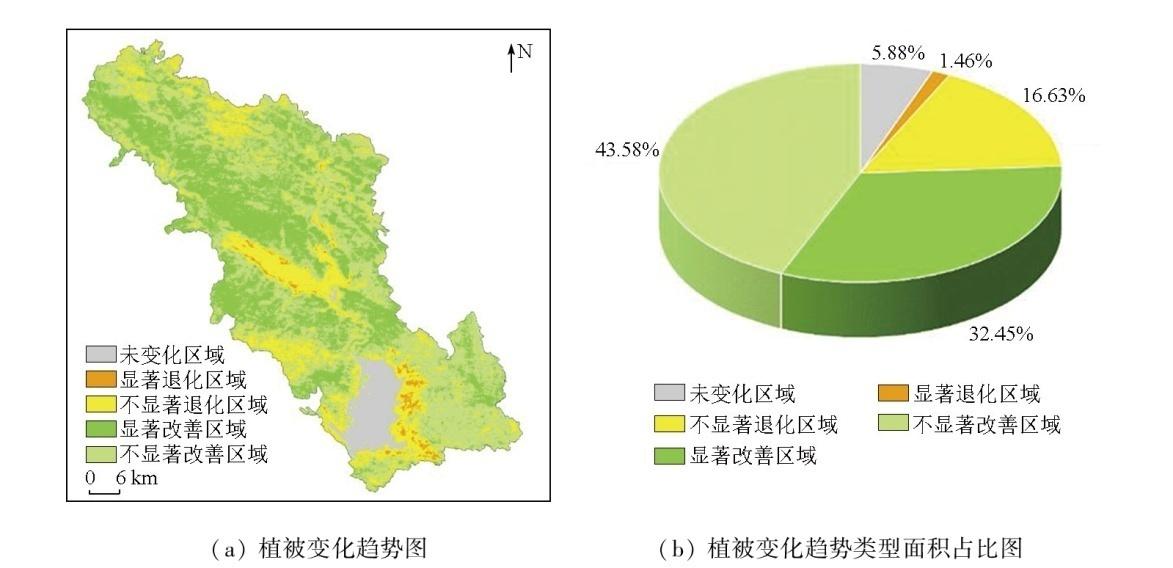
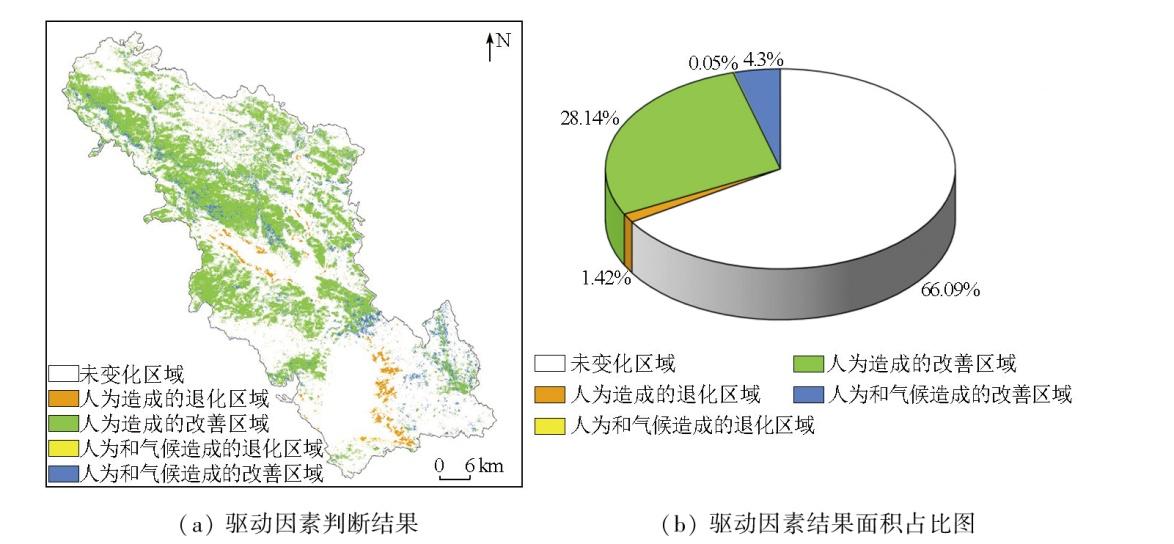
Xichuan County serves as a primary water source area for the middle route of the South-to-North Water Diversion Project. Investigating the spatiotemporal variations and driving mechanism of vegetation cover in Xichuan County is significant for the ecological restoration of the county and the environmental protection of the water source area for the middle route. Based on available Landsat and MODIS data, this study constructed long time-series fractional vegetation cover (FVC) data for Xichuan County from 2002 to 2022 using the spatiotemporal adaptive reflection fusion model (STARFM) and the dimidiate pixel model. In combination with regression and trend analyses, the geodetector model, and correlation analysis, this study explored the spatiotemporal variations and driving mechanism of vegetation cover in Xichuan County during the study period. The results indicate that the coefficient of determination (R2) between the STARFM-reconstructed and real annual-scale FVC reached 0.914, an improvement of 0.05 compared to 0.864 under conditions of data missing. Therefore, the STARFM can provide a reliable data basis for more accurately investigating the dynamic evolution of vegetation cover in Xichuan County. From 2002 to 2022, the vegetation cover in Xichuan County was ordinary, with an average FVC value of 0.516, characterized by higher vegetation cover in the northwest compared to the southeast. The vegetation cover in Xichuan County showed an overall improvement trend, with an improved area representing 76.02 %, primarily covering the northwestern and southeastern portions of Xichuan County. In contrast, the degraded area represented 23.98 %, primarily covering the areas surrounding the Danjiangkou reservoir, Danjiang River, and Xishui branch. The spatial heterogeneity of vegetation cover in Xichuan County was predominantly influenced by elevation and slope, followed by soil type and average temperature, with minimal impacts from soil texture and average rainfall. The improvement and degradation of vegetation cover in Xichuan County were principally caused by anthropogenic factors, with minimal influence from climate factors. The primary anthropogenic factor denotes the middle route of the South-to-North Water Diversion Project, which contributed significantly to vegetation growth rather than inhibitory effects.
表1 使用的Landsat数据的波段详细介绍Tab.1 Detailed description of the used bands of Landsat data |
| 波段类型 | Landsat4—5 TM | Landsat7 ETM+ | Landsat8—9 OLI | |||
|---|---|---|---|---|---|---|
| 波段 | 波长/μm | 波段 | 波长/μm | 波段 | 波长/μm | |
| 近红外 (NIR) | B4 | 0.76~0.90 | B4 | 0.76~0.96 | B5 | 0.85~0.88 |
| 红波段 (Red) | B3 | 0.63~0.69 | B3 | 0.62~0.69 | B4 | 0.64~0.67 |
表2 使用的MOD13Q1数据Tab.2 Detailed description of MOD13Q1 data |
| 波段 | 波长/μm |
|---|---|
| B2 | 0.84~0.87 |
| B1 | 0.62~0.67 |
表3 Landsat影像数据集信息Tab.3 Landsat image dataset information |
| 月份 | 2002年 | 2004年 | 2006年 | 2008年 | 2010年 | 2012年 | 2014年 | 2016年 | 2018年 | 2020年 | 2022年 |
|---|---|---|---|---|---|---|---|---|---|---|---|
| 4 | 04/02 | — | 04/29 | 04/26 | 04/16 | — | — | 04/16 | 04/06 | — | — |
| 5 | 05/04 | 05/17 | 05/23 | 05/12 | 05/02 | — | 05/29 | — | — | — | 05/03 |
| 6 | 06/13 | — | 06/16 | 06/05 | — | — | — | 06/27 | 08/14 | 06/30 | 06/28 |
| 7 | 07/07 | 07/04 | — | — | — | 09/04 | 07/08 | 07/29 | — | — | — |
| 8 | 08/16 | — | — | — | — | — | — | — | — | 08/09 | — |
| 9 | 09/01 | 09/22 | — | 08/09 | — | — | — | 09/23 | — | 09/18 | — |
| 10 | 10/27 | 10/08 | 10/14 | — | — | — | — | — | — | — | 10/18 |
表4 MODIS影像数据集信息Tab.4 MODIS image dataset information |
| 月份 | 2002年 | 2004年 | 2006年 | 2008年 | 2010年 | 2012年 | 2014年 | 2016年 | 2018年 | 2020年 | 2022年 |
|---|---|---|---|---|---|---|---|---|---|---|---|
| 4 | — | 04/06 | — | — | — | 04/06 | 04/07 | — | — | 04/06 | 04/07 |
| 5 | — | — | — | — | — | 05/08 | — | 05/08 | 05/09 | 05/08 | — |
| 6 | — | 06/09 | — | — | 06/10 | 06/09 | 06/10 | — | — | — | — |
| 7 | — | — | 07/12 | 07/11 | 07/12 | — | — | — | 07/12 | 07/11 | 07/12 |
| 8 | — | 08/12 | 08/13 | 08/12 | 08/13 | 08/12 | 08/12 | 08/12 | 08/13 | — | 08/13 |
| 9 | — | — | 09/14 | — | 09/14 | 09/14 | 09/14 | — | 09/14 | — | 09/14 |
| 10 | — | — | — | 10/15 | 10/16 | 10/15 | 10/16 | 10/15 | 10/16 | 10/15 | — |
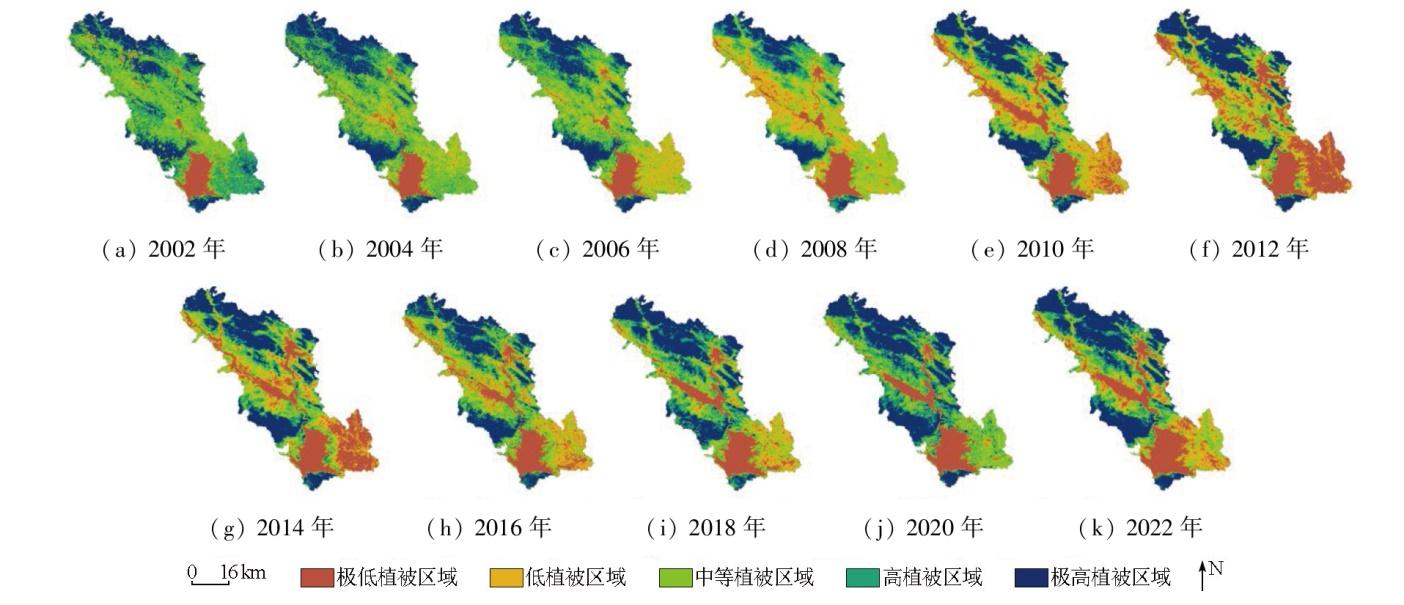
图5 2002—2022年间淅川县植被空间分布Fig.5 Spatial distribution of vegetation in Xichuan County from 2002 to 2022 |
图6 2002—2022年间淅川县FVC年际变化曲线Fig.6 Inter-annual variation curve of FVC in Xichuan County from 2002 to 2022 |
表5 淅川县植被空间分异性的风险因子探测结果Tab.5 Risk factor detection results of spatial variability of vegetation in Xichuan County |
| 驱动因子 | X1 | X2 | X3 | X4 | X5 | X6 |
|---|---|---|---|---|---|---|
| q值 | 0.234 | 0.175 | 0.259 | 0.152 | 0.359 | 0.302 |
表6 淅川县植被生长变化的驱动因素判断标准Tab.6 Criteria for determining the drivers of vegetation growth change in Xiechuan County |
| 变化趋势的 显著性 | 变化趋势的 正负 | 复相关性的 显著性 | 驱动因素的判断结果 |
|---|---|---|---|
| P≥0.05 | — | — | 未变化区域 |
| P<0.05 | Slope≥0 | P≥0.05 | 人为造成的退化 |
| P≥0.05 | 人为造成的改善 | ||
| Slope<0 | P<0.05 | 人为和气候造成的退化 | |
| P<0.05 | 人为和气候造成的改善 |
| [1] |
吴昌广, 周志翔, 肖文发, 等. 基于MODIS NDVI的三峡库区植被覆盖度动态监测[J]. 林业科学, 2012, 48(1):22-28.
|
| [2] |
李佳, 廉振强, 窦明, 等. 丹江库区水质时空分布特征及影响因素[J]. 南水北调与水利科技(中英文), 2023, 21(1):181-189.
|
| [3] |
肖玉娜, 程靖华, 莫晓聪, 等. 丹江口水库浮游植物群落时空变化及其与环境因子的关系[J]. 湖泊科学, 2023, 35(3):821-832.
|
| [4] |
崔囤月, 王世东, 张学军. 1991—2021年雄安新区土地利用与植被覆盖变化遥感研究[J]. 自然资源遥感, 2023, 35(4):214-225.doi:10.6046/zrzyyg.2022311.
|
| [5] |
|
| [6] |
|
| [7] |
钟安亚, 鲍铖, 胡春明. 生态修复视角下德兴市矿区NDVI时空动态变化监测研究[J]. 环境工程, 2024, 42(5):122-130.
|
| [8] |
|
| [9] |
缪丽娟, 张宇阳, 揣小伟, 等. 亚洲旱区草地NDVI对气候变化的响应及滞后效应[J]. 植物生态学报, 2023, 47(10):1375-1385.
|
| [10] |
王思, 张路路, 林伟彪, 等. 基于MODIS-归一化植被指数的广东省植被覆盖与土地利用变化研究[J]. 生态学报, 2022, 42(6):2149-2163.
|
| [11] |
彭文甫, 张冬梅, 罗艳玫, 等. 自然因子对四川植被NDVI变化的地理探测[J]. 地理学报, 2019, 74(9):1758-1776.
|
| [12] |
|
| [13] |
赵冬林, 朱仕荣. 2010—2021年金沙江干热河谷植被覆盖度时空变化及其影响因素[J]. 生态学杂志, 2024, 43(8):2373-2381.
|
| [14] |
刘雨亭, 王磊, 李谢辉, 等. 西南地区2000—2020年植被覆盖度时空变化与影响因素分析[J]. 高原气象, 2024, 43(1):264-276.
|
| [15] |
|
| [16] |
|
| [17] |
|
| [18] |
|
| [19] |
|
| [20] |
|
| [21] |
|
| [22] |
张玉琢, 杨志贵, 于红妍, 等. 基于STARFM的草地地上生物量遥感估测研究——以甘肃省夏河县桑科草原为例[J]. 草业学报, 2022, 31(6):23-34.
|
| [23] |
|
| [24] |
李苗苗, 吴炳方, 颜长珍, 等. 密云水库上游植被覆盖度的遥感估算[J]. 资源科学, 2004, 26(4):153-159.
|
| [25] |
卡米兰·阿布力克, 杨涵. 乌鲁木齐河流域植被覆盖度变化及驱动力研究[J]. 灌溉排水学报, 2024, 43(2):96-105.
|
| [26] |
郭发苗, 彭道黎, 王荫, 等. 基于多尺度2001—2020年河北省植被覆盖度的时空变化及归因分析[J]. 甘肃农业大学学报, 2025, 60(2):179-190,201.
|
| [27] |
王超, 侯鹏, 刘晓曼, 等. 中国重要生态系统保护和修复工程区域植被覆盖时空变化研究[J]. 生态学报, 2023, 43(21):8903-8916.
|
| [28] |
|
/
| 〈 |
|
〉 |