
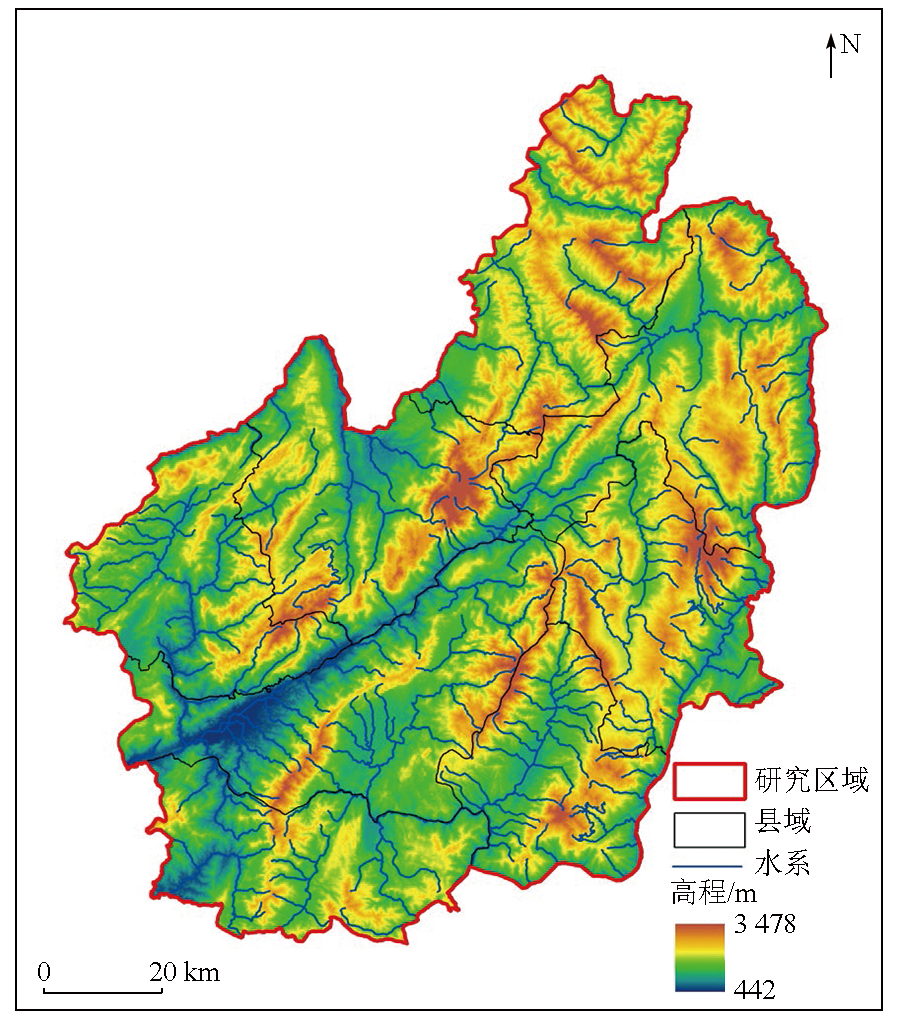
适应未来的山地城市可持续扩张绿色基础设施网络建设——以云南省临沧市为例
|
李健娥(1997-),女,硕士研究生,主要从事景观规划与生态环境保护研究。Email: 2522186246@qq.com。 |
Copy editor: 陈庆
收稿日期: 2023-11-14
修回日期: 2024-03-17
网络出版日期: 2026-06-03
基金资助
云南省教育厅科学研究基金“‘荒野智慧’下的西双版纳州生物多样性保护策略研究”(2023Y0754)
2021云南省专业学位研究生案例库建设项目“民族园林(传统村落保护规划)教学案例库”(编号: 云学位[2021]18号共同资助)
Construction of a green infrastructure network for sustainable expansion of mountain cities: A case study of Lincang City, Yunnan Province, China
Received date: 2023-11-14
Revised date: 2024-03-17
Online published: 2026-06-03
关键词: 绿色基础设施网络; MSPA-PLUS模型; 山地城市; 可持续扩张; 临沧市
李健娥 , 张云 . 适应未来的山地城市可持续扩张绿色基础设施网络建设——以云南省临沧市为例[J]. 自然资源遥感, 2025 , 37(2) : 173 -184 . DOI: 10.6046/zrzyyg.2023346
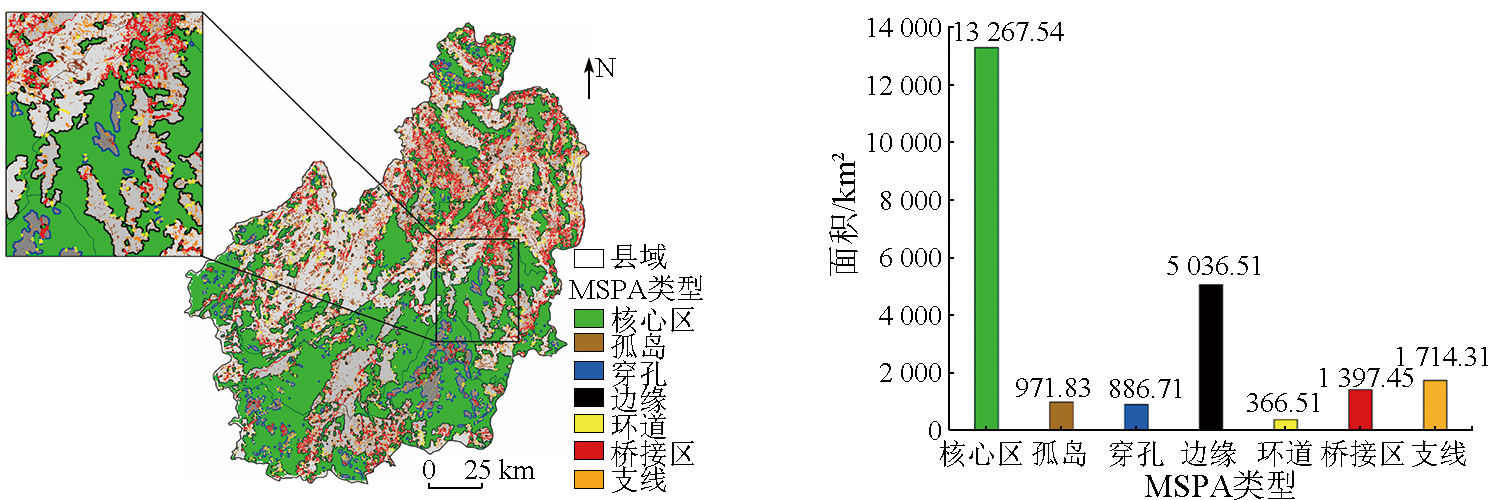
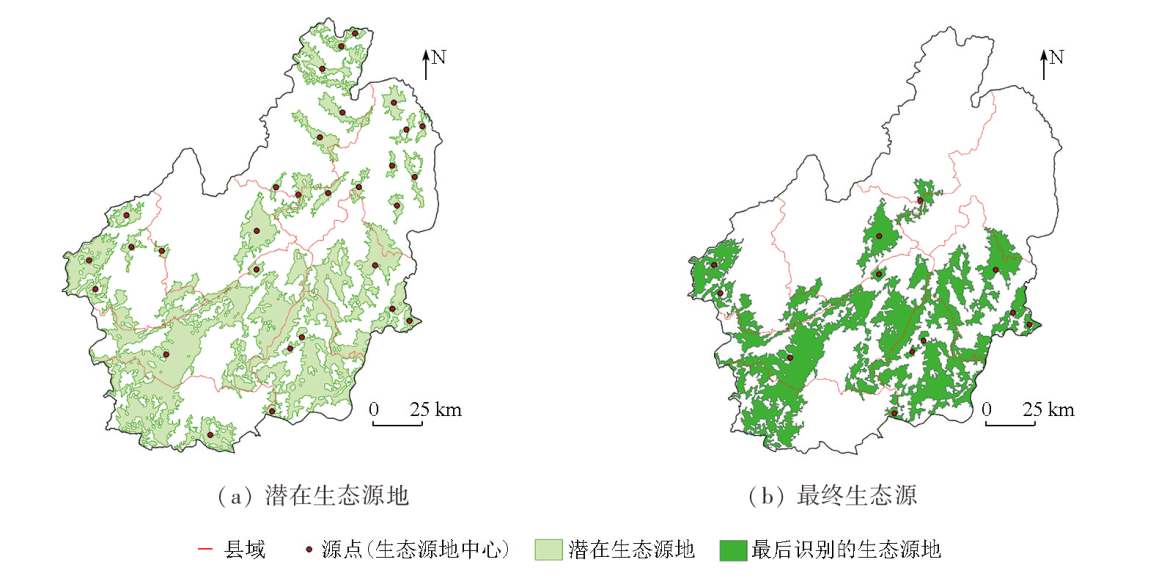
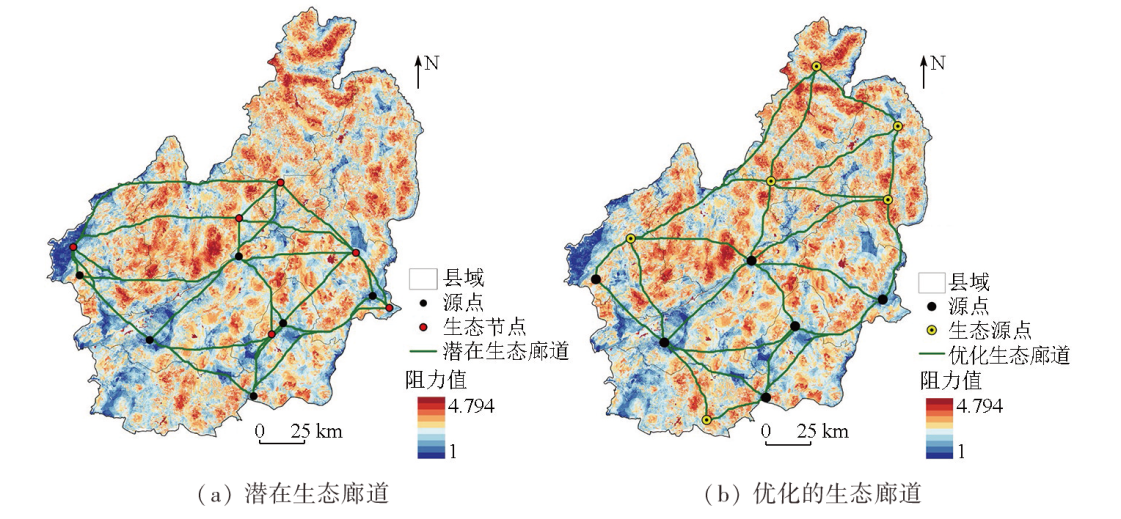
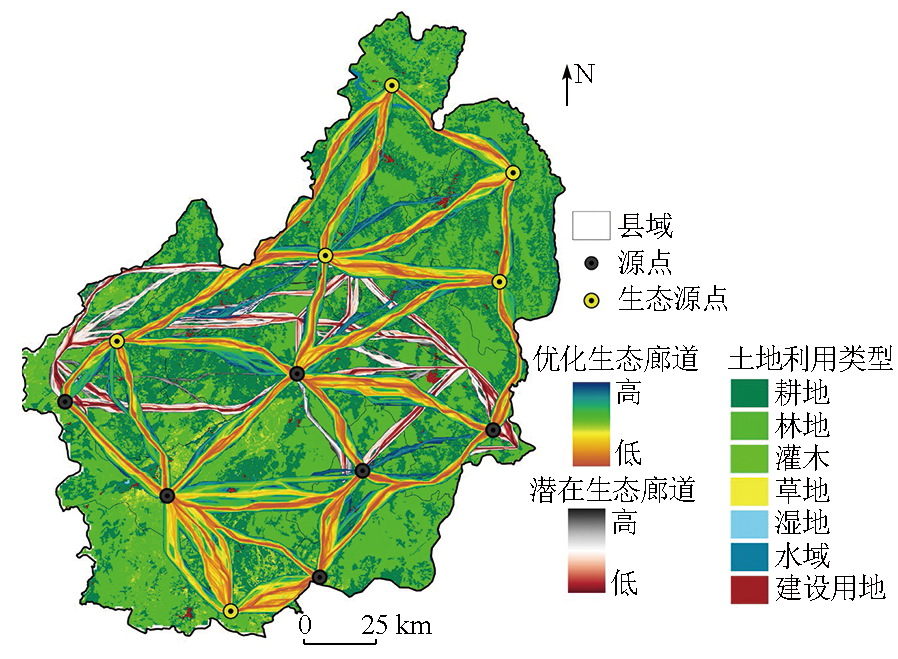
Constructing a regional green infrastructure (GI) network can alleviate the contradiction between land use and ecological development in the process of rapid urbanization, playing a significant role in future urban planning. This study investigated Lincang City, a typical mountain city in Southwest China. Employing the patch-generating land use simulation (PLUS) model, this study predicted the land use and land cover (LULC) in Lincang City in 2030 under the ecological priority scenario. Furthermore, this study extracted information about the ecological source areas and corridors by integrating the morphological spatial pattern analysis (MSPA), minimum cumulative resistance (MCR) model, and circuit theory. Finally, this study constructed an optimized GI network for 2030 adapted to the sustainable expansion of Lincang City. The results show that from 2020 to 2030, the construction land area in Lincang City is projected to expand by about 23 %, while forest land and grassland will decrease by 0.2 % and 1.3 %, respectively. The water area is expected to increase by 46.9 % under reasonable management and protection. The core zone of GI landscape elements will represent 56.12% of the total area, while the edges will make up 21.3%. The spurs, bridging zones, islets, perforations, and circuits will constitute the rest 22.6%. Under the sustainable urban expansion scenario, the GI scale remains overall stable, with a relatively scattered distribution in built-up areas. The optimized GI network will involve 12 ecological source areas and 24 ecological corridors. The GI network of Lincang City in 2030 constructed based on the MSPA-PLUS model strengthens the understanding of the GI network for the sustainable development of a mountain city, adapting to future urban development. This study provides novel insights into the urban planning of mountain cities including Lincang and critical implications for GI protection and regional ecological security maintenance.
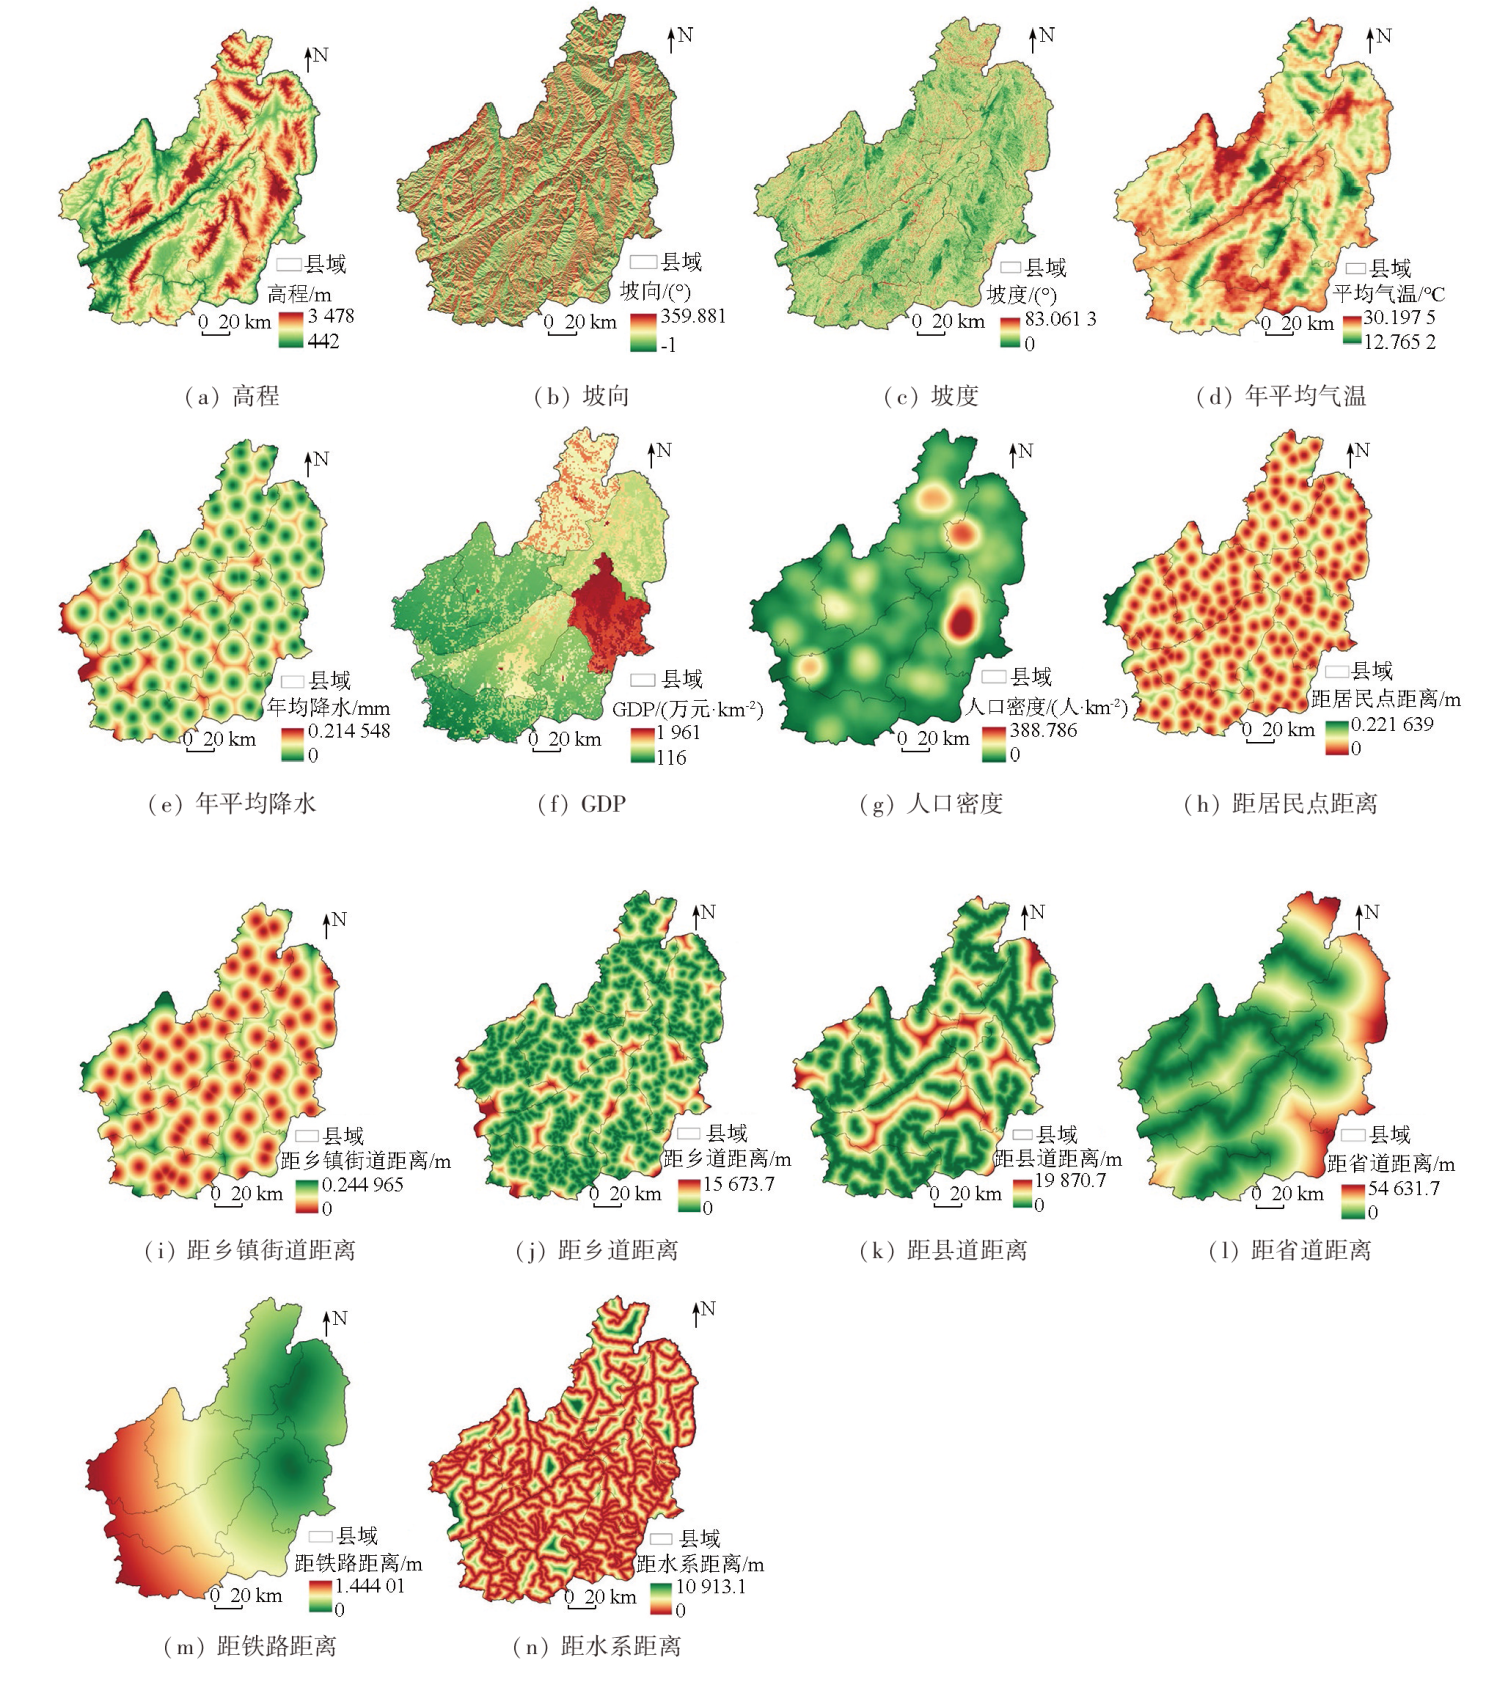
表1 数据介绍及来源Tab.1 Data introduction and source |
| 类别 | 数据 | 分辨率/m | 来源 |
|---|---|---|---|
| 自然因素 | 土地利用类型 | 30 | Global30 (http://www.globallandcover.com/) |
| 高程 | 地理空间数据云(http://www.gscloud.cn) | ||
| 坡度 | 基于DEM数据得到 | ||
| 坡向 | 基于DEM数据得到 | ||
| 年平均气温 | 1 000 | 资源环境科学与数据中心(https://www.resdc.cn/) | |
| 年平均降水 | |||
| 区位因素 | 省道距离 | 30 | 全国地理信息资源目录服务系统(https://www.webmap.cn/main.do?method=index) |
| 县道距离 | |||
| 乡道距离 | |||
| 铁路距离 | |||
| 居民点距离 | |||
| 水系距离 | |||
| 乡镇街道距离 | 30 | 国家统计局 | |
| 社会因素 | GDP | 1 000 | 资源环境科学与数据中心(https://www.resdc.cn/) |
| 人口密度 | 100 | 全国第七次人口普查 |
表3 阻力因子分级赋值及权重Tab.3 Resistance factor hierarchical assignment and weighting |
| 阻力因子 | 分级指标 | 阻力值 | 权重 |
|---|---|---|---|
| 地形起伏度/m | <20 | 1 | 0.153 1 |
| [20, 34) | 3 | ||
| [34, 50) | 5 | ||
| [50, 74) | 7 | ||
| [74, 666] | 9 | ||
| 坡度/(°) | <10.749 | 1 | 0.081 3 |
| [10.749, 18.24) | 3 | ||
| [18.24, 25.73) | 5 | ||
| [25.73, 35.17) | 7 | ||
| [35.17, 83.06] | 9 | ||
| 土地利用类型 | 林地/灌木 | 1 | 0.432 2 |
| 草地/耕地 | 3 | ||
| 水域 | 5 | ||
| 湿地 | 7 | ||
| 建设用地 | 9 | ||
| 与居民点距离/m | [10 777.7, 22 163.8) | 1 | 0.193 9 |
| [6 866.4, 10 777.7) | 3 | ||
| [4 780.4, 6 866.4) | 5 | ||
| [2 868.26, 4 780.4) | 7 | ||
| <2 868.26 | 9 | ||
| 与水体距离/m | [5 007.19, 10 913.11) | 1 | 0.103 |
| [3 338.12, 5 007.19) | 3 | ||
| [2 054.23, 3 338.12) | 5 | ||
| [941.52, 2 054.23) | 7 | ||
| <941.52 | 9 | ||
| 与道路距离/m | [5 697.67, 12 418) | 1 | 0.036 5 |
| [3 603.65, 569 7.67) | 3 | ||
| [2 142.7, 3 603.65) | 5 | ||
| [925.26, 2 142.7) | 7 | ||
| <925.26 | 9 |
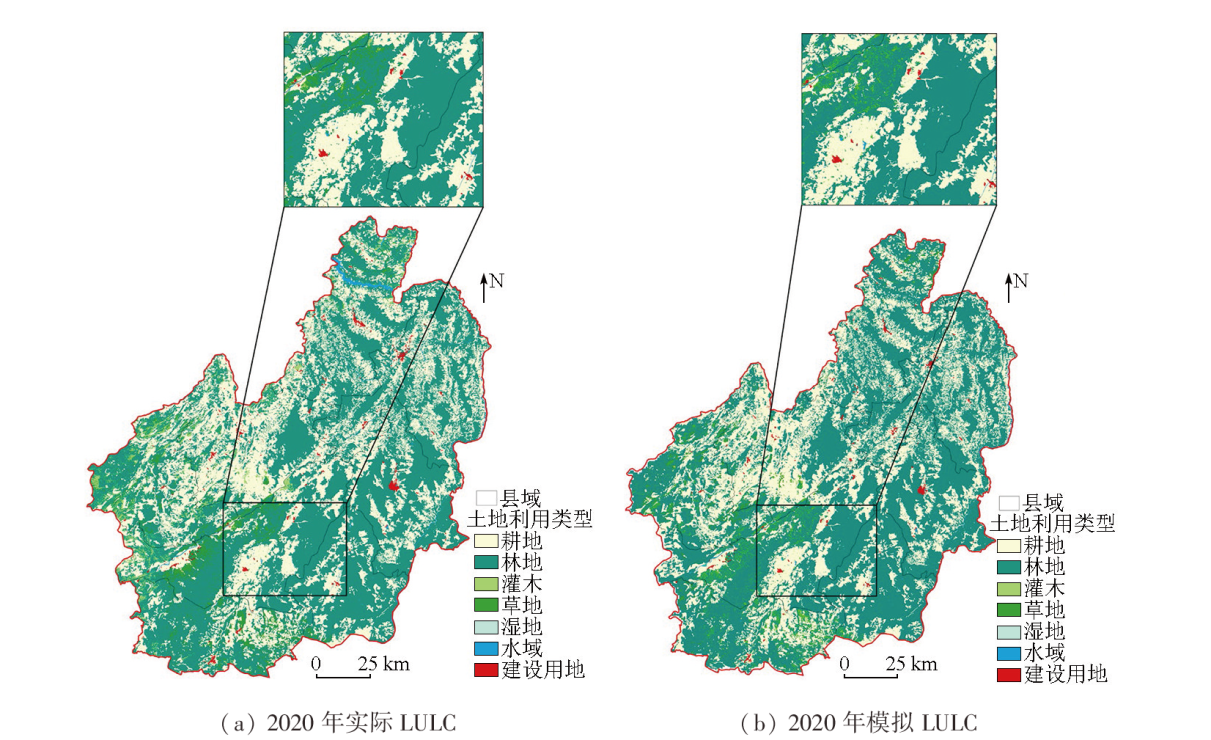
表4 2020年实际LULC与2020年模拟LULC转换矩阵Tab.4 Actual LULC in 2020 and simulated LULC in 2020 (km2) |
| 2020年实际 LULC | 2020年预测LULC | ||||||
|---|---|---|---|---|---|---|---|
| 耕地 | 林地 | 灌木 | 草地 | 水域 | 湿地 | 建筑用地 | |
| 耕地 | 439.468 | 24.206 | 1.373 | 1.201 | 0.002 | 2.054 | 2.267 |
| 林地 | 41.85 | 700.329 | 20.796 | 15.893 | 0 | 3.662 | 0.782 |
| 灌木 | 0.641 | 1.567 | 8.334 | 0.425 | 0 | 0.296 | 0.102 |
| 草地 | 1.311 | 7.987 | 0.618 | 13.357 | 0 | 0.037 | 0.057 |
| 水域 | 0.021 | 0 | 0 | 0 | 0.128 | 0.022 | 0 |
| 湿地 | 0.275 | 0.453 | 0.054 | 0.004 | 0.013 | 2.975 | 0.016 |
| 建筑用地 | 0.783 | 0.172 | 0.02 | 0.012 | 0 | 0.034 | 4.766 |
表5 各驱动因子的贡献Tab.5 Contribution of each driving factor |
| 驱动因子 | 耕地 | 林地 | 灌木 | 草地 | 水域 | 湿地 | 建筑用地 |
|---|---|---|---|---|---|---|---|
| 铁路距离 | 0.139 | 0.165 | 0.095 | 0.218 | 0.009 | 0.218 | 0.108 |
| GDP | 0.098 | 0.115 | 0.112 | 0.149 | 0.023 | 0.149 | 0.064 |
| 高程 | 0.091 | 0.120 | 0.162 | 0.060 | 0.761 | 0.060 | 0.018 |
| 省道距离 | 0.090 | 0.082 | 0.065 | 0.086 | 0.002 | 0.086 | 0.021 |
| 县道距离 | 0.080 | 0.055 | 0.036 | 0.038 | 0.022 | 0.038 | 0.299 |
| 年平均降水 | 0.073 | 0.053 | 0.026 | 0.073 | 0.019 | 0.073 | 0.078 |
| 年平均气温 | 0.071 | 0.071 | 0.091 | 0.090 | 0.041 | 0.090 | 0.299 |
| 人口密度 | 0.069 | 0.061 | 0.069 | 0.066 | 0.025 | 0.066 | 0.033 |
| 居民点距离 | 0.065 | 0.067 | 0.174 | 0.048 | 0.012 | 0.048 | 0.046 |
| 乡镇街道距离 | 0.064 | 0.051 | 0.073 | 0.041 | 0.013 | 0.041 | 0.209 |
| 乡道距离 | 0.060 | 0.048 | 0.030 | 0.035 | 0.008 | 0.035 | 0.037 |
| 水系距离 | 0.050 | 0.058 | 0.031 | 0.047 | 0.017 | 0.047 | 0.026 |
| 坡度 | 0.028 | 0.032 | 0.023 | 0.028 | 0.046 | 0.028 | 0.019 |
| 坡向 | 0.022 | 0.023 | 0.013 | 0.021 | 0.002 | 0.021 | 0.008 |
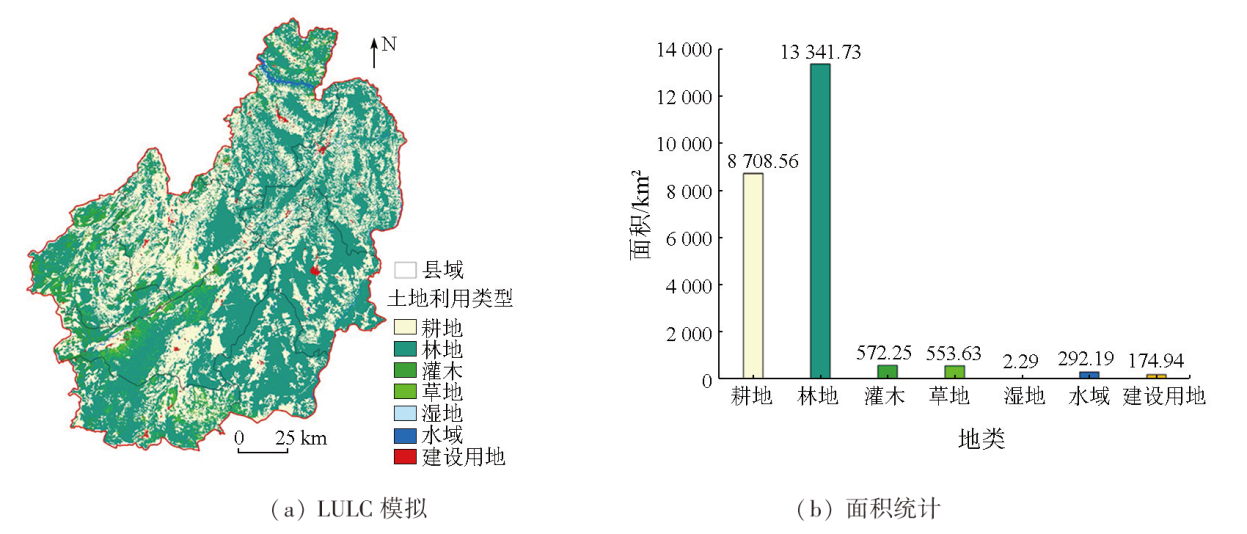
表6 2020年和2030年的LULCTab.6 LULC in 2020 and 2030 (km2) |
| LULC | 2020年 | 2030年 |
|---|---|---|
| 耕地 | 8 783.21 | 8 708.56 |
| 林地 | 13 368.66 | 13 341.73 |
| 灌木 | 588.94 | 572.25 |
| 草地 | 561.07 | 553.63 |
| 湿地 | 2.48 | 2.29 |
| 水域 | 198.90 | 292.19 |
| 建设用地 | 142.32 | 174.94 |
表7 生态源地的连通性分析Tab.7 Connectivity analysis of the ecological sources |
| 生态源地 | IIC | dPC | 面积/km2 |
|---|---|---|---|
| 28 | 59.192 67 | 66.281 86 | 2 226.609 66 |
| 29 | 31.441 32 | 35.356 68 | 2 135.334 02 |
| 25 | 24.325 80 | 26.007 96 | 151.839 31 |
| 22 | 19.335 24 | 21.656 50 | 87.248 11 |
| 27 | 16.216 41 | 19.930 38 | 25.001 09 |
| 26 | 15.584 89 | 17.100 31 | 20.459 06 |
| 23 | 13.704 60 | 15.128 40 | 439.284 98 |
| 24 | 12.494 35 | 12.984 15 | 39.251 32 |
| 21 | 9.941 41 | 11.331 57 | 310.181 37 |
| 20 | 11.845 72 | 10.377 36 | 33.911 14 |
| 14 | 2.884 15 | 3.066 77 | 138.058 89 |
| 19 | 2.823 52 | 2.772 68 | 291.161 51 |
| [1] |
|
| [2] |
|
| [3] |
|
| [4] |
|
| [5] |
|
| [6] |
|
| [7] |
|
| [8] |
|
| [9] |
|
| [10] |
|
| [11] |
蒋文伟, 孙鹏. 绿色基础设施理论研究——以慈溪市绿地系统规划为例[J]. 北京林业大学学报(社会科学版), 2012, 11(2):54-59.
|
| [12] |
裴丹. 生态保护网络化途径与保护优先级评价——“绿色基础设施” 精明保护策略[J]. 北京大学学报(自然科学版), 2012, 48(5):848-854.
|
| [13] |
丁金华, 孙琦, 钱晶. 基于MSPA-InVEST模型的水网乡村绿色基础设施网络构建研究——以吴江东北片区为例[J]. 西北林学院学报, 2022, 37(6):183-191.
|
| [14] |
何侃, 林涛, 吴建芳, 等. 基于空间优先级的福州市中心城区绿色基础设施网络构建[J]. 应用生态学报, 2021, 32(4):1424-1432.
|
| [15] |
费文君, 赵梦琴. 基于MSPA的南京市绿色基础设施网络构建[J]. 南京林业大学学报(自然科学版), 2022, 46(3):50-56.
|
| [16] |
袁逸敏, 李沛鸿, 熊凡. 基于MSPA与电路理论的赣州市绿色基础设施网络构建[J]. 安徽农业科学, 2023, 51(12):15-20.
|
| [17] |
陈炯臻, 季翔, 葛希辰, 等. 基于MSPA和空间句法的县域绿色基础设施网络时空格局演变分析: 以徐州市睢宁县为例[J]. 现代城市研究, 2022, 37(10):101-107.
|
| [18] |
于亚平, 尹海伟, 孔繁花, 等. 基于MSPA的南京市绿色基础设施网络格局时空变化分析[J]. 生态学杂志, 2016, 35(6):1608-1616.
|
| [19] |
陈晨, 徐威杰, 张彦, 等. 独流减河流域绿色基础设施空间格局与景观连通性分析的尺度效应[J]. 环境科学研究, 2019, 32(9):1464-1474.
|
| [20] |
于亚平, 尹海伟, 孔繁花, 等. 南京市绿色基础设施网络格局与连通性分析的尺度效应[J]. 应用生态学报, 2016, 27(7):2119-2127.
|
| [21] |
马银, 郑敏睿, 郑新奇, 等. 基于CA-Markov和MSPA的绿色基础设施预测与时空演变分析——以京津冀城市群为例[J]. 生态学报, 2023, 43(16):6785-6797.
|
| [22] |
杨朔, 苏昊, 赵国平. 基于PLUS模型的城市生态系统服务价值多情景模拟——以汉中市为例[J]. 干旱区资源与环境, 2022, 36(10):86-95.
|
| [23] |
|
| [24] |
舒晓艺. 南流江流域土地利用/覆被变化模拟研究[D]. 南宁: 南宁师范大学, 2021.
|
| [25] |
|
| [26] |
汪勇政, 李久林, 顾康康, 等. 基于形态学空间格局分析法的城市绿色基础设施网络格局优化——以合肥市为例[J]. 生态学报, 2022, 42(5):2022-2032.
|
| [27] |
田永莲. 基于MSPA和MCR模型的重庆中心城区绿色基础设施网络构建研究[D]. 重庆: 西南大学, 2022.
|
| [28] |
汪子茗, 吕梁, 汪峰. 基于多源数据的山地县域绿色基础设施网络构建及修复策略——以重庆市万州区为例[J]. 热带地理, 2024, 44(2):303-314.
|
| [29] |
赵海霞, 范金鼎, 骆新燎, 等. 绿色基础设施格局变化及其驱动因素——以南京市为例[J]. 生态学报, 2022, 42(18):7597-7611.
|
| [30] |
曹畅, 车生泉. 融合MCR模型的绿色基础设施适宜性评价——以上海市青浦区练塘镇为例[J]. 西北林学院学报, 2020, 35(6):304-312.
|
| [31] |
|
| [32] |
|
| [33] |
汪辉, 刘媛, 时艳, 等. 基于PLUS模型的溱湖国家湿地公园情景模拟与预测[J]. 浙江农林大学学报, 2023, 40(6):1311-1321.
|
| [34] |
牛统莉, 熊立华, 陈杰, 等. 基于PLUS模型的长江流域土地利用变化模拟与多情景预测[J]. 武汉大学学报(工学版), 2024, 57(2):129-141,151.
|
| [35] |
胡佶熹, 勒先文, 王卫林, 等. 基于PLUS-InVEST模型的江西省生态系统碳储量时空演变与预测[J]. 环境科学, 2024, 45(6):3284-3296.
|
| [36] |
|
/
| 〈 |
|
〉 |