
基于BFAST改进模型的沱江流域NDVI变化趋势及驱动力分析
|
钟旭珍(1993-), 女, 博士研究生, 讲师, 主要从事GIS与环境遥感研究。Email: zxzxuzhen@njtc.edu.cn。 |
Copy editor: 张仙
收稿日期: 2023-07-20
修回日期: 2023-11-20
网络出版日期: 2026-06-03
基金资助
四川省科技计划项目“基于时序遥感数据时-空-谱预测模型构建的森林扰动监测研究”(2023NSFSC0754)
资源与环境信息系统国家重点实验室开放基金项目(2022-30)
国家重点研发计划政府间国际科技创新合作重点专项“利用地理空间技术监测和评估土地利用/土地覆被变化对区域生态安全的影响”(2018YFE0184300)
沱江流域高质量发展研究中心项目“基于RS和GIS的沱江流域生态环境质量评价预测及修复对策研究”(TJGZL2022-15)
内江师范学院校级科研项目“沱江流域生态环境脆弱性评价及生态修复研究”(2022YB17)
内江师范学院科研创新团队项目(2021TD01)
Analysis of changing trends in NDVI and their driving forces in the Tuojiang River basin based on an improved BFAST model
Received date: 2023-07-20
Revised date: 2023-11-20
Online published: 2026-06-03
钟旭珍 , 吴瑞娟 . 基于BFAST改进模型的沱江流域NDVI变化趋势及驱动力分析[J]. 自然资源遥感, 2025 , 37(1) : 131 -141 . DOI: 10.6046/zrzyyg.2023216
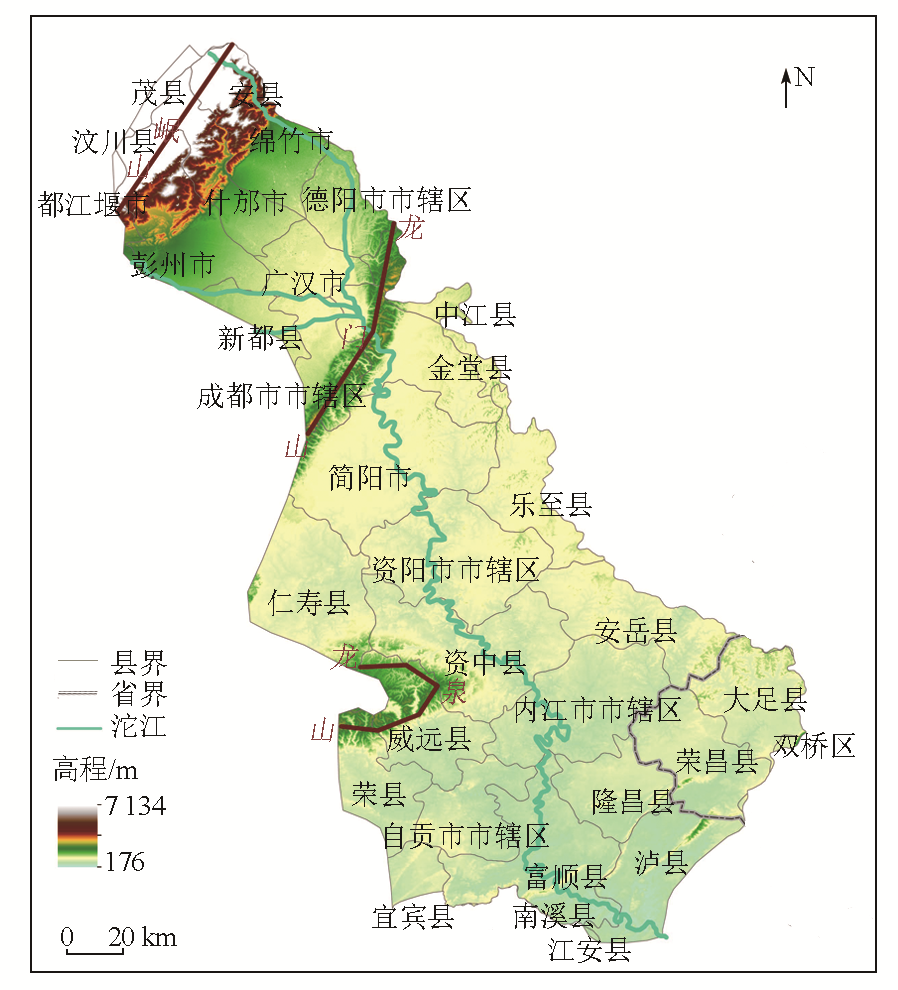
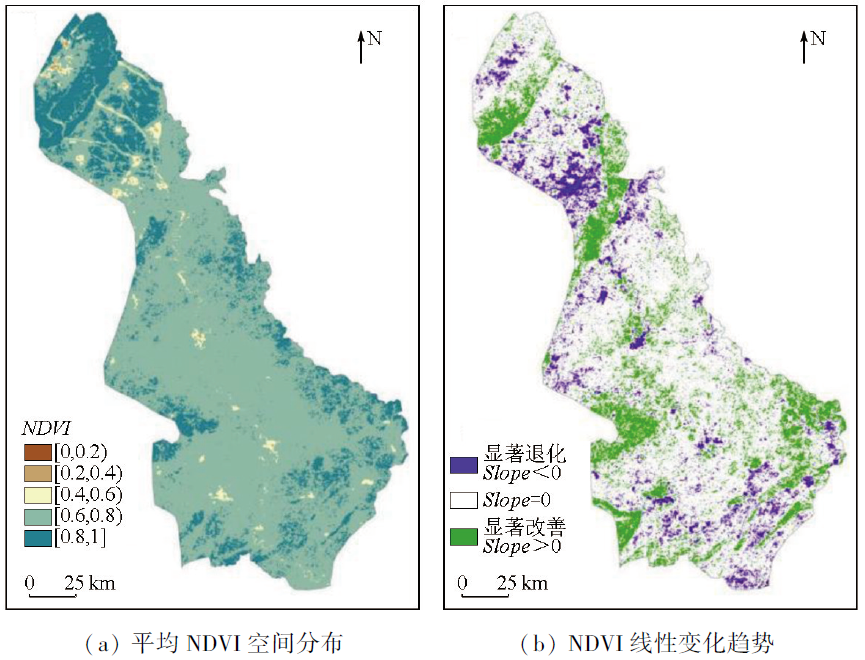
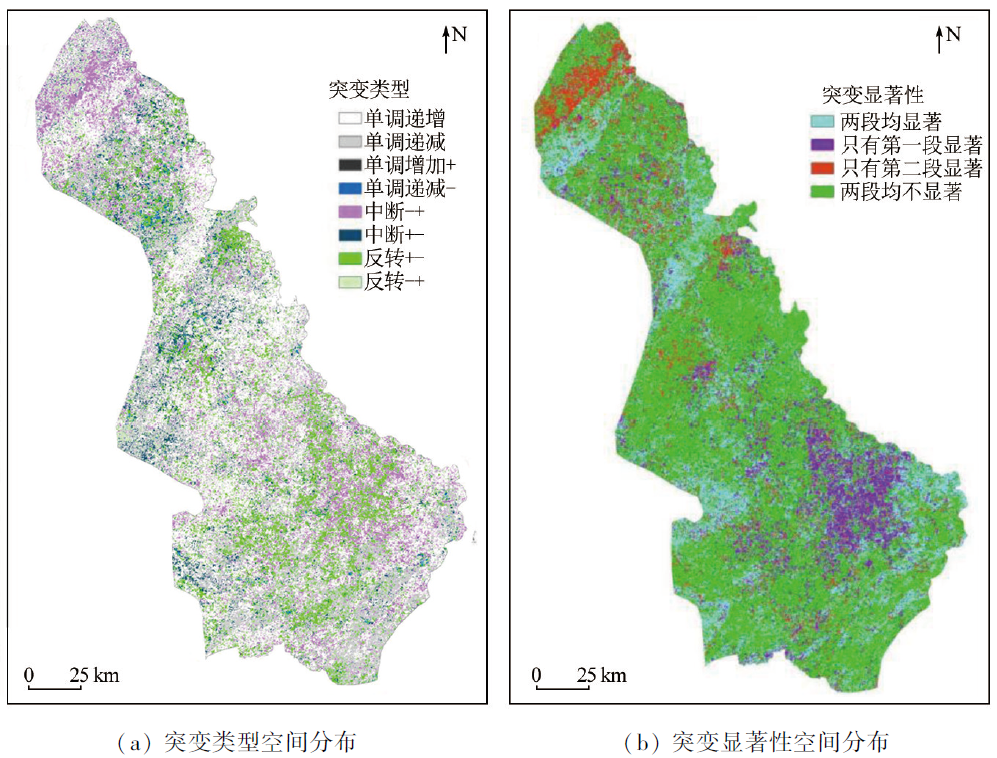
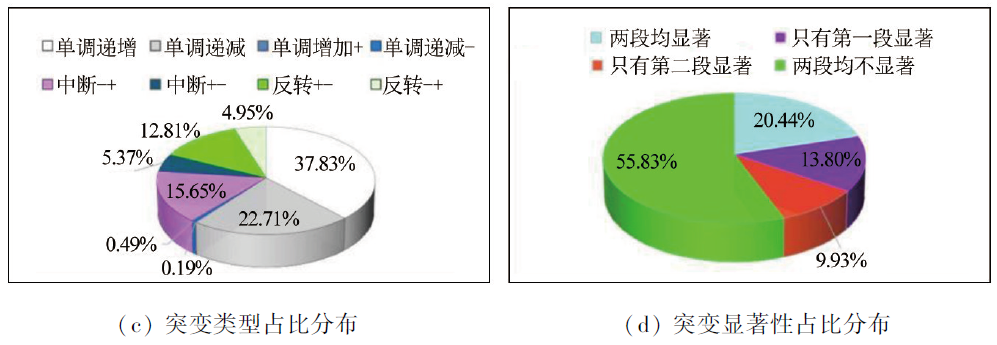
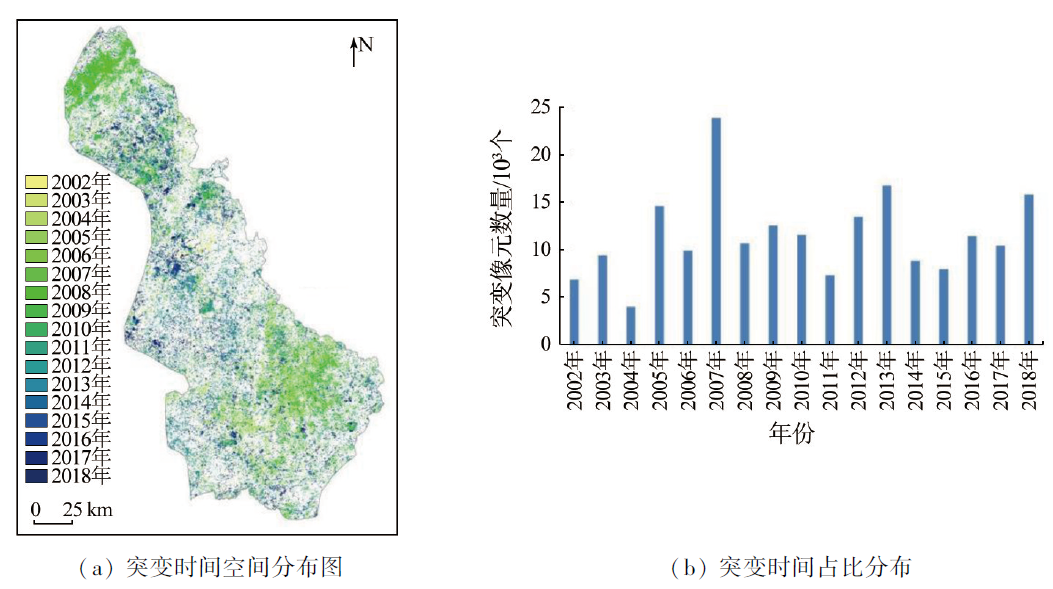
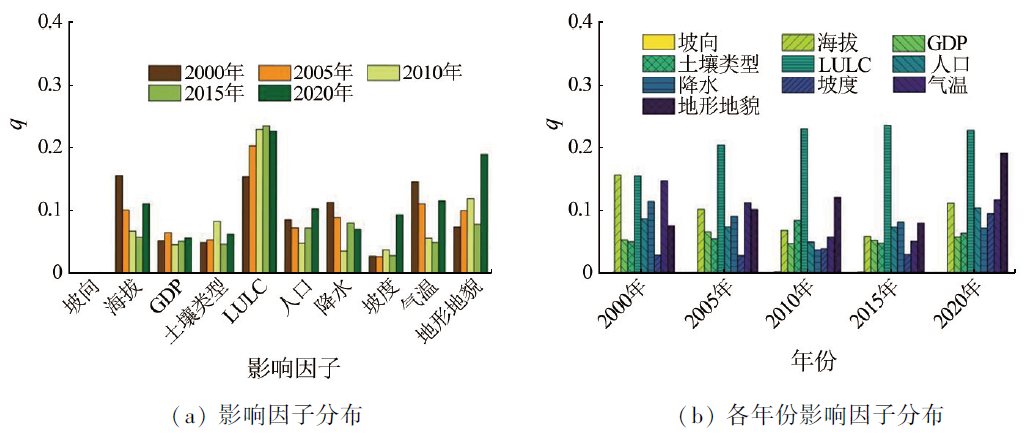
Vegetation, the main body of a terrestrial ecosystem, serves as an important indicator of environmental changes in a regional ecosystem. The Tuojiang River basin is an economically and industrially developed area in Sichuan. Dynamic vegetation monitoring and the analysis of factors driving its changes hold great significance for ecological change assessment and ecological protection. This study investigated the Tuojiang River basin. Based on MODIS data of normalized difference vegetation index (NDVI) from 2000 to 2021, this study detected, analyzed, and compared linear and nonlinear characteristics of the data, including mutation types and years, using linear regression Slope and an improved BFAST01 model. Additionally, this study explored the factors influencing the NDVI using the Optimal Parameters-based Geographic Detector (OPGD) model. The results indicate that more than 95% of the Tuojiang River basin exhibited NDVI values exceeding 0.6. The linear regression analysis for NDVI trends revealed that regions with significantly improved and significantly degraded vegetation coverage accounted for 18.07% and 10.60%, respectively, of the total area of the river basin, as indicated by image pixels. The BFAST01 nonlinear mutation analysis showed that the NDVI trends in the Tuojiang River basin over the 22 years can be categorized into eight mutation types, with the proportion of regions exhibiting improved vegetation coverage (58.62%) exceeding that of regions with degraded vegetation coverage (41.38%). These findings were consistent with the linear regression analysis, suggesting that the vegetation in the river basin was well protected in the 22 years. Mutations were concentrated between 2002 and 2018, with “interruption-+” and “reversal+-” representing the most common mutation types, accounting for 14.83% and 13.19%, respectively. In contrast, other mutation types exhibited a relatively even distribution across different stages. The results of the OPGD model revealed slight variations in the factors influencing NDVI across different years. Generally, the most influential factors included land use/land cover (LULC), elevation, and terrain and landforms, followed by meteorological factors such as temperature and precipitation. In contrast, other factors produced relatively minor impacts. Overall, despite some impacts, human factors like population and GDP exerted less influence on vegetation than natural factors in the Tuojiang River basin. Therefore, vegetation protection and restoration should consider the combined effects of both natural factors and anthropogenic activities.
Key words: NDVI; nonlinear trend; BFAST improved model; OPGD; Tuojiang River basin
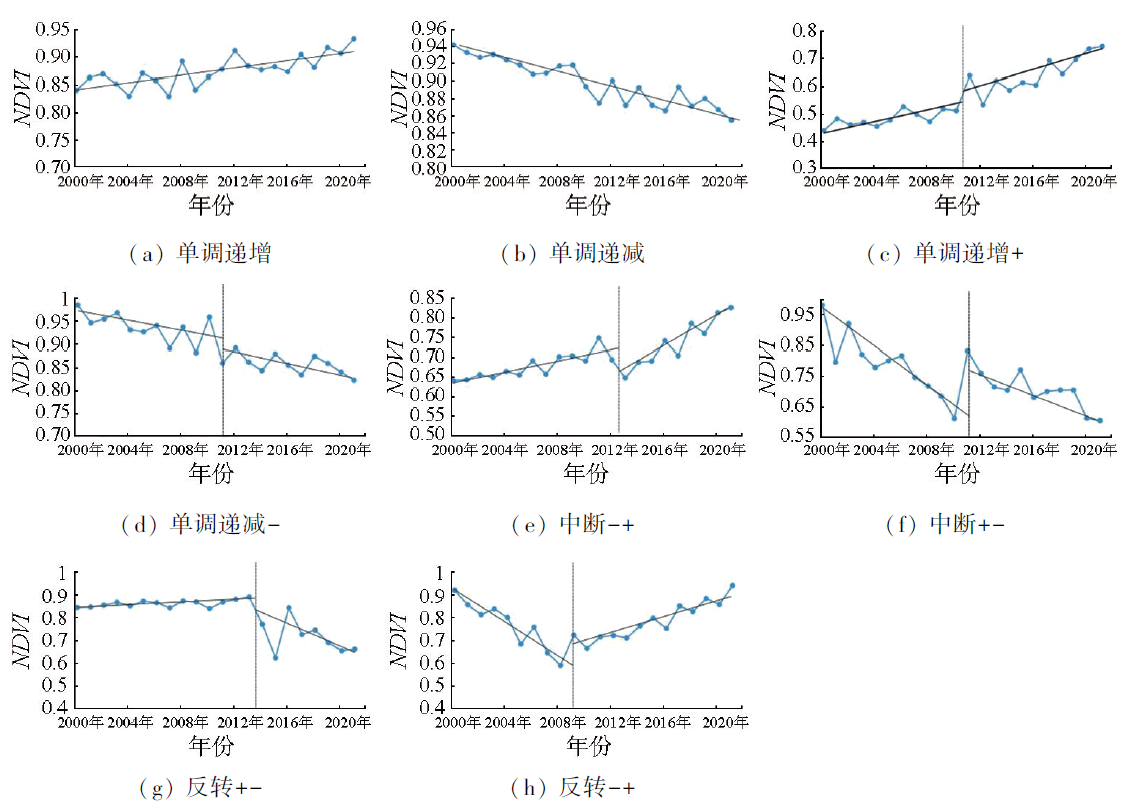
表1 BFAST01检测的NDVI变化趋势类型Tab.1 Types of NDVI change trends detected by BFAST01 |
| 序号 | 趋势类型名称 | 第一段 | 第二段 | 趋势类型含义 |
|---|---|---|---|---|
| 1 | 单调递增 | + | + | 未检测出明显突变,趋势整体表现为单调性增加 |
| 2 | 单调递减 | - | - | 未检测出明显突变,趋势整体表现为单调性减小 |
| 3 | 单调递增(带正中断) | + | + | 检测出1个明显突变,且断点处值突然增大,趋势整体表现为单调性增加,用符号“单调递增+”表示 |
| 4 | 单调递减(带负中断) | - | - | 检测出1个明显突变,且断点处值突然减小,趋势整体表现为单调性减小,用符号“单调递减-”表示 |
| 5 | 中断(随着负中断增加) | + | + | 检测出1个明显突变,且断点处值突然减小,趋势表现为显著增加,显著负中断,然后显著增加,用符号“中断-+”表示 |
| 6 | 中断(随着正中断减少) | - | - | 检测出1个明显突变,且断点处值突然增大,趋势表现为显著减小,显著正中断,然后显著减小,用符号“中断+-”表示 |
| 7 | 反转(由增到减) | + | - | 检测出1个明显突变,趋势表现为从显著增加转换为显著减小,用符号“反转+-”表示 |
| 8 | 反转(由减到增) | - | + | 检测出1个明显突变,趋势表现为从显著减小转换为显著增加,用符号“反转-+”表示 |
表2 地理探测器因子离散化方法与类别Tab.2 Discretization methods and categories of geographical detector factors |
| 变量名称 | 变量 | 2000年 | 2005年 | 2010年 | 2015年 | 2020年 | |||||
|---|---|---|---|---|---|---|---|---|---|---|---|
| 离散方法 | 类别数 | 离散方法 | 类别数 | 离散方法 | 类别数 | 离散方法 | 类别数 | 离散方法 | 类别数 | ||
| 海拔 | X1 | 自然间断点 | 12 | 自然间断点 | 12 | 自然间断点 | 12 | 自然间断点 | 12 | 自然间断点 | 10 |
| 坡度 | X2 | 几何间隔 | 12 | 自然间断点 | 12 | 自然间断点 | 12 | 自然间断点 | 12 | 自然间断点 | 11 |
| 坡向 | X3 | 手动 | 10 | 手动 | 10 | 手动 | 10 | 手动 | 10 | 手动 | 10 |
| 气温 | X4 | 自然间断点 | 10 | 相等间隔 | 12 | 相等间隔 | 11 | 相等间隔 | 12 | 自然间断点 | 11 |
| 降水 | X5 | 自然间断点 | 12 | 分位数 | 10 | 自然间断点 | 8 | 自然间断点 | 12 | 自然间断点 | 12 |
| 土壤类型 | X6 | 手动 | 16 | 手动 | 16 | 手动 | 16 | 手动 | 16 | 手动 | 16 |
| 地形地貌 | X7 | 手动 | 24 | 手动 | 24 | 手动 | 24 | 手动 | 24 | 手动 | 24 |
| LULC | X8 | 手动 | 6 | 手动 | 6 | 手动 | 6 | 手动 | 6 | 手动 | 6 |
| 人口 | X9 | 自然间断点 | 11 | 自然间断点 | 12 | 自然间断点 | 10 | 自然间断点 | 11 | 自然间断点 | 12 |
| GDP | X10 | 分位数 | 12 | 自然间断点 | 11 | 自然间断点 | 12 | 自然间断点 | 12 | 自然间断点 | 12 |
表3 各突变类型发生改变的年份分布Tab.3 Distribution of years of changes in different mutation types (%) |
| 突变时间 | 单调递增 | 单调递减 | 单调增加+ | 单调递减- | 中断-+ | 中断+- | 反转+- | 反转-+ | 合计 |
|---|---|---|---|---|---|---|---|---|---|
| 2002—2007年 | — | — | 0.31 | 0.10 | 14.08 | 4.45 | 12.59 | 3.58 | 35.11 |
| 2008—2013年 | — | — | 0.06 | 0.53 | 14.83 | 4.50 | 13.19 | 3.90 | 37.02 |
| 2014—2018年 | — | — | 0.11 | 0.62 | 10.73 | 4.66 | 6.68 | 5.07 | 27.88 |
| 合计 | — | — | 0.48 | 1.26 | 39.64 | 13.61 | 32.46 | 12.56 | 100 |
表4 线性与非线性趋势统计Tab.4 Linear and nonlinear trend statistics (%) |
| 线性 回归 | BFAST01 | |||||||
|---|---|---|---|---|---|---|---|---|
| 单调递增 | 单调递减 | 单调增加+ | 单调递减- | 中断-+ | 中断+- | 反转+- | 反转-+ | |
| 退化 | 0 | 54.33 | 0 | 1.18 | 12.82 | 7.98 | 15.88 | 7.81 |
| 改善 | 64.99 | 0 | 0.32 | 0 | 17.69 | 3.49 | 10.61 | 2.91 |
| [1] |
李雪银, 张志强, 孙爱芝. 1982—2021年黄河流域植被覆盖时空演变及影响因素研究[J]. 地球环境学报, 2022, 13(4):428-436.
|
| [2] |
|
| [3] |
王力, 赵思妍, 陈元鹏, 等. 基于GEE云平台的黄土高原生态修复区植被变化与归因[J]. 农业机械学报, 2023, 54(3):210-223.
|
| [4] |
|
| [5] |
陈文裕, 夏丽华, 徐国良, 等. 2000—2020年珠江流域NDVI动态变化及影响因素研究[J]. 生态环境学报, 2022, 31(7):1306-1316.
|
| [6] |
|
| [7] |
冯李. 金沙江流域植被覆盖度的遥感动态监测及其驱动机制研究[D]. 昆明: 云南师范大学, 2021.
|
| [8] |
孙金龙, 黄润秋. 切实履行生态环境保护职责不断开创新时代美丽中国建设新局面[N]. 人民日报,2022-11-21(11).
|
| [9] |
林妍敏, 李文慧, 南雄雄, 等. 基于地理探测器的宁夏贺兰山植被覆盖度时空分异及驱动因子[J]. 应用生态学报, 2022, 33(12):3321-3327.
|
| [10] |
孙美荣, 孙鹏森. 西南高山亚高山区植被活动变化的气候驱动效应与可持续性[J]. 水土保持研究, 2023, 30(3):240-250.
|
| [11] |
|
| [12] |
张兴航, 张百平, 王晶, 等. 神农架林区植被分布与地形的关系研究[J]. 地球信息科学学报, 2020, 22(3):482-493.
|
| [13] |
|
| [14] |
辛宇, 孙梦鑫, 张岳, 等. 2000—2020年四川省植被覆盖时空变化特征及其气候驱动因子[J]. 水土保持通报, 2022, 42(4):312-319.
|
| [15] |
|
| [16] |
|
| [17] |
王叶兰, 杨鑫, 郝利娜. 2001—2021年川西高原植被NDVI时空变化及影响因素分析[J]. 自然资源遥感, 2023, 35(3):212-220.doi:10.6064/zrzyyg.2022240.
|
| [18] |
|
| [19] |
|
| [20] |
罗爽, 刘会玉, 龚海波. 1982—2018年中国植被覆盖变化非线性趋势及其格局分析[J]. 生态学报, 2022, 42(20):8331-8342.
|
| [21] |
|
| [22] |
|
| [23] |
|
| [24] |
|
| [25] |
|
| [26] |
秦格霞, 吴静, 李纯斌, 等. 中国北方草地植被物候变化及其对气候变化的响应[J]. 应用生态学报, 2019, 30(12):4099-4107.
|
| [27] |
|
| [28] |
王劲峰, 徐成东. 地理探测器:原理与展望[J]. 地理学报, 2017, 72(1):116-134.
|
| [29] |
|
| [30] |
王巨. 基于时序NDVI植被变化检测与驱动因素量化方法研究——以河西地区为例[D]. 兰州: 兰州大学, 2020.
|
| [31] |
|
| [32] |
|
| [33] |
|
| [34] |
|
| [35] |
|
| [36] |
|
| [37] |
|
| [38] |
钟旭珍, 张素, 吴瑞娟, 等. 沱江流域土壤侵蚀动态变化及驱动力分析[J]. 水土保持研究, 2022, 29(2):43-49,56.
|
| [39] |
朱思佳, 冯徽徽, 邹滨, 等. 2000—2019年洞庭湖流域植被 NPP时空特征及驱动因素分析[J]. 自然资源遥感, 2022, 34(3):196-206.doi:10.6064/zrzyyg.2021283.
|
| [40] |
马炳鑫, 和彩霞, 靖娟利, 等. 1982—2019年中国西南地区植被变化归因研究[J]. 地理学报, 2023, 78(3):714-728.
|
/
| 〈 |
|
〉 |