
Determination of redox potential of uranium geological samples by potential difference method
|
ZHANG Jianmei,female,born in 1973,senior engineer,focusing on the analysis work of rocks and minerals. E-mail:1452303745@qq.com |
Received date: 2025-04-07
Revised date: 2025-04-22
Online published: 2025-11-06
Supported by
Uranium Investigation Project of China Nuclear Geology“Uranium mineral survey in Dulaota area,Chapchar County,Xinjiang(202305-1)
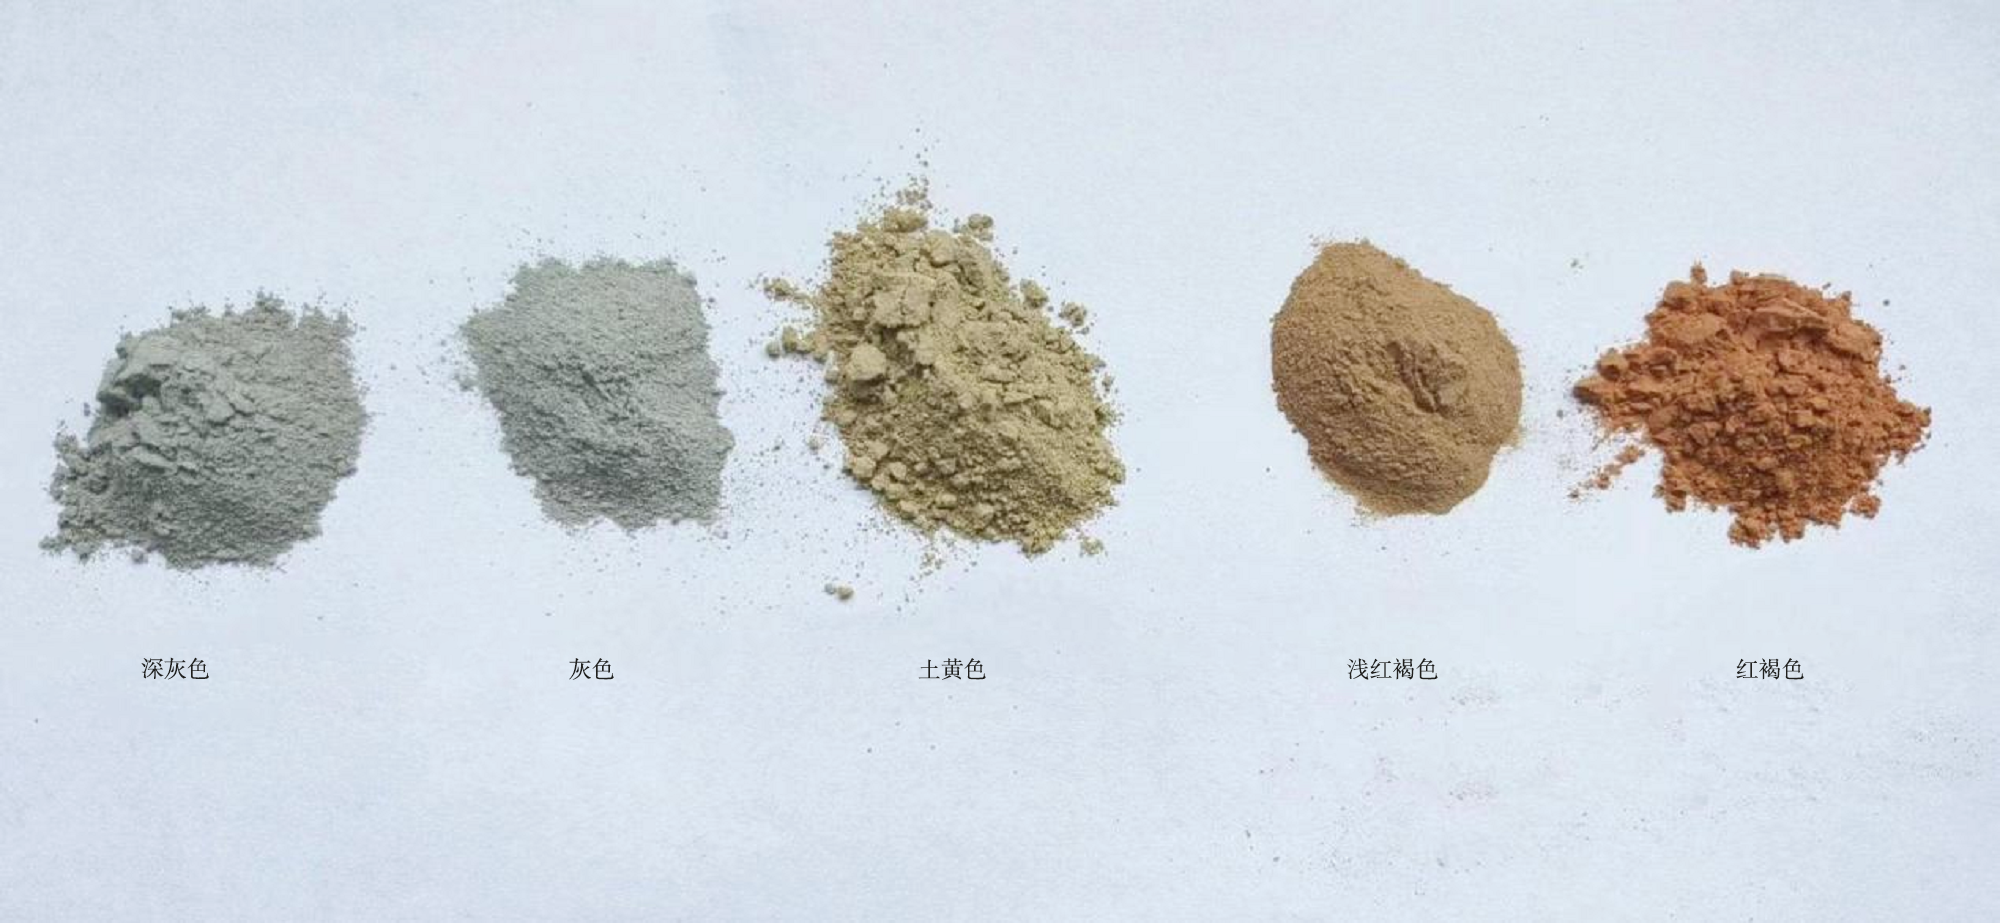
To accurately measure the oxidation-reduction potential of uranium ore geological samples, this study try to explore a better measurement method and experimental conditions by comparing and analyzing the application effects of the acidic potassium dichromate method and the alkaline potassium permanganate method in the measurement of the oxidation-reduction potential of uranium ore geological samples. The potential drop method was used to systematically conduct a multi-dimensional comparison between the acidic potassium dichromate method and the alkaline potassium permanganate method. The aspects of comparison included solution stability, optimal solution concentration, sample soaking time,solid - liquid ratio, and electrode equilibrium time. The sample soaking time and electrode equilibrium time of the alkaline potassium permanganate method are shorter than those of the acidic potassium dichromate method, allowing it to reach a stable and reliable potential value more quickly. For strongly reducing samples,the ΔEh value obtained by the acidic potassium dichromate method is larger. However, the evaluation conclusions of the two methods regarding the reduction ability of the samples are consistent. Nevertheless, the precision of the alkaline potassium permanganate method is better.The optimal experimental conditions for the alkaline potassium permanganate method are as follows: a concentration of 0.03 mol∙L-1, a sample soaking time of 1.5 h,a solid-liquid ratio of 1:25, an electrode equilibrium time of 5 min, a reaction medium of 0.2 % potassium hydroxide solution, and a temperature of (25±1) °C. The ΔEh value measured by this method is basically consistent with the judgment results of the oxidation - reduction environment by the oxidation coefficient method (Fe2+/Fe3+), and is also basically consistent with the color of the samples.Based on comprehensive experimental indicators, the overall performance of the alkaline potassium permanganate method is superior to that of the acidic potassium dichromate method in the measurement of the oxidation - reduction potential of uranium ore geological samples. By adopting the optimal experimental conditions, the accurate measurement of the oxidation - reduction potential of uranium geological samples is achieved, providing reliable technical support for uranium ore geological research.
ZHANG Jianmei , DENG Changsheng , QIAO Hao . Determination of redox potential of uranium geological samples by potential difference method[J]. World Nuclear Geoscience, 2025 , 42(3) : 647 -658 . DOI: 10.3969/j.issn.1672-0636.2025.03.015
表1 不同浓度碱性高锰酸钾溶液的稳定性Table 1 The stability of alkaline potassium permanganate solution with different concentrations |
| c/(mol∙L-1) | t/min | t/d | |||||||||||
|---|---|---|---|---|---|---|---|---|---|---|---|---|---|
| 10 | 20 | 30 | 60 | 120 | 240 | 1 | 2 | 3 | 4 | 5 | 6 | 7 | |
| 0.01 | 520 | 515 | 495 | 484 | 492 | 475 | 448 | 450 | 438 | 435 | 440 | 443 | 450 |
| 0.02 | 528 | 525 | 511 | 506 | 509 | 504 | 487 | 486 | 481 | 483 | 482 | 480 | 484 |
| 0.03 | 522 | 518 | 512 | 509 | 501 | 508 | 505 | 498 | 488 | 488 | 490 | 485 | 490 |
| 0.04 | 518 | 509 | 506 | 517 | 498 | 503 | 496 | 490 | 485 | 486 | 487 | 483 | 484 |
| 0.05 | 501 | 496 | 519 | 508 | 515 | 504 | 488 | 490 | 486 | 486 | 486 | 484 | 488 |
| 0.10 | 507 | 505 | 518 | 513 | 514 | 508 | 501 | 502 | 498 | 497 | 497 | 495 | 498 |
| 0.15 | 507 | 505 | 509 | 521 | 516 | 503 | 500 | 500 | 498 | 498 | 499 | 497 | 500 |
| 0.20 | 522 | 521 | 521 | 531 | 524 | 518 | 517 | 515 | 512 | 511 | 511 | 509 | 511 |
| 0.25 | 518 | 533 | 532 | 532 | 514 | 514 | 513 | 510 | 509 | 508 | 509 | 507 | 508 |
表2 不同浓度酸性重铬酸钾溶液的稳定性Table 2 The stability of acidic potassium dichromate solutions with different concentrations |
| c/(mol∙L-1) | t/min | t/d | |||||||||||
|---|---|---|---|---|---|---|---|---|---|---|---|---|---|
| 10 | 20 | 30 | 60 | 120 | 240 | 1 | 2 | 3 | 4 | 5 | 6 | 7 | |
| 0.02 | 934 | 975 | 989 | 990 | 999 | 1 008 | 1 001 | 995 | 994 | 988 | 996 | 989 | 986 |
| 0.03 | 978 | 993 | 1 000 | 1 003 | 1 011 | 1 018 | 1 013 | 1 013 | 1 016 | 1 015 | 1 012 | 1 014 | 1 009 |
| 0.04 | 981 | 998 | 1 004 | 1 005 | 1 005 | 1 017 | 1 018 | 1 014 | 1 019 | 1 017 | 1 015 | 1 012 | 1 014 |
| 0.05 | 987 | 996 | 1 002 | 1 008 | 1 016 | 1 023 | 1 022 | 1 019 | 1 025 | 1 018 | 1 018 | 1 015 | 1 017 |
| 0.06 | 991 | 1 010 | 1 011 | 1 012 | 1 017 | 1 025 | 1 028 | 1 027 | 1 029 | 1 026 | 1 025 | 1 020 | 1 019 |
| 0.07 | 990 | 1 003 | 1 003 | 1 008 | 1 005 | 1 020 | 1 024 | 1 019 | 1 019 | 1 021 | 1 020 | 1 019 | 1 017 |
| 0.08 | 992 | 1 007 | 1 006 | 1 009 | 1 011 | 1 021 | 1 024 | 1 018 | 1 022 | 1 020 | 1 021 | 1 015 | 1 018 |
| 0.09 | 992 | 1 010 | 1 008 | 1 010 | 1 013 | 1 020 | 1 024 | 1 021 | 1 023 | 1 022 | 1 019 | 1 018 | 1 020 |
| 0.10 | 993 | 1 007 | 1 005 | 1 006 | 1 009 | 1 019 | 1 025 | 1 021 | 1 023 | 1 021 | 1 022 | 1 021 | 1 019 |
| 0.15 | 1 000 | 1 007 | 1 007 | 1 013 | 1 015 | 1 020 | 1 026 | 1 022 | 1 025 | 1 024 | 1 021 | 1 020 | 1 019 |
| 0.20 | 1 001 | 1 008 | 1 010 | 1 017 | 1 019 | 1 021 | 1 027 | 1 021 | 1 028 | 1 025 | 1 025 | 1 022 | 1 023 |
| 0.25 | 1 010 | 1 015 | 1 016 | 1 017 | 1 018 | 1 026 | 1 028 | 1 027 | 1 030 | 1 028 | 1 023 | 1 029 | 1 024 |
表3 5个样品在不同浓度碱性高锰酸钾溶液下的最大ΔEhTable 3 The maximum ΔEh of five samples in alkaline potassium permanganate solutions with different concentrations |
| 编号 | c/(mol∙L-1) | ||||||||||||
|---|---|---|---|---|---|---|---|---|---|---|---|---|---|
| 0.002 | 0.005 | 0.01 | 0.02 | 0.03 | 0.04 | 0.05 | 0.06 | 0.07 | 0.08 | 0.09 | 0.10 | ||
| 样品1 | 58 | 58 | 63 | 70 | 76 | 74 | 71 | 68 | 63 | 58 | 49 | 46 | |
| 样品2 | 62 | 63 | 65 | 71 | 78 | 74 | 74 | 68 | 68 | 66 | 54 | 50 | |
| 样品3 | 58 | 61 | 63 | 66 | 73 | 73 | 71 | 67 | 66 | 62 | 49 | 42 | |
| 样品4 | 32 | 34 | 36 | 39 | 44 | 40 | 41 | 32 | 36 | 34 | 22 | 19 | |
| 样品5 | 28 | 30 | 28 | 30 | 33 | 30 | 30 | 28 | 27 | 30 | 16 | 12 | |
表4 样品不同浸泡时间的ΔEhTable 4 The ΔEh of the samples at different immersion times |
| t/h | 样品1/mV | 样品2 /mV | 样品3/mV | 样品4 /mV | 样品5/mV |
|---|---|---|---|---|---|
| 0.5 | 61 | 66 | 59 | 27 | 20 |
| 1.0 | 69 | 70 | 65 | 34 | 25 |
| 1.5 | 75 | 76 | 70 | 40 | 31 |
| 2.0 | 76 | 78 | 72 | 42 | 32 |
| 2.5 | 75 | 78 | 73 | 43 | 33 |
| 3.0 | 73 | 75 | 69 | 44 | 32 |
| 3.5 | 72 | 75 | 71 | 42 | 33 |
| 4.0 | 68 | 71 | 67 | 41 | 31 |
| 5.0 | 54 | 68 | 65 | 40 | 31 |
表5 样品2在不同1/6重铬酸钾浓度不同时间下的ΔEhTable 5 The ΔEh of sample 2 at different times under different concentrations of 1/6 potassium dichromate |
| t/h | c/(mol∙L-1) | ||||||||
|---|---|---|---|---|---|---|---|---|---|
| 0.05 | 0.06 | 0.07 | 0.08 | 0.09 | 0.10 | 0.12 | 0.15 | 0.20 | |
| 0.5 | 53 | 54 | 58 | 59 | 50 | 49 | 49 | 47 | 41 |
| 1.0 | 74 | 71 | 69 | 55 | 57 | 61 | 57 | 55 | 54 |
| 1.5 | 77 | 78 | 68 | 61 | 70 | 65 | 63 | 64 | 60 |
| 2.0 | 76 | 82 | 75 | 83 | 85 | 79 | 77 | 72 | 65 |
| 3.0 | 89 | 82 | 84 | 80 | 84 | 83 | 78 | 70 | 64 |
| 3.5 | 83 | 81 | 88 | 84 | 82 | 80 | 79 | 73 | 67 |
| 4.0 | 95 | 95 | 96 | 86 | 86 | 84 | 82 | 79 | 70 |
| 5.0 | 103 | 101 | 89 | 98 | 95 | 91 | 88 | 78 | 76 |
| 6.0 | 95 | 94 | 92 | 80 | 89 | 85 | 85 | 77 | 83 |
表6 样品3在不同1/6重铬酸钾浓度不同时间下的ΔEhTable 6 The ΔEh of sample 3 at different times under different concentrations of 1/6 potassium dichromate |
| t/h | c/(mol∙L-1) | ||||||||
|---|---|---|---|---|---|---|---|---|---|
| 0.05 | 0.06 | 0.07 | 0.08 | 0.09 | 0.10 | 0.12 | 0.15 | 0.20 | |
| 0.5 | 103 | 99 | 100 | 94 | 86 | 85 | 88 | 79 | 70 |
| 1.0 | 114 | 105 | 96 | 96 | 95 | 98 | 100 | 87 | 81 |
| 1.5 | 117 | 114 | 106 | 103 | 109 | 106 | 106 | 104 | 90 |
| 2.0 | 120 | 123 | 116 | 125 | 127 | 127 | 126 | 109 | 99 |
| 3.0 | 124 | 122 | 122 | 126 | 129 | 126 | 122 | 109 | 102 |
| 3.5 | 121 | 133 | 142 | 132 | 131 | 125 | 125 | 111 | 103 |
| 4.0 | 129 | 142 | 145 | 141 | 133 | 130 | 128 | 115 | 109 |
| 5.0 | 145 | 154 | 142 | 150 | 156 | 140 | 133 | 118 | 111 |
| 6.0 | 131 | 138 | 134 | 140 | 137 | 131 | 122 | 115 | 116 |
表7 样品6在不同1/6重铬酸钾浓度不同时间下的ΔEhTable 7 The ΔEh of sample 6 at different times under different concentrations of 1/6 potassium dichromate |
| t/h | c/(mol∙L-1) | ||||||||
|---|---|---|---|---|---|---|---|---|---|
| 0.05 | 0.06 | 0.07 | 0.08 | 0.09 | 0.10 | 0.12 | 0.15 | 0.20 | |
| 0.5 | 25 | 27 | 29 | 32 | 33 | 26 | 26 | 25 | 19 |
| 1.0 | 36 | 33 | 30 | 30 | 29 | 30 | 27 | 23 | 23 |
| 1.5 | 38 | 36 | 34 | 36 | 32 | 32 | 28 | 28 | 25 |
| 2.0 | 37 | 34 | 34 | 34 | 34 | 38 | 33 | 29 | 29 |
| 3.0 | 40 | 34 | 33 | 38 | 37 | 40 | 37 | 30 | 28 |
| 3.5 | 37 | 37 | 36 | 40 | 38 | 41 | 35 | 32 | 27 |
| 4.0 | 43 | 42 | 41 | 39 | 40 | 39 | 35 | 36 | 32 |
| 5.0 | 42 | 44 | 48 | 46 | 47 | 42 | 40 | 38 | 33 |
| 6.0 | 45 | 42 | 45 | 40 | 44 | 46 | 41 | 34 | 41 |
表8 碱性高锰酸钾固液比实验Table 8 Experiment on the solid - liquid ratio in the alkaline potassium permanganate method |
| 称样量/g | 20231695 | 20231678 | 20231679 | 空白 | |||
|---|---|---|---|---|---|---|---|
| Eh2/mV | ΔEh/mV | Eh2/mV | ΔEh/mV | Eh2/mV | ΔEh/mV | Eh1/mV | |
| 0.5 | 458 | 33 | 473 | 18 | 462 | 29 | 491 |
| 1.0 | 454 | 37 | 461 | 30 | 459 | 32 | 491 |
| 1.5 | 446 | 45 | 456 | 35 | 449 | 42 | 491 |
| 2.0 | 442 | 49 | 451 | 40 | 446 | 45 | 491 |
| 2.5 | 443 | 48 | 452 | 39 | 445 | 46 | 491 |
| 3.0 | 441 | 50 | 448 | 43 | 446 | 45 | 491 |
| 4.0 | 440 | 51 | 448 | 43 | 445 | 46 | 491 |
表9 酸性重铬酸钾固液比实验Table 9 Experiment on the solid-liquid ratio of acidic potassium dichromate |
| 称样量/g | 20231695 | 20231678 | 20231679 | 空白 | |||
|---|---|---|---|---|---|---|---|
| Eh2/mV | ΔEh/mV | Eh2/mV | ΔEh/mV | Eh2/mV | ΔEh/mV | Eh1/mV | |
| 0.5 | 997 | 26 | 1009 | 14 | 1007 | 16 | 1023 |
| 1.0 | 970 | 53 | 992 | 31 | 993 | 30 | 1023 |
| 1.5 | 970 | 53 | 992 | 31 | 988 | 35 | 1023 |
| 2.0 | 963 | 60 | 991 | 32 | 981 | 42 | 1023 |
| 2.5 | 964 | 59 | 990 | 33 | 982 | 41 | 1023 |
| 3.0 | 962 | 61 | 991 | 32 | 978 | 45 | 1023 |
| 4.0 | 957 | 66 | 989 | 34 | 978 | 45 | 1023 |
表10 不同时间下硫酸亚铁铵-硫酸铁铵标准溶液的Eh值Table 10 The Eh values of ammonium ferrous sulfate-ammonium ferric sulfate standard solutions at different times |
| t/min | 0 | 5 | 10 | 15 | 20 | 25 | 30 | 40 | 50 | 60 |
|---|---|---|---|---|---|---|---|---|---|---|
| Eh/mV | 448 | 476 | 475 | 475 | 476 | 475 | 476 | 476 | 476 | 476 |
表11 不同时间下碱性高锰酸钾溶液的Eh值Table 11 The Eh values of alkaline potassium permanganate solution at different times |
| t/min | 0 | 5 | 10 | 15 | 20 | 25 | 30 | 40 | 50 | 60 |
|---|---|---|---|---|---|---|---|---|---|---|
| Eh/mV | 475 | 433 | 432 | 431 | 431 | 431 | 431 | 431 | 431 | 431 |
表12 不同时间下重铬酸钾溶液的Eh值Table 12 The Eh values of potassium dichromate solution at different times |
| t/min | 0 | 5 | 10 | 15 | 20 | 25 | 30 | 40 | 50 | 60 |
|---|---|---|---|---|---|---|---|---|---|---|
| Eh/mV | 875 | 890 | 886 | 884 | 883 | 882 | 880 | 879 | 878 | 875 |
表13 两种方法测量样品ΔEh的对比Table 13 Comparison of ΔEh of samples measured by two methods |
| 序号 | 样品编号 | 样品颜色 | ΔEh(高锰酸钾法) | ΔEh(重铬酸钾法) |
|---|---|---|---|---|
| 1 | 20231679 | 灰色 | 47 | 78 |
| 2 | 20231695 | 灰色 | 50 | 100 |
| 3 | 20233629 | 灰白色 | 51 | 113 |
| 4 | 20233668 | 灰色 | 59 | 107 |
| 5 | 20233676 | 灰色 | 66 | 82 |
| 6 | 20233684 | 灰色 | 64 | 114 |
| 7 | 20238047 | 灰色 | 50 | 92 |
| 8 | 20234579 | 灰色 | 42 | 51 |
| 9 | 20233665 | 灰色 | 48 | 47 |
| 10 | 20233666 | 浅灰 | 43 | 49 |
| 11 | 20234569 | 灰白色 | 45 | 50 |
| 12 | 20238074 | 浅黄色 | 29 | 35 |
| 13 | 20233633 | 土黄色 | 28 | 13 |
| 14 | 20233637 | 深土黄色 | 17 | 12 |
| 15 | 20233643 | 土黄色 | 16 | 14 |
表14 碱性高锰酸钾法的精密度Table 14 The precision of alkaline potassium permanganate method |
| 样品编号 | 20233684 | 20231695 | 20233668 | 空白 |
|---|---|---|---|---|
| 测量次数 | 4 | 4 | 4 | 1 |
| 测量值/mV | 430、429、430、427 | 442、441、441、443 | 432、431、433、429 | 491 |
| ΔEh/mV | 61、62、61、64 | 49、50、50、48 | 59、60、58、62 | — |
| 相对标准偏差RSD/% | 3.7 | 3.5 | 4.8 | — |
表15 酸性重铬酸钾法的精密度Table 15 The precision of acidic potassium dichromate method |
| 样品编号 | 20233684 | 20231695 | 20233668 | 空白 |
|---|---|---|---|---|
| 测量次数 | 4 | 4 | 4 | 1 |
| 测量值/mV | 888、893、905、901 | 927、939、933、943 | 920、927、931、917 | 1027 |
| ΔEh | 134、139、122、126 | 100、88、94、84 | 107、100、96、110 | — |
| 相对标准偏差RSD/% | 11.1 | 13.9 | 11.7 | — |
表16 两种方法优缺点对比Table 16 Comparison of advantages and disadvantages of the two methods |
| 序号 | 比较项目 | 碱性高锰酸钾法 | 酸性重铬酸钾法 |
|---|---|---|---|
| 1 | 氧化剂稳定时间 | 3 d | 4 h |
| 2 | 灵敏度 | 相对低 | 高 |
| 3 | 稳定性 | 稳定(1 h内几乎不变) | 不稳定(数据会一直缓慢上升或下降) |
| 4 | 电极平衡时间 | 约5 min | ≥15 min |
| 5 | 样品稳定时间 | 1.5 h | 2 h |
| 6 | 工作效率 | 4.5 h/40个 | 5 h/20个 |
| 7 | 精密度 | RSD <5 % | RSD >10 % |
表17 碱性高锰酸钾法与氧化-还原系数法对氧化-还原环境的比较判断Table 17 Comparative judgment of redox environment by alkaline potassium permanganate method and redox coefficient method |
| 序号 | 样品编号 | 样品颜色 | 电位落差法 | 氧化-还原系数法 | ||
|---|---|---|---|---|---|---|
| ΔEh/mV | 环境判断 | Fe2+/Fe3+ | 环境判断 | |||
| 1 | 20233668 | 浅灰色 | 59 | 还原岩石带 | 1.50 | 还原环境 |
| 2 | 20233676 | 灰色 | 66 | 强还原带 | 1.46 | 还原环境 |
| 3 | 20233684 | 灰色 | 64 | 还原岩石带 | 1.33 | 还原环境 |
| 4 | 20231695 | 灰绿色 | 53 | 还原岩石带 | 1.12 | 弱还原环境 |
| 5 | 20238047 | 灰绿色 | 50 | 还原岩石带 | 1.03 | 弱还原环境 |
| 6 | 20231679 | 灰绿色 | 47 | 还原岩石带 | 1.18 | 弱还原环境 |
| 7 | 20233629 | 灰白色 | 51 | 还原岩石带 | 1.05 | 弱还原环境 |
| 8 | 20233665 | 浅灰色 | 48 | 还原岩石带 | 1.13 | 弱还原环境 |
| 9 | 20233666 | 灰色 | 43 | 氧化-还原过渡带 | 1.17 | 弱还原环境 |
| 10 | 20234579 | 灰色 | 42 | 氧化-还原过渡带 | 0.98 | 弱氧化环境 |
| 11 | 20234569 | 浅灰色 | 45 | 氧化-还原过渡带 | 0.95 | 弱氧化环境 |
| 12 | 20234521 | 灰色 | 37 | 氧化-还原过渡带 | 1.00 | 弱氧化环境 |
| 13 | 20234531 | 灰色 | 35 | 氧化-还原过渡带 | 0.96 | 弱氧化环境 |
| 14 | 20234532 | 灰色 | 35 | 氧化-还原过渡带 | 0.97 | 弱氧化环境 |
| 15 | 20234576 | 灰色 | 39 | 氧化-还原过渡带 | 1.01 | 弱氧化环境 |
| 16 | 20234640 | 浅灰色 | 38 | 氧化-还原过渡带 | 0.98 | 弱氧化环境 |
| 17 | 20238074 | 浅黄色 | 29 | 氧化-还原过渡带 | 0.70 | 氧化环境 |
| 18 | 20233633 | 褐黄色 | 28 | 氧化-还原过渡带 | 0.67 | 氧化环境 |
| 19 | 20233637 | 褐黄色 | 17 | 氧化岩石带 | 0.65 | 氧化环境 |
| 20 | 20233643 | 浅褐红色 | 16 | 氧化岩石带 | 0.17 | 氧化环境 |
| 1 |
袁富蕴, 刘峰. 测定电位差圈定火山岩富铀层位[J]. 四川大学学报(工程科学版), 2000, 32(5):29-31.
|
| 2 |
李晓红, 李盛富, 任满船, 等. 卡姆斯特地区水文地质条件与铀成矿关系[J]. 世界核地质科学, 2023, 40(1):51-57.
|
| 3 |
吉宏斌, 阳奕汉, 孙占学, 等. 地浸采铀过程中的矿层解堵增渗技术及现场应用[J]. 湿法冶金, 2017, 36(2):143-147.
|
| 4 |
孙占学, 刘金辉, 朱永刚, 等. 砂岩铀矿成矿过程与氧化-还原分带:铀系不平衡证据[J]. 地球科学——中国地质大学学报, 2004, 29(2):224-230.
|
| 5 |
张卫民, 刘金辉, 李学礼, 等. 水岩体系Eh-pH法在砂岩型铀矿层间氧化带划分中的应用——以新疆伊犁盆地512铀矿床为例[J]. 地球学报, 2003, 24(1):85-90.
|
| 6 |
电力行业电厂化学标准化技术委员会. 水的氧化-还原电位测量方法:DL/T 1480—2015[S]. 北京: 中国电力出版社, 2016.
Standardization Technical Committee of Power Plant Chemistry in the Electric Power Industry. Test method for oxidation-reduction potential of water:DL/T 1480—2015[S]. Beijing: China Electric Power Press, 1996 (in Chinese).
|
| 7 |
全国自然资源与国土空间规划标准化技术委员会. 地下水质分析方法第七部分:地下水Eh值的测定电位法:DZ/T0064.7—2021[S]. 北京: 地质出版社, 2021.
National Technical Committee on Standardization of Natural Resources and Territorial Spatial Planning. Methods for analysis of groundwater quality part 7:determination of oxidation reduction potential potential method:DZ/T0064.7—2021[S]. Beijing: Geological Publishing House, 2021 (in Chinese).
|
| 8 |
环境保护部. 土壤氧化-还原电位的测定法:HJ 746—2015[S]. 北京: 中国环境出版社, 2015.
Ministry of Environmental Protection. Soil-Determination of redox potential-Potential method:HJ 746—2015[S]. Beijing: China Environment Press, 2015 (in Chinese).
|
| 9 |
宋洪柱, 王东东, 刘建强, 等. 东胜矿区深部直罗组氧化-还原环境与砂岩型铀矿特征[J]. 中国煤炭地质, 2015, 27(7):55-61.
|
| 10 |
毛凌晨, 叶华. 氧化-还原电位对土壤中重金属环境行为的影响研究进展[J]. 环境科学研究, 2018, 31(10):1669-1676.
|
| 11 |
吴金浩, 刘桂英, 王年斌, 等. 辽东湾北部海域表层沉积物氧化-还原电位及其主要影响因素[J]. 沉积学报, 2012, 30(2):333-339.
|
| 12 |
余桂梁. 非碳酸盐岩样氧化-还原电位的测定法[J]. 铀矿地质, 1992, 18(1):57-59.
|
| 13 |
闵洁. 氧化-还原电位测定仪测得值的不确定度分析[J]. 计量与测试技术, 2019, 46(4):112-113.
|
| 14 |
张松豹, 曹月明. 沉积型赤铁矿、菱铁矿和黄铁矿氧化-还原电位测量及其地球化学意义[J]. 中国矿业大学学报, 1992, 21(2):59-64.
|
| 15 |
王娜, 王家松, 曾江萍, 等. 电位落差法测定砂岩型铀矿氧化-还原电位初探[J]. 地质调查与研究, 2019, 42(4):267-270+277.
|
| 16 |
王娜, 王家松, 曾江萍, 等. 重铬酸钾和高锰酸钾电位落差法测定砂岩型铀矿氧化-还原电位的探讨[J]. 岩矿测试, 2022, 41(5):806-814.
|
| 17 |
乔浩, 李鹏飞, 邓长生, 等. 电位落差法与氧化系数法对砂岩型铀矿氧化-还原环境判定研究[J]. 铀矿地质, 2022, 38(1):143-148.
|
| 18 |
全国国土资源标准化技术委员会地质矿产实验测试分技术委员会. 地质矿产实验室测试质量管理规范第2部分:岩石矿物分析试样制备:DZ/T 0130.2—2006[S]. 北京: 地质出版社, 2006.
Sub-technical Committee of Geological and Mineral Experimental Testing of the National Technical Committee on Land and Resources Standardization. The specification of testing quality management for geological laboratories-Part 2:Preparation of rock and mineral samples:DZ/T 0130.2—2006[S]. Beijing: Geological Publishing House, 2006 (in Chinese).
|
| 19 |
全国国土资源标准化技术委员会. 硅酸盐岩石化学分析方法第30部分:44个元素量测定GB/T 14506.30-2010[S]. 北京: 中国标准出版社, 2010.
National Technical Committee on Land and Resources Standardization. Methods for chemical analysis of silicate rocks-Part 30:Determination of 44 elements GB/T 14506.30-2010[S]. Beijing: Standard Press of China, 2010 (in Chinese).
|
| 20 |
刘筱雪, 方帷, 李晓, 等. 氧化还原电位去极化法及铂电极直接测定法对比研究[J]. 分析科学学报, 2017, 33(6):851-854.
|
| 21 |
袁建, 孙进, 李博文, 等. 超低稀释比熔融制样X射线荧光光谱法测定铀矿石中主次量元素[J]. 世界核地质科学, 2024, 41(4):817-823.
|
/
| 〈 |
|
〉 |