Research article

Wind and sand control in composite shelterbelts combining Cyperus esculentus with trees and shrubs: Evidence from wind tunnel and field studies

  • NIE Bixia 1, 2, 3, 4 ,
  • SHEN Xin 1, 2, 3, 4 ,
  • LIU Yalan 1, 2, 3, 4 ,
  • LI Xiangyi , 1, 2, 3, 4, *
Expand
  • 1 Xinjiang Key Laboratory of Desert Plant Roots Ecology and Vegetation Restoration, Xinjiang Institute of Ecology and Geography, Chinese Academy of Sciences, Urumqi 830011, China
  • 2 Cele National Station of Observation and Research for Desert-Grassland Ecosystems, Cele 848300, China
  • 3 State Key Laboratory of Ecological Safety and Sustainable Development in Arid Lands, Urumqi 830011, China
  • 4 University of Chinese Academy of Sciences, Beijing 100049, China
*LI Xiangyi (E-mail: )

Received date: 2025-05-06

  Revised date: 2025-08-19

  Accepted date: 2025-08-25

  Online published: 2026-03-12

Abstract

Cyperus esculentus (C. esculentus), a desert-adapted plant species with both ecological and economic value, has been widely cultivated in northern China's sandy regions. However, limited studies have investigated the performance of composite shelterbelts that integrate C. esculentus. This study systematically evaluated five shelterbelt models—Populus euphratica (P. euphratica), P. euphratica-C. esculentus composite, P. euphratica-nylon net-C. esculentus composite, Tamarix chinensis (T. chinensis), and T. chinensis-C. esculentus composite—using wind tunnel experiments and field observations. Sediment flux was measured at a normalized downwind distance (x/h) of 5, where x refers to the distance from the front edge (upwind side) of the shelterbelt for upwind measurements, and the distance from the rear edge (downwind side) for downwind measurements, and h represents the canopy height. Wind velocity was measured at x/h of -2, -1, 1, 2, 3, 5, and 7, and sand flux was measured at x/h=5, under initial wind velocities of 8.0 and 12.0 m/s. The results indicated that the P. euphratica-nylon net-C. esculentus composite was the most effective in reducing wind velocity, followed by the P. euphratica-C. esculentus composite. In contrast, the P. euphratica and T. chinensis exhibited relatively weaker wind reduction capabilities. Regarding sand flux, under moderate wind velocity (8.0 m/s), both the P. euphratica-C. esculentus composite and P. euphratica-nylon net-C. esculentus composite demonstrated the lowest sand flux values. However, under high wind velocity (12.0 m/s), the P. euphratica-nylon net-C. esculentus composite significantly outperformed the other shelterbelt models in sand retention, highlighting its superior windbreak and sand fixation efficacy. Field observations further validated the windbreak and sand fixation effects of C. esculentus. Comparisons between the bare sand plot and C. esculentus plot within protective forests demonstrated that planting C. esculentus can provide substantial ecological benefits in windbreak and sand-fixation. These findings, reinforced by field observations, strengthen the wind tunnel experiment results and highlight the critical role of C. esculentus in enhancing the performance of composite shelterbelts for desert ecological restoration.

Cite this article

NIE Bixia , SHEN Xin , LIU Yalan , LI Xiangyi . Wind and sand control in composite shelterbelts combining Cyperus esculentus with trees and shrubs: Evidence from wind tunnel and field studies[J]. Journal of Arid Land, 2026 , 18(2) : 263 -279 . DOI: 10.1016/j.jaridl.2026.02.004

1 Introduction

Desertification is a major global environmental challenge, affecting more than 40.0% of the world's land area and exhibiting varying degrees of severity across dryland regions (Gui et al., 2024). It leads to land degradation, ecosystem collapse, and disrupts sustainable development in local communities (D'Ettorre et al., 2024). Among the key drivers of desertification, wind erosion and dust storms are particularly prominent in drylands, contributing substantially to soil loss and atmospheric dust loading. Vegetation plays a crucial role in controlling these processes by reducing wind velocity, increasing surface roughness, and intercepting sediment transport (Okin, 2008; Dupont et al., 2015). Several studies have demonstrated that vegetation cover and spatial configuration significantly influence threshold shear velocity and sediment flux, thereby mitigating aeolian processes (King et al., 2005; Fu, 2019; Pi et al., 2020).
While current control strategies—such as revegetation, artificial cover, and sand dune fixation—have achieved notable successes in mitigating desertification (Li et al., 2013; Salvati, 2014; Jiang et al., 2024), most efforts primarily focus on ecological restoration, with limited consideration of economic sustainability in evaluation frameworks. As a result, balancing ecological rehabilitation with economic viability remains a critical challenge. Developing integrated strategies that simultaneously mitigate desertification and enhance economic benefits is essential for ensuring the long-term success of restoration efforts. Addressing this issue has become a priority for achieving sustainable land management and environmental protection.
Cyperus esculentus (C. esculentus), a desert-adapted species, offers considerable potential for addressing both ecological and economic aspects of desertification control (Du et al., 2023; Shen et al., 2024). It effectively reduces wind erosion, stabilizes sandy soils, and provides economic returns through its seeds and tubers, which are commercially valuable products (Aydar et al., 2020; Liu et al., 2022). These attributes make C. esculentus highly suitable for large-scale cultivation on degraded lands. Although recent studies have explored its biological traits and bioactive components, such as the review on the biological and bioactive components of C. esculentus (Barrett, 2024), there is still limited research on integrating C. esculentus with different types of shelterbelts to enhance the overall stability and multifunctionality of protective ecosystems.
Traditional shelterbelt, typically composed of a single tree or shrub species, often exhibits limited long-term effectiveness in harsh desert environments due to low resilience and slow canopy recovery (Li et al., 2022; Zhang et al., 2024). Integrating C. esculentus with existing shelterbelt species could enhance shelterbelt stability, improve near-surface wind control, and simultaneously provide economic benefits. However, the effectiveness of such composite shelterbelts remains poorly understood, particularly in extreme arid areas like the Taklimakan Desert in China.
Against this backdrop, the Taklimakan Desert, the largest desert located along the southern edge of the Tarim Basin in China, is a priority area for desertification control (Wang et al., 2022). The region experiences extreme aridity, frequent sandstorms, and high temperatures (Jiang et al., 2022; Li et al., 2023), contributing to severe sand erosion and land degradation that threaten environmental stability and socioeconomic development in Xinjiang Uygur Autonomous Region, China (Yang et al., 2021). Wind-driven sand erosion not only accelerates soil loss and vegetation mortality but also depletes soil fertility, rendering previously arable land unproductive (Miri et al., 2018). These impacts pose significant challenges to the sustainability of agriculture while also affecting human health, infrastructure, and transportation (Hou et al., 2024). Investigating protective systems for C. esculentus cultivation in Taklimakan Desert holds ecological significance and offers potential strategies for local economic development.
In this study, we investigated how integrating C. esculentus into different shelterbelts affects wind velocity and sand transport. Using both wind tunnel experiments and field observations in the southern Taklimakan Desert, we compared the windbreak effectiveness of five typical shelterbelt configurations. Our aim was to assess whether composite shelterbelts involving C. esculentus can enhance near-surface wind reduction and sand retention compared to traditional tree or shrub shelterbelts, and to explore their potential in improving both ecological function and land-use value in desert ecosystems.

2 Materials and methods

This study combined wind tunnel experiments with field observations to evaluate the wind erosion control efficacy of composite shelterbelts integrating C. esculentus with trees or shrubs. Field measurements provided site-specific environmental parameters and were used to validate the wind tunnel results.

2.1 Wind tunnel experiments

2.1.1 Experimental setup

We conducted the wind tunnel experiments in August 2024 at the Mosuowan Research Station, located in the western edge of the Gurbantunggut Desert in the Junggar Basin of China. The closed-circuit wind tunnel used has a cross-section of 1.3 m×1.0 m and a total length of 16.2 m, capable of generating wind velocities from 0.0 to 20.0  m/s. The airflow exhibited high stability, with a stability coefficient below 1.0%, lateral inhomogeneity less than 2.5%, and turbulence intensity around 1.0%.
A diffuser structure was used, featuring a sidewall diffusion angle of 0.2° and boundary layer thicknesses of approximately 15.0 cm for floor and 10.0 cm for sidewalls. The initial wind velocity at the tunnel entrance was measured using a hot-wire anemometer (Model 8455-300-1; TSI Incorporated, Shoreview, USA) with range of 0.0-20.0 m/s and accuracy of ±0.5%.

2.1.2 Shelterbelt configurations

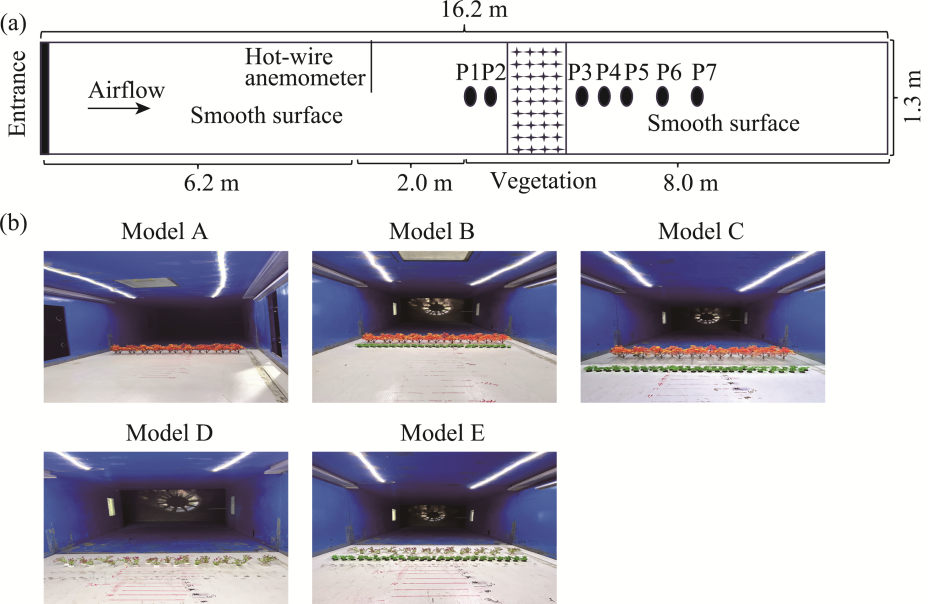
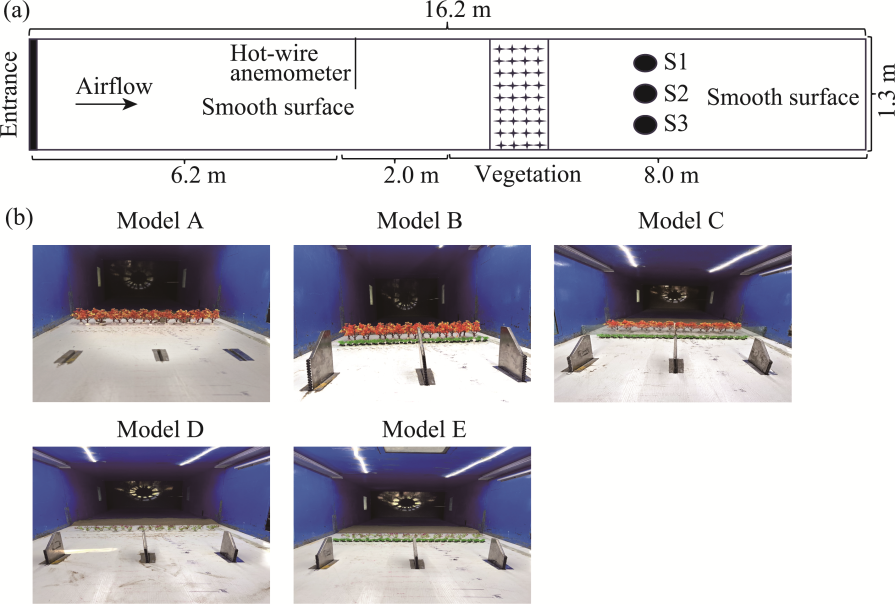
This study tested five shelterbelt configurations at wind velocities of 8.0 and 12.0 m/s. The five shelterbelt models A-E are Populus euphratica (P. euphratica), P. euphratica-C. esculentus composite, P. euphratica-nylon net-C. esculentus composite, Tamarix chinensis (T. chinensis), and T. chinensis-C. esculentus composite, respectively.
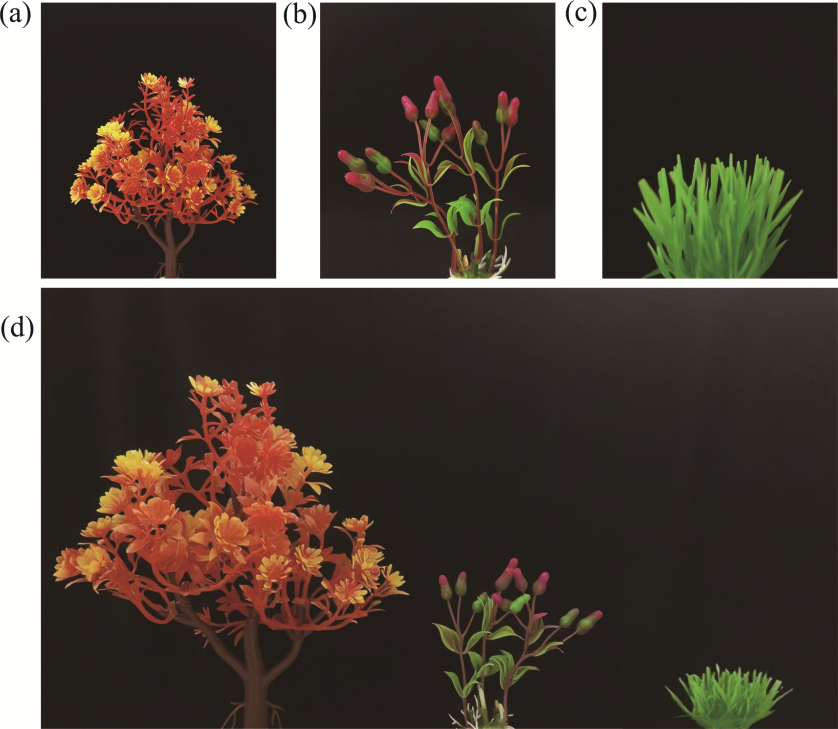
Customized plastic models of P. euphratica, T. chinensis, C. esculentus, and nylon net were designed based on field surveys (Fig. 1). In the field, the actual heights were 10.0, 5.0, 1.0, and 7.5 m, respectively. By applying a 1:50 isotropic scaling ratio, we got the model heights of 20.0 cm for P. euphratica, 10.0 cm for T. chinensis, 2.0 cm for C. esculentus, and 15.0 cm for nylon net. The crown dimensions were 4.0 cm×5.0 cm for P. euphratica, 2.0 cm×3.0 cm for T. chinensis, and 0.4 cm×0.3 cm for C. esculentus. The nylon net, being a planar mesh structure, did not have a defined crown width. Viewing each plant shape from the upwind side, P. euphratica, T. chinensis, and C. esculentus could be approximated by one of three model shapes: a cone, an inverted cone, or a cylinder. Each plant species was arranged in a double-row staggered configuration, where the planting positions of the second-row plants were located at the midpoints perpendicular to the line connecting adjacent first-row plants, forming the vertices of equilateral triangles. The row spacing was 10.0 cm for P. euphratica, 5.0 cm for T. chinensis, and 2.0 cm for C. esculentus. The spacing was 10.0 cm between P. euphratica and C. esculentus, and 5.0 cm between T. chinensis and C. esculentus.
Fig. 1 Customized plastic model pictures of Populus euphratica (a), Tamarix chinensis (b), and Cyperus esculentus (c), as well as comparison among three plant species (d)

2.1.3 Wind velocity and sand flux measurements

Wind velocity was measured at nine vertical heights (1.0, 2.0, 3.0, 5.0, 7.0, 10.0, 15.0, 30.0, and 50.0 cm) across seven longitudinal positions relative to the shelterbelt (x/h= -2, -1, 1, 2, 3, 5, and 7), as detailed in Tables 1-4. Here, x (cm) refers to the distance from the front edge (upwind side) of the shelterbelt for upwind measurements, and the distance from the rear edge (downwind side) for downwind measurements, while h (cm) represents the canopy height. This study used a Pitot-static tube connected to a micro differential pressure transmitter for the measurements (Fig. 2). Wind velocity in the experimental section was monitored and adjusted through a computer-controlled wind tunnel system. The initial wind velocities were set to 8.0 and 12.0 m/s, representing moderate and high wind conditions, respectively. At each measurement point, wind velocity was recorded continuously for 60 s at a frequency of 1 Hz; instantaneous values were extracted every 2 s and averaged to represent the local wind conditions.
Table 1 Pitot tube locations of model A (Populus euphratica) in the wind tunnel
Pitot tube Location x (cm) x/h
P1 40.0 cm upwind of the vegetated surface (820.0 cm downwind from the leading edge of the entrance of work section) -40.0 -2
P2 20.0 cm upwind of the vegetated surface (840.0 cm downwind from the leading edge of the entrance of work section) -20.0 -1
P3 30.0 cm downwind from the leading edge of vegetation (890.0 cm downwind of the entrance of work section ) 20.0 1
P4 50.0 cm downwind from the leading edge of vegetation (910.0 cm downwind of the entrance of work section ) 40.0 2
P5 70.0 cm downwind from the leading edge of vegetation (930.0 cm downwind of the entrance of work section ) 60.0 3
P6 110.0 cm downwind from the leading edge of vegetation (970.0 cm downwind of the entrance of work section ) 100.0 5
P7 150.0 cm downwind from the leading edge of vegetation (1010.0 cm downwind of the entrance of work section ) 140.0 7

Note: x/h is the normalized downwind distance; x refers to the distance from the front edge (upwind side) of the shelterbelt for upwind measurements, or the distance from the rear edge (downwind side) for downwind measurements; h represents the canopy height.

Table 2 Pitot tube locations of models B (P. euphratica-Cyperus esculentus composite) and C (P. euphratica-nylon net-C. esculentus composite) in the wind tunnel
Pitot tube Location x (cm) x/h
P1 40.0 cm upwind of the vegetated surface (820.0 cm downwind from the leading edge of the entrance of work section) 40.0 -2
P2 20.0 cm upwind of the vegetated surface (840.0 cm downwind from the leading edge of the entrance of work section) 20.0 -1
P3 42.0 cm downwind from the leading edge of vegetation (902.0cm downwind of the entrance of work section) 20.0 1
P4 62.0 cm downwind from the leading edge of vegetation (922.0 cm downwind of the entrance of work section) 40.0 2
P5 82.0 cm downwind from the leading edge of vegetation (942.0 cm downwind of the entrance of work section) 60.0 3
P6 122.0 cm downwind from the leading edge of vegetation (982.0 cm downwind of the entrance of work section) 100.0 5
P7 162.0 cm downwind from the leading edge of vegetation (1022.0 cm downwind of the entrance of work section) 140.0 7
Table 3 Pitot tube locations of model D (Tamarix chinensis) in the wind tunnel
Pitot tube Location x (cm) x/h
P1 20.0 cm upwind of the vegetated surface (820 cm downwind from the leading edge of the entrance of work section) -20.0 -2
P2 10.0 cm upwind of the vegetated surface (830 cm downwind from the leading edge of the entrance of work section) -10.0 -1
P3 15.0 cm downwind from the leading edge of vegetation (855.0 cm downwind of the entrance of work section) 10.0 1
P4 25.0 cm downwind from the leading edge of vegetation (865.0 cm downwind of the entrance of work section) 20.0 2
P5 35.0 cm downwind from the leading edge of vegetation (875.0 cm downwind of the entrance of work section) 30.0 3
P6 55.0 cm downwind from the leading edge of vegetation (895.0 cm downwind of the entrance of work section) 50.0 5
P7 75.0 cm downwind from the leading edge of vegetation (915.0 cm downwind of the entrance of work section) 70.0 7
Table 4 Pitot tube locations of model E (T. chinensis-C. esculentus composite) in the wind tunnel
Pitot tube Location x (cm) x/h
P1 20.0 cm upwind of the vegetated surface (820.0 cm downwind from the leading edge of the entrance of work section) -20.0 -2
P2 10.0 cm upwind of the vegetated surface (830.0 cm downwind from the leading edge of the entrance of work section) -10.0 -1
P3 22.0 cm downwind from the leading edge of vegetation (862.0 cm downwind of the entrance of work section) 10.0 1
P4 32.0 cm downwind from the leading edge of vegetation (872.0 cm downwind of the entrance of work section) 20.0 2
P5 42.0 cm downwind from the leading edge of vegetation (882.0 cm downwind of the entrance of work section) 30.0 3
P6 62.0 cm downwind from the leading edge of vegetation (902.0 cm downwind of the entrance of work section) 50.0 5
P7 82.0 cm downwind from the leading edge of vegetation (922.0 cm downwind of the entrance of work section) 70.0 7
Fig. 2 Schematic diagram of the Pitot tube system used for wind velocity measurements in the wind tunnel (a) and wind velocity sampling process for the five shelterbelt models A-E during wind tunnel experiments (b). P1-P7 indicate seven sequential sampling positions where wind velocity was measured by a single Pitot tube.
Sand flux was measured at x/h=5 using a vertical sand trap (WITSEG samplers; Fig. 3), as detailed in Table 5 (Miri et al., 2021). Each sampler was divided into fifteen chambers of 1.0 cm×1.0 cm openings to collect blown sediments up to 20.0 cm height. For measurements of the blown-sand flux, we placed a 1.0 m-long, 0.8 m-wide, and 2.0 cm-thick layer of loose sand (collected from the Gurbantunggut Desert in the Junggar Basin) with a mean particle size of 350 µm in the rectifying space to provide a sand source. The wind tunnel was operated at wind velocities of 8.0 and 12.0 m/s.
Fig. 3 Schematic diagram of the sand trap system used in the wind tunnel working section (a) and sand sampling process for the five shelterbelt models A-E during wind tunnel experiments (b). S1-S3 indicate three replicated sand traps.
Table 5 Location of sand samplers in the wind tunnel
Model Location x (cm) x/h
Model A 110.0 cm downwind from the leading edge of vegetation (970.0 cm downwind of the entrance of work section ) 100.0 5
Model B 122.0 cm downwind from the leading edge of vegetation (982.0 cm downwind of the entrance of work section) 100.0 5
Model C 15.0 cm downwind from the leading edge of vegetation (855.0 cm downwind of the entrance of work section) 100.0 5
Model D 55.0 cm downwind from the leading edge of vegetation (895.0 cm downwind of the entrance of work section) 50.0 5
Model E 62.0 cm downwind from the leading edge of vegetation (902.0 cm downwind of the entrance of work section) 50.0 5
Geometric and dynamic similarity principles were maintained to ensure comparability between wind tunnel simulations and field conditions.

2.1.4 Indices for assessing shelterbelt effects

Two indices were calculated to assess shelterbelt effects: the wind abatement coefficient RcΔx,z (Cornelis and Gabriels, 2005) and the wind velocity reduction rate RrWS (Cleugh, 1998). The RcΔx,z is defined as:
${R}_{c\Delta x,z}=1-\frac{{u}_{\Delta x,z}}{{u}_{0\Delta x,z}}$
where Δx denotes the horizontal distance from the plant, expressed in units of the height of the tree species in the shelterbelt (h); z represents the height above the bed surface (h); uΔx,z is the mean wind velocity with shelterbelt (m/s); and ux,z is the wind velocity without shelterbelt (m/s). The RrWS is calculated as:
$R_{rWS}=\frac{U_{i}}{U_{0}}$,
where Ui is the wind velocity at a downwind location (m/s); and U0 is the initial wind velocity (m/s). The RrWS values were obtained at the middle height of the tree species in the shelterbelt models.
Specifically, the wind tunnel experiments primarily investigated the wind and sand control effects of C. esculentus combined individually with tree and shrub species, aiming to reveal the wind resistance and sand control performance of different composite shelterbelt models.

2.2 Field experiments

2.2.1 Site description

The study area is located in the southern Hotan Prefecture, Xinjiang, along the southern edge of the Tarim Basin. The region is characterized by a warm-temperate continental desert climate, with an average annual temperature of 13.1°C, annual precipitation of 43.8 mm, and annual evaporation of 2624.4 mm. The region receives strong solar radiation (2662 h/a), maintains low relative humidity (41.0%), and experiences large diurnal temperature variations. Sand-related weather events are frequent, with annual averages of 178.6 d of floating dust, 32.6 d of blowing sand, and 14.5 d of sandstorms. The dominant wind directions are southwest (10.0%) and south-southwest (9.0%), while static wind conditions occur approximately 16.0% of the time.
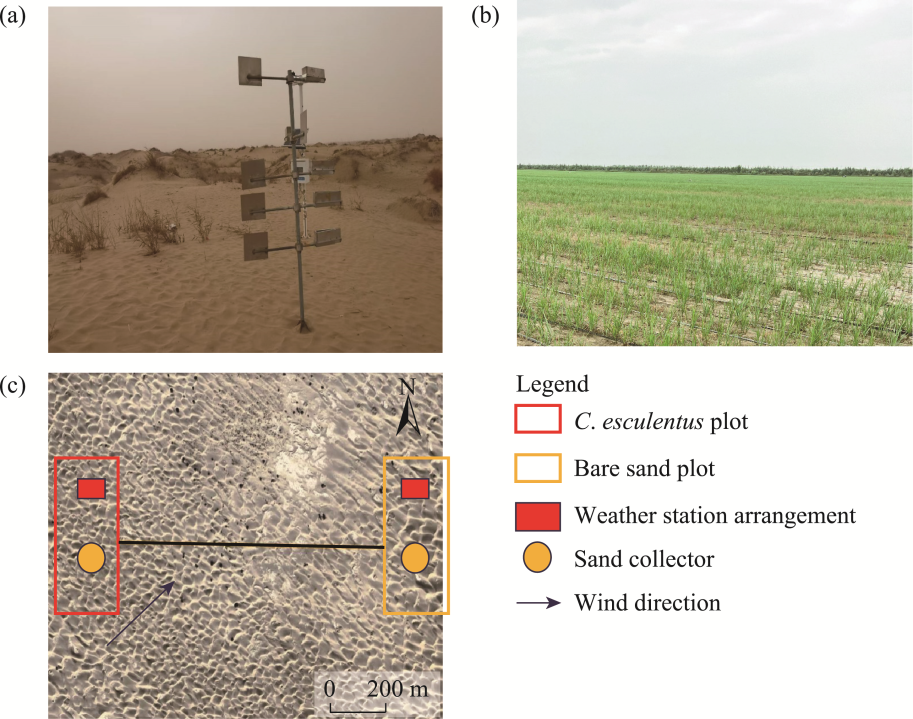
The experimental site for C. esculentus cultivation is located in Unity New Village, Jiya Township, Hotan City (37°15′50′′N, 80°36′22′′E), at the edge of the Hotan Oasis. The site is a newly reclaimed sandy area characterized by wind-deposited sediments, surrounded mainly by artificial protective forests, with sparse natural plant cover and subject to severe wind and sand hazards (Fig. 4a and b).
Fig. 4 Photographs showing the bare sand plot (a) and C. esculentus plot (b), along with the experimental layout diagram (c)

2.2.2 Field setup and measurements

C. esculentus was sown in May 2021 over an area of 3 ha, and the experimental plot was established on the downwind side of the protective forests, under uniform conditions of irrigation, fertilization, and management. The experiment lasted until 30 September 2021. Two automatic weather stations were installed—one in the C. esculentus field and another in a bare sand plot located 800.0 m away along the same transect—to facilitate comparative analysis. Wind velocity sensors were positioned at heights of 0.5, 1.0, and 2.0 m, and wind direction sensors were installed at 2.0 m height. Data were recorded at 1-min intervals from March to September in 2021. Monthly average wind velocities were calculated to capture temporal variations, with particular attention to July through September, which correspond to the vigorous growth and harvest stages of C. esculentus. This approach ensured synchronized long-term monitoring at both stations. Two groups of sand collectors were deployed in the C. esculentus plot and bare sand plot, respectively. Each collector comprised an aboveground sand trap with 10 ports (each measuring 2.0 cm×5.0 cm and covering heights from 0.0 to 50.0 cm) and an underground container for sediment collection (Fig. 4c).

2.3 Data analysis

We processed all wind and sand transport data in Microsoft Excel 2019 and Origin 2024 to generate descriptive statistics and spatial profiles of wind velocity and sand flux. The field data validated the wind tunnel results and were used to assess the real-world performance of composite shelterbelts integrating C. esculentus with trees or shrubs under desert conditions.

3 Results

3.1 Effect of five shelterbelts on wind velocity

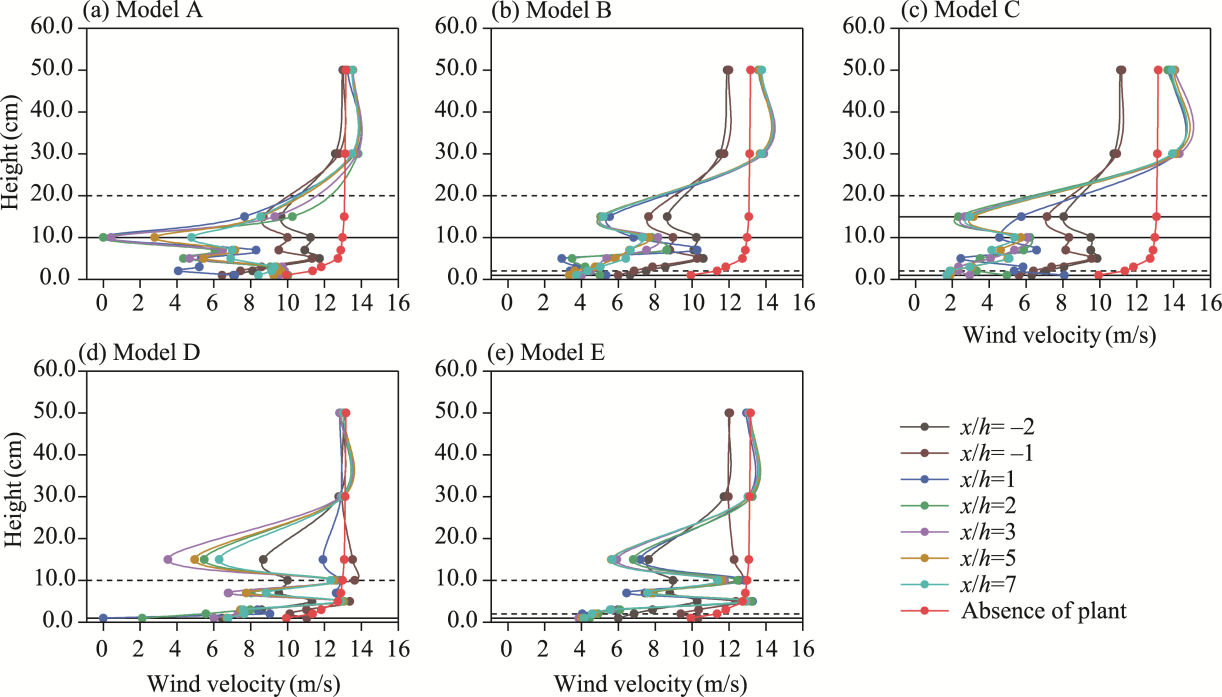
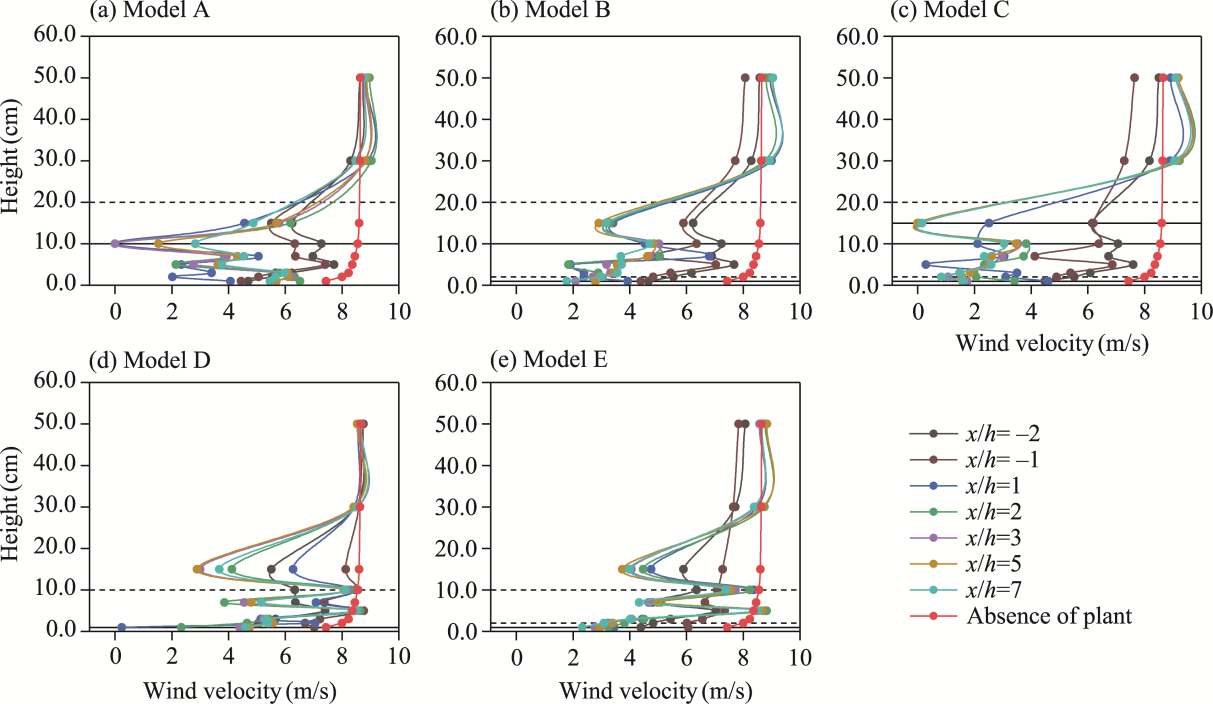
Figure 5 presents the vertical wind velocity profiles at upwind (x/h= -2 and -1) and downwind (x/h=1, 2, 3, 5, and 7) locations under an initial wind velocity of 8.0 m/s. Similar trends were observed under an initial wind velocity of 12.0 m/s (Fig. 6). In the unplanted control, wind velocity increased logarithmically with canopy height. However, all five shelterbelt models significantly altered this pattern, displaying the following characteristics: (1) a consistent local maximum at a height of 5.0 cm; (2) a reduction zone at heights of 1.0-15.0 cm for models A-C, while two distinct zones at heights of 1.0-10.0 and 10.0-15.0 cm for models D and E, excluding local maxima at heights of 5.0 and 10.0 cm, respectively; (3) an S-shaped profile downwind; and (4) a recovery of wind velocity and a reduced growth rate at heights above 15.0 cm.
Fig. 5 Vertical wind velocity profiles at upwind and downwind positions for the five shelterbelt models A-E (a-e) under an initial wind velocity of 8.0 m/s. x/h is the normalized downwind distance, where x refers to the distance from the front edge (upwind side) of the shelterbelt for upwind measurements, and the distance from the rear edge (downwind side) for downwind measurements, and h represents the canopy height. Dashed horizontal lines indicate the canopy tops, where 2.0, 10.0, and 20.0 cm represent the canopy heights of C. esculentus, T. chinensis, and P. euphratica, respectively. Solid horizontal lines indicate the canopy bases, with 1.0 cm corresponding to the canopy base of C. esculentus and T. chinensis, and 10.0 cm corresponding to the canopy base of P. euphratica. Within the solid-line range, 15.0 cm denotes the height of the nylon net.
Fig. 6 Vertical wind velocity profiles at upwind and downwind positions for the five shelterbelt models A-E (a-e) under an initial wind velocity of 12.0 m/s. Dashed horizontal lines indicate the canopy tops, where 2.0, 10.0, and 20.0 cm represent the canopy heights of C. esculentus, T. chinensis, and P. euphratica, respectively. Solid horizontal lines indicate the canopy bases, with 1.0 cm corresponding to the canopy base of C. esculentus and T. chinensis, and 10.0 cm corresponding to the canopy base of P. euphratica. Within the solid-line range, 15.0 cm denotes the height of the nylon net.
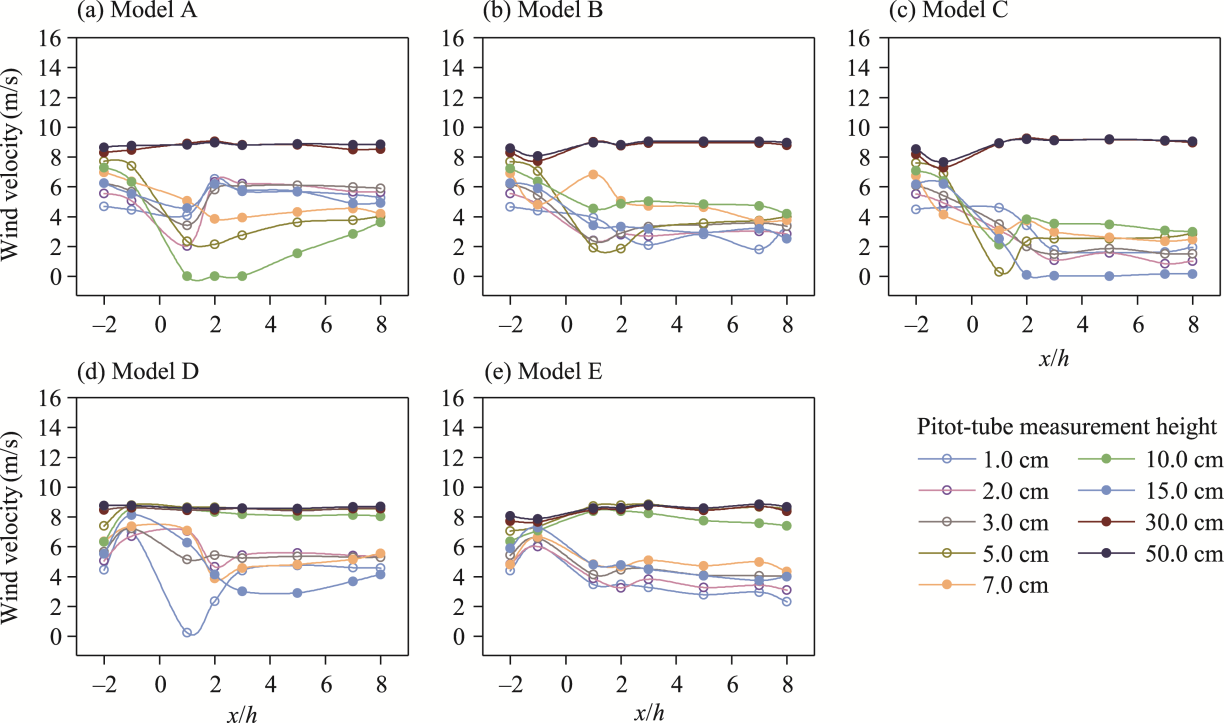
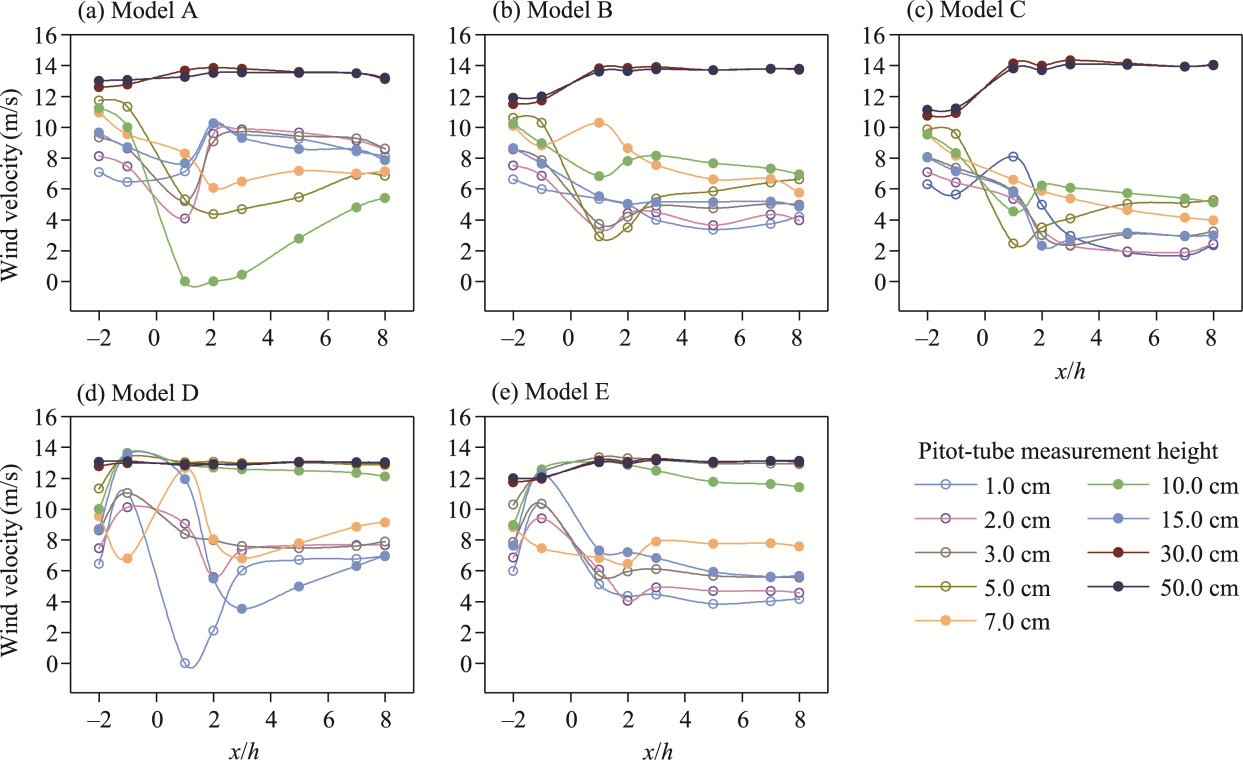
Quantitatively, model A reduced downwind wind velocities below upwind values within the 1.0-15.0 cm height layer. Models B and C extended this reduction to approximately 20.0 cm. At 10.0 cm, downwind wind velocity in model B averaged 4.8 m/s, compared with 7.2 and 6.4 m/s at upwind positions. Between 1.0 and 30.0 cm, both upwind and downwind wind velocities remained lower than those in the control. Above 30.0 cm, models B, C, and E exhibited slightly lower upwind velocities, but often exceeded downwind control velocities. For example, at 50.0 cm, the upwind velocity of model E reached 8.8 m/s, compared to 8.7 m/s for bare sand. Overall, shelterbelts substantially reduced near-surface wind velocities in the sheltered layer, whereas above the canopy the wind flow largely recovered toward the incident wind velocity and could even show slight acceleration. To assess the horizontal wind velocity distribution, this study analyzed profiles at upwind positions (x/h= -2 and -1) and downwind positions (x/h=1, 2, 3, 5, 7, and 8) under an initial wind velocity of 8.0 m/s (Fig. 7). All shelterbelts exhibited consistent wind velocity trends, especially at low heights (1.0-5.0 cm), with notable differences between the models. Similar trends were observed under an initial wind velocity of 12.0 m/s (Fig. 8). In models A-C, wind velocity gradually decreased from x/h= -2 to x/h=1 within the 1.0-15.0 cm height layer. Model A reduced wind velocity to approximately 0.5u0 (u0 represents the initial wind velocity at the entrance of the experimental section) at x/h=1, recovering to 0.8u0 by x/h=8. In contrast, models B and C showed stronger attenuation, reducing wind velocity to around 0.4u0 and maintaining this level throughout the downwind range.
Fig. 7 Horizontal wind velocity profiles at upwind and downwind positions for five shelterbelt models A-E (a-e) under an initial wind velocity of 8.0 m/s
Fig. 8 Horizontal wind velocity profiles at upwind and downwind positions for five shelterbelt models A-E (a-e) under an initial wind velocity of 12.0 m/s
For models D and E, wind velocity initially increased slightly from x/h= -2 to x/h= -1 (reaching approximately 0.9u0) before stabilizing at heights of 5.0 and 10.0 cm from x/h= -1 to x/h=8. At x/h=8, wind velocity was around 0.6u0 for Model D and 0.5u0 for model E. In the 30.0-50.0 cm height range, models B, C, and E showed a dip in wind velocity at x/h= -1, followed by recovery at x/h=1, while models A and D exhibited minimal variation. Overall, shelterbelt models were most effective in reducing wind velocity within the 1.0-15.0 cm layer, with models B and C achieving the greatest attenuation and the slowest recovery.

3.2 Effect of five shelterbelts on sand flux

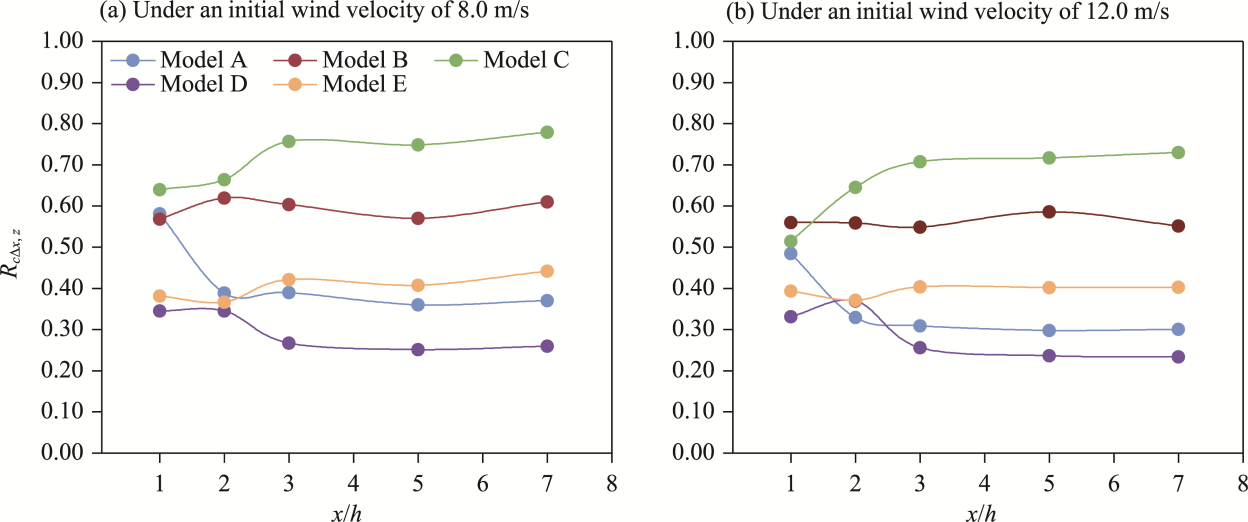
This study evaluated the effectiveness of the shelterbelt models in reducing wind velocity using RcΔx,z values (Fig. 9). In model A, RcΔx,z decreased sharply from x/h=1 to x/h=2, then stabilized around 0.40 from x/h=2 to x/h=7. Model B showed fluctuations around 0.60, peaking at x/h=2 before gradually declining with downwind distance. Model C consistently exhibited the highest RcΔx,z values, reaching up to 0.80 at greater downwind distances, indicating strong and sustained wind reduction capacity. In contrast, model D recorded the lowest RcΔx,z values, peaking at x/h=2 before decreasing to 0.25-0.30. Model E showed a slight decline between x/h=1 and x/h=2, followed by a gradual increase, stabilization near 0.40. Among the shelterbelt models, model C provided the most effective and persistent wind velocity reduction, particularly beyond x/h=3. While models D and E had comparable RcΔx,z values at x/h=1 and 2, model E maintained higher values at larger x/h of 3-7, suggesting better long-range wind protection.
Fig. 9 Comparison of wind abatement coefficient (RcΔx,z) at different downwind distances among five shelterbelt models A-E under initial wind velocities of 8.0 m/s (a) and 12.0 m/s (b)
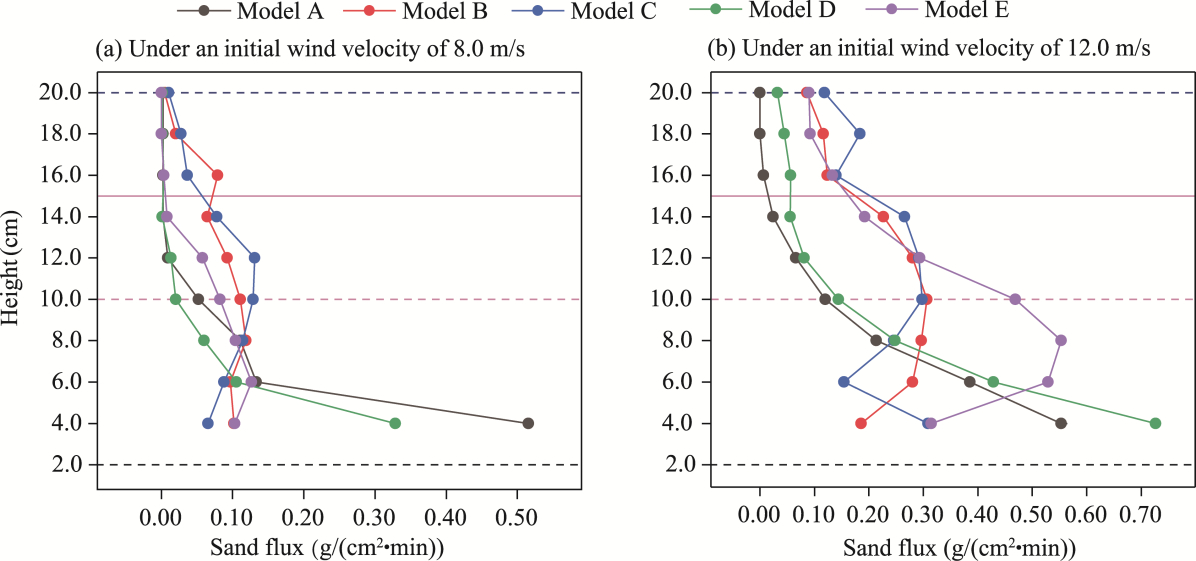
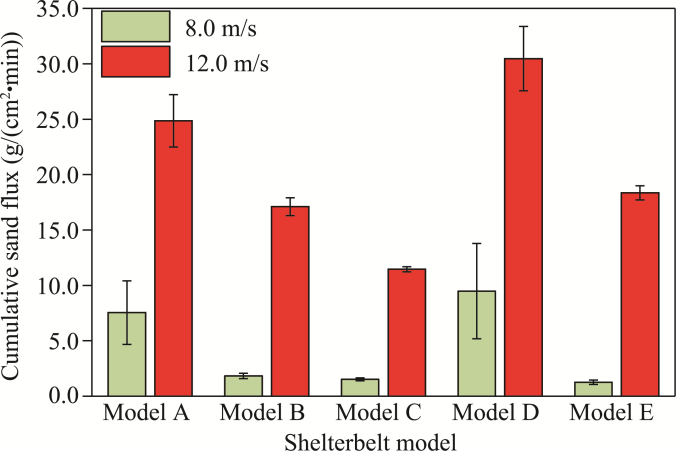
Regarding sand transport, the sand flux profiles at a wind velocity of 8.0 m/s (Fig. 10a) revealed the vertical distribution characteristics of sand movement across different shelterbelt models. The corresponding cumulative sand flux (Fig. 11) indicated that model E exhibited the lowest sand flux intensity, at only 1.26 g/(cm2•min), reflecting its superior performance relative to the other shelterbelt models. At a wind velocity of 12.0 m/s, the vertical profiles displayed more pronounced dynamic shifts (Fig. 10b), and model C demonstrated the most effective sand reduction, with a flux intensity of 11.46 g/(cm2•min) (Fig. 11). Composite shelterbelts incorporating C. esculentus (models B, C, and E) consistently outperformed single-species configurations in reducing both wind velocity and sand transport. Figure 11 further emphasized the effectiveness of multi-layered shelterbelt designs, particularly those including C. esculentus, under moderate to high wind velocity conditions.
Fig. 10 Sand flux profiles for five shelterbelt models A-E under initial wind velocities of 8.0 m/s (a) and 12.0 m/s (b). Dashed horizontal lines indicate the canopy tops of the shelterbelt components, where 2.0, 10.0, and 20.0 cm represent the canopy heights of C. esculentus, T. chinensis, and P. euphratica, respectively. Within the range indicated by the solid horizontal lines, 15.0 cm denotes the height of the nylon net.
Fig. 11 Comparison of cumulative sand flux within a layer extending from the ground surface to a height of 20.0 cm for five shelterbelt models A-E under initial wind velocities of 8.0 and 12.0 m/s. Bars are standard errors.

3.3 Validation of the windbreak effects of C. esculentus in combined shelterbelts

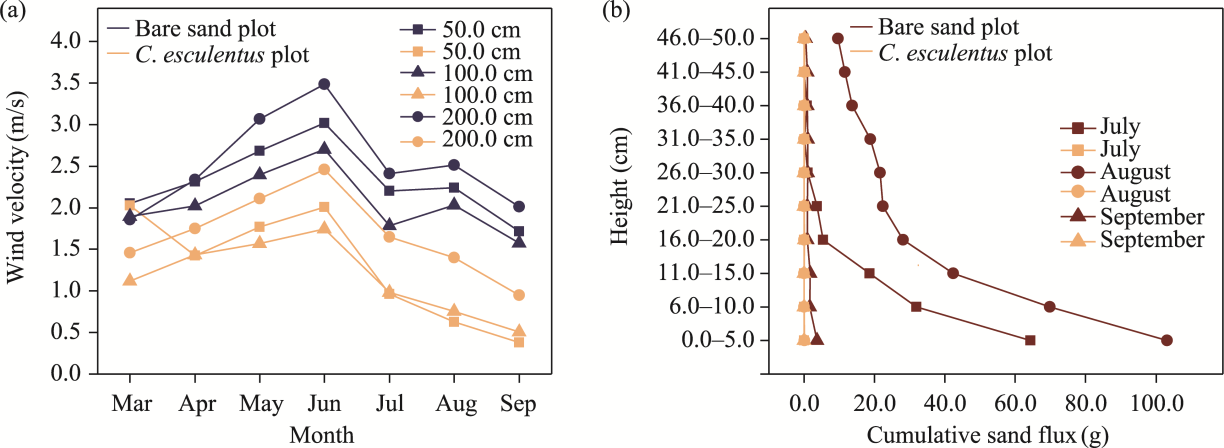
Field measurements (Fig. 12) validated that incorporating C. esculentus into shelterbelts systems significantly improved wind and sand control. Wind velocities in the C. esculentus plot were consistently lower than those in the bare sand plot. For example, at a height of 50.0 cm, wind velocity decreased by 43.3%, from 2.3 m/s in the bare sand plot to 1.3 m/s in the C. esculentus plot. These reductions closely mirrored wind tunnel results, particularly in models B and C, where C. esculentus served as an understory species. In the wind tunnel experiments, wind velocity reductions of over 40.0% were observed within the 1.0-15.0 cm height layer (Fig. 5), highlighting the effectiveness of C. esculentus in obstructing near-surface winds.
Fig. 12 Variation in wind velocity at heights of 50.0, 100.0, and 200.0 cm in the C. esculentus plot compared to the bare sand plot (a) and comparison of cumulative sand flux at corresponding heights from July to September in the same experimental plots (b)
Regarding sand flux, the field data from July to September demonstrated a remarkable reduction in sand transport within the plot planted with C. esculentus behind shelterbelts. For example, in July, the cumulative sand flux in the bare sand plot reached 125.76 g, while in the C. esculentus plot, it was reduced to 0.32 g, representing a 99.7% reduction. This result aligns with the wind tunnel data (Fig. 10), where shelterbelt models incorporating C. esculentus exhibited superior performance in decreasing both sand flux and wind velocity compared to tree-only shelterbelts. Together, the field experiments reinforced the wind tunnel findings, confirming that positioning C. esculentus on the downwind side of shelterbelts could significantly enhance windbreak function by reducing near-surface wind velocity and sand transport.

4 Discussion

4.1 Shelterbelt-induced modifications to vertical and horizontal wind profiles

The presence of shelterbelts significantly altered the vertical distribution of wind velocity (Fig. 5), disrupting the typical logarithmic increase observed over bare sand surfaces, as reported by Latif Bhutto et al. (2022). In unplanted plots, wind velocity increased steadily with height, whereas shelterbelts generated an S-shaped wind velocity profile between x/h=0 and x/h=8, consistent with previous findings (Yang et al., 2006; Hesp et al., 2019). Notably, dual wind velocity maxima emerged within the shelterbelts: one near the surface around 5.0 cm and another near the canopy level, especially with the P. euphratica and T. chinensis (Fig. 5). These dual maxima likely resulted from airflow penetration beneath the canopy, generating localized acceleration zones, a phenomenon also observed in uniform canopy structures (Jacobs and Van Boxel, 1988; Mayaud et al., 2016b; Miri et al., 2021). Among the tested configurations, the composite shelterbelt integrating C. esculentus achieved the greatest near-ground wind reduction, highlighting the importance of incorporating low-lying vegetation for surface-level wind control (Fig. 9).
Horizontal wind velocity profiles further confirmed that all shelterbelts reduced downwind wind velocity (Fig. 7). This persistent attenuation is primarily attributed to the aerodynamic drag exerted by the vegetation canopy and the structural complexity of vegetation layers, which disrupt airflow and delay wind recovery (King et al., 2006; Leenders et al., 2007; Mayaud et al., 2016a; Hesp et al., 2019; Miri et al. 2019). The most pronounced attenuation occurred in the composite shelterbelt combining P. euphratica, nylon net, and C. esculentus, where wind velocity remained at or below 50.0% of the incoming wind velocity between x/h=5 and x/h=8. Comparative studies have reported that the extent of the sheltered zone downwind of shelterbelts ranges from 0-2 times the shelterbelt height (0-2 h) (Gao, 2010) to as far as 18 times the shelterbelt height (18 h) (Miri et al., 2019), with differences largely attributed to vegetation structure, density, and canopy layering (Leenders et al., 2007; Gillies et al., 2014; Wu et al., 2015; Mayaud et al., 2016b). Collectively, these results indicated that multi-layered, structurally complex shelterbelts, such as the composite configuration tested in this study, are more effective in maintaining wind reduction over extended downwind distances. In contrast, single-species shelterbelts composed of P. euphratica or T. chinensis exhibited rapid wind recovery beyond x/h=1, highlighting their limited spatial influence. These findings underscored the importance of vertical stratification in shelterbelt design, not only for enhancing near-surface wind control but also for sustaining the windbreak effect across longer distances.

4.2 Wind reduction performance across shelterbelt configurations

This study assessed the performance of the five shelterbelt models using three key indicators: the RrWS, the extent of the protection zone, and the distribution of wind velocity in the downwind area. At an incoming wind velocity of 8.0 m/s, model C exhibited the greatest wind velocity reduction, with RrWS values ranging from 0.62 to 0.65 at x/h of 1-7, indicating strong and sustained wind attenuation. In comparison, models A, B, D, and E showed lower RrWS values (0.23-0.53), all below the recommended threshold of 0.70 or 0.90 for effective protection (Seginer, 1975; Cleugh, 1998; Torita and Satou, 2007). These variations in performance can be largely attributed to differences in shelterbelt height, structural complexity, and vertical stratification. Shelterbelts incorporating multiple vegetation layers are more effective in disrupting airflow and extending the protection zone, reinforcing the importance of multi-layered designs for maximizing wind reduction efficacy.
All shelterbelt models maintained a protective effect at x/h=8, where RrWS values remained below 0.90 (Fig. 9), indicating sustained windbreak efficacy across long downwind distances. Similar sustained wind attenuation over extended distances has been reported in various studies assessing plant windbreaks, with mechanisms attributed to shelterbelt structure and density (Leenders et al., 2007; Torita and Satou, 2007; Yang et al., 2021). Downwind wind velocity distributions further highlighted the impact of shelterbelt composition. At 8.0 and 12.0 m/s incoming wind velocities, downwind wind velocities were approximately 6.0 and 8.0 m/s for model A, 4.0 and 6.0 m/s for model B, 3.0 and 4.0 m/s for model C, 6.0 and 8.0 m/s for model D, and 5.0 and 6.0 m/s for model E, respectively (Figs. 7 and 8). Shelterbelts integrating C. esculentus with taller species, particularly in model C, provided the most effective surface-level wind protection under high wind conditions (Nickling, 1983; Wu et al., 2012; Aili et al., 2024). Overall, the results reinforced that integrating vertically stratified vegetation, particularly with ground-hugging species such as C. esculentus, is essential for maximizing shelterbelt efficacy under arid and high-wind environments.

4.3 Sand flux control and comparative effectiveness of shelterbelts

This study assessed the wind- and sand-mitigating effectiveness of the five shelterbelt models using RcΔx,z and sand flux measurements. At a moderate wind velocity (8.0 m/s), all shelterbelt models provided relatively comparable levels of protection. However, at a high wind velocity (12.0 m/s, clean air), notable differences emerged. Composite shelterbelts, such as models B, C, and E, demonstrated stronger resistance to wind compared to shelterbelts composed solely of trees or shrubs. This observation aligns with previous findings that structurally diverse vegetation communities can better withstand elevated wind stress (Miri et al., 2017; Li et al., 2021). Specifically, RcΔx,z values under high wind conditions underscored the enhanced aerodynamic performance of composite shelterbelts, especially within the near-surface layer (Fig. 9). These results reinforce the importance of incorporating low-growing species like C. esculentus to bolster surface-level windbreak capacity and improve overall shelterbelt functionality.
Field measurements further validated the wind tunnel experiment results, confirming the efficacy of C. esculentus in reducing wind velocity and limiting sand movement. At measurement heights of 50.0 and 100.0 cm (Fig. 12), wind velocities in the C. esculentus plot remained consistently lower than those recorded in the bare sand plot. Sand flux values also remained minimal and exhibited a vertically uniform distribution, underscoring the plant's stabilizing effect on the near-surface environment. These findings support prior studies showing that C. esculentus can significantly restrict airflow and suppress sand particle entrainment (Liu et al., 2022; Yuan et al., 2024). Comparable wind attenuation and sediment control effects have also been documented for T. chinensis, a species known for its contribution to mitigating aeolian erosion in desert landscapes (Miri and Davidson-Arnott, 2021). The dense, low-growing canopy of C. esculentus played a crucial role in disturbing near-surface wind dynamics, thereby reducing the potential for wind-driven sand transport, even under sandstorm conditions. Compared to tree-only shelterbelts, those incorporating C. esculentus consistently demonstrated reduced sand fluxes and improved surface protection. Collectively, these results emphasize the ecological value and functional advantages of integrating short, flexible species like C. esculentus into shelterbelt systems, particularly in arid environments prone to high wind events and severe soil erosion.
Although wind tunnel experiments provide an important means for studying the wind and sand control effects of shelterbelts, their limitations should be acknowledged. First, the scale-reduction used in the experiments (1:50) can introduce discrepancies in key parameters such as the saltation distance of sand particles and the vertical wind velocity profile, potentially deviating from those observed under natural conditions. Second, the confined dimensions of the wind tunnel may produce boundary effects that distort natural airflow dynamics, thus influencing the results. Moreover, the use of controlled, uniform wind velocities and artificial sand sources could not fully capture the variability and complexity inherent in natural environments. These simulations often exclude critical factors such as variable topography, heterogeneous surface roughness, and fluctuating meteorological conditions. Additionally, wind tunnel studies are inherently limited to short-term experimental durations, whereas real desert ecosystems are subjected to long-term and cyclical wind and sand transport processes. As a result, the extrapolation of wind tunnel data to real-world shelterbelt applications should be approached with caution.
Our findings clearly demonstrated that the inclusion of herbaceous species, particularly C. esculentus, within composite shelterbelt systems could significantly enhance windbreak and sand fixation performance. Whereas prior research has predominantly emphasized tree-based or tree-shrub shelterbelt configurations (Li et al., 2021; Zhang et al., 2022; Jiang et al., 2024), this study underscored the pivotal, yet underappreciated, role of ground-layer herbaceous vegetation in suppressing near-surface wind velocities and mitigating sediment transport. This near-surface control mechanism represents a critical dimension of shelterbelt functionality that has received limited attention in the existing literature. By integrating wind tunnel simulations with field measurements, this study extended beyond conventional shelterbelt paradigms, offering a more holistic and effective model tailored for arid areas prone to wind erosion. The findings can not only contribute to practical design innovations but also deepen the theoretical framework supporting multi-layered shelterbelt strategies.

5 Conclusions

This study investigated the wind reduction and sand control performance of five shelterbelt configurations, including P. euphratica, T. chinensis, and their combinations with C. esculentus, under controlled wind tunnel conditions. The results showed that shelterbelt structure and species composition critically influence airflow and sand flux. Shelterbelts incorporating C. esculentus achieved significantly lower near-surface sand transport, highlighting its effectiveness in stabilizing surface wind fields. Field experiments corroborated these findings and demonstrated that strategically planting C. esculentus on the downwind side of shelterbelts could further enhance near-surface wind protection and reduce erosion risk in desert environments. These outcomes offer a scientific foundation for refining shelterbelt design in hyper-arid landscapes such as the Taklimakan Desert. Beyond ecological benefits, C. esculentus provides economic advantages due to its growing commercial demand, contributing to local livelihoods. Integrating short-stature species like C. esculentus into shelterbelt systems presents a sustainable strategy for improving ecosystem resilience, combating land degradation, and promoting desert agriculture in desert ecosystems.

Conflict of interest

The authors declare that they have no known competing financial interests or personal relationships that could have appeared to influence the work reported in this paper.

Acknowledgements

This research was supported by the Xinjiang Key Research and Development Programme Project (2022B02040-2) and the Tianshan Yingcai Program of Xinjiang Uygur Autonomous Region (2024TSYCLJ0028).

Author contributions

Methodology: NIE Bixia, SHEN Xin, LIU Yalan; Data curation: NIE Bixia, LIU Yalan; Investigation: NIE Bixia, SHEN Xin; Formal analysis: NIE Bixia, LIU Yalan; Writing - original draft preparation: NIE Bixia; Writing - review and editing: NIE Bixia, LI Xiangyi; Supervision: LI Xiangyi; Project administration: LI Xiangyi; Funding acquisition: LI Xiangyi; Resources: LI Xiangyi. All authors approved the manuscript.
[1]
Aili A, Xu H L, Waheed A, et al. 2024. Synergistic windbreak efficiency of desert vegetation and oasis shelter forests. PLoS ONE, 19(10): e0312876, doi: 10.1371/journal.pone.0312876.

[2]
Aydar E F, Tutuncu S, Ozcelik B. 2020. Plant-based milk substitutes: Bioactive compounds, conventional and novel processes, bioavailability studies, and health effects. Journal of Functional Foods, 70: 103975, doi: 10.1016/j.jff.2020.103975.

[3]
Barrett R L. 2024. Sedges on the edge: new agronomic and research opportunities? Plant and Soil, 495(1-2): 195-200.

DOI

[4]
Cleugh H A. 1998. Effects of windbreaks on airflow, microclimates and crop yields. Agroforestry Systems, 41(1): 55-84.

DOI

[5]
Cornelis W M, Gabriels D. 2005. Optimal windbreak design for wind-erosion control. Journal of Arid Environments, 61(2): 315-332.

DOI

[6]
D'Ettorre U S, Liso I S, Parise M. 2024. Desertification in karst areas: A review. Earth-Science Reviews, 253: 104786, doi: 10.1016/j.earscirev.2024.104786.

[7]
Du Y, Zhang Y L, Chai X T, et al. 2023. Effects of different tillage systems and mowing time on nutrient accumulation and forage nutritive value of Cyperus esculentus. Frontiers in Plant Science, 14: 1162572, doi: 10.3389/fpls.2023.1162572.

[8]
Dupont S, Bergametti G, Simoëns S. 2015. Modelling aeolian erosion in presence of vegetation. Procedia IUTAM, 17: 91-100.

DOI

[9]
Fu L T. 2019. Comparisons suggest more efforts are required to parameterize wind flow around shrub vegetation elements for predicting aeolian flux. Scientific Reports, 9: 3841, doi: 10.1038/s41598-019-40491-z.

[10]
Gao H. 2010. Study on effect on windspeed reduction and sand-break by low coverage belt Caragana Korshinskii Kom. plantation. PhD Dissertation. Beijing: Beijing Forestry University. (in Chinese)

[11]
Gillies J A, Nield J M, Nickling W G. 2014. Wind speed and sediment transport recovery in the lee of a vegetated and denuded nebkha within a nebkha dune field. Aeolian Research, 12: 135-141.

DOI

[12]
Gui D W, Liu Q, Martínez-Valderrama J, et al. 2024. Desertification baseline: A bottleneck for addressing desertification. Earth-Science Reviews, 257: 104892, doi: 10.1016/j.earscirev.2024.104892.

[13]
Hesp P A, Dong Y X, Cheng H, et al. 2019. Wind flow and sedimentation in artificial vegetation: Field and wind tunnel experiments. Geomorphology, 337: 165-182.

DOI

[14]
Hou S A, Yu Y, Wang Q Y. 2024. Predictive modeling of diverse factors impacting regional soil erosion degree with machine learning. Earth Science Informatics, 17(4): 3039-3051.

DOI

[15]
Jacobs A F G, Van Boxel J H. 1988. Changes of the displacement height and roughness length of maize during a growing season. Agricultural and Forest Meteorology, 42(1): 53-62.

DOI

[16]
Jiang N, Zhang Q Q, Zhang S C, et al. 2022. Spatial and temporal evolutions of vegetation coverage in the Tarim River Basin and their responses to phenology. CATENA, 217: 106489, doi: 10.1016/j.catena.2022.106489.

[17]
Jiang N, Cheng H, Liu C C, et al. 2024. A wind tunnel study of the effects of vegetation structural characteristics on the airflow field. CATENA, 242: 108064, doi: 10.1016/j.catena.2024.108064.

[18]
King J, Nickling W G, Gillies J A. 2005. Representation of vegetation and other nonerodible elements in aeolian shear stress partitioning models for predicting transport threshold. Journal of Geophysical Research-Earth Surface, 110 (F4): F04015, doi: 10.1029/2004JF000281.

[19]
King J, Nickling W G, Gillies J A. 2006. Aeolian shear stress ratio measurements within mesquite-dominated landscapes of the Chihuahuan Desert, New Mexico, USA. Geomorphology, 82(3-4): 229-244.

DOI

[20]
Latif Bhutto S, Miri A, Zhang Y, et al. 2022. Experimental study on the effect of four single shrubs on aeolian erosion in a wind tunnel. CATENA, 212: 106097, doi: 10.1016/j.catena.2022.106097.

[21]
Leenders J K, van Boxel J H, Sterk G. 2007. The effect of single vegetation elements on wind speed and sediment transport in the Sahelian zone of Burkina Faso. Earth Surface Processes and Landforms, 32(10): 1454-1474.

DOI

[22]
Li H L, Wang Y D, Li S Y, et al. 2022. Shelter efficiency of various shelterbelt configurations: A wind tunnel study. Atmosphere, 13(7): 1022, doi: 10.3390/atmos13071022.

[23]
Li J, Dong S, Li Y. 2021. Comparative study on windbreak effects of two different configuration shelterbelts. IOP Conference Series: Earth and Environmental Science, 895: 012020, doi: 10.1088/1755-1315/895/1/012020.

[24]
Li M, Zhang Z Y, Ju C X, et al. 2023. Sensitivity of temperature and precipitation characteristics to land use classification over the Taklimakan Desert and surrounding area. Theoretical and Applied Climatology, 154 (3-4): 987-998.

DOI

[25]
Li Y Q, Brandle J, Awada T, et al. 2013. Accumulation of carbon and nitrogen in the plant-soil system after afforestation of active sand dunes in China's Horqin Sandy Land. Agriculture, Ecosystems & Environment, 177: 75-84.

DOI

[26]
Liu Y L, Ren W, Zhao Y, et al. 2022. Effect of variation in row spacing on soil wind erosion, soil properties, and Cyperus esculentus yield in sandy land. Sustainability, 14(21): 14200, doi: 10.3390/su142114200.

[27]
Mayaud J R, Wiggs G F S, Bailey R M. 2016a. Dynamics of skimming flow in the wake of a vegetation patch. Aeolian Research, 22: 141-151.

DOI

[28]
Mayaud J R, Wiggs G F S, Bailey R M. 2016b. Characterizing turbulent wind flow around dryland vegetation. Earth Surface Processes and Landforms, 41(10): 1421-1436.

DOI

[29]
Miri A, Dragovich D, Dong Z B. 2017. Vegetation morphologic and aerodynamic characteristics reduce aeolian erosion. Scientific Reports, 7: 12831, doi: 10.1038/s41598-017-13084-x.

[30]
Miri A, Dragovich D, Dong Z B. 2018. The response of live plants to airflow—Implication for reducing erosion. Aeolian Research, 33: 93-105.

DOI

[31]
Miri A, Dragovich D, Dong Z B. 2019. Wind-borne sand mass flux in vegetated surfaces—Wind tunnel experiments with live plants. CATENA, 172: 421-434.

DOI

[32]
Miri A, Davidson-Arnott R. 2021. The effectiveness of a single Tamarix tree in reducing aeolian erosion in an arid region. Agricultural and Forest Meteorology, 300: 108324, doi: 10.1016/j.agrformet.2021.108324

[33]
Miri A, Dragovich D, Dong Z B. 2021. Wind flow and sediment flux profiles for vegetated surfaces in a wind tunnel and field-scale windbreak. CATENA, 196: 104836, doi: 10.1016/j.catena.2020.104836.

[34]
Nickling W G. 1983. Grain-size characteristics of sediment transported during dust storms. Journal of Sedimentary Research, 53(3): 1011-1024.

[35]
Okin G S. 2008. A new model of wind erosion in the presence of vegetation. Journal of Geophysical Research: Earth Surface, 113(F2), F02S10, doi: 10.1029/2007JF000758.

[36]
Pi H W, Huggins D R, Sharratt B. 2020. Threshold friction velocities influenced by standing crop residue in the inland Pacific Northwest, USA. Land Degradation & Development, 31(16): 2356-2368.

DOI

[37]
Salvati L. 2014. A socioeconomic profile of vulnerable land to desertification in Italy. Science of The Total Environment, 466-467: 287-299.

DOI

[38]
Seginer I. 1975. Flow around a windbreak in oblique wind. Boundary-Layer Meteorology, 9: 133-141.

DOI

[39]
Shen X, Sun M X, Nie B X, et al. 2024. Physiological adaptation of Cyperus esculentus L. seedlings to varying concentrations of saline-alkaline stress: Insights from photosynthetic performance. Plant Physiology and Biochemistry, 214: 108911, doi: 10.1016/j.plaphy.2024.108911.

[40]
Torita H, Satou H. 2007. Relationship between shelterbelt structure and mean wind reduction. Agricultural and Forest Meteorology, 145(3-4): 186-194.

DOI

[41]
Wang H F, Li Z Q, Goloub P, et al. 2022. Identification of typical dust sources in Tarim Basin based on multi-wavelength Raman polarization lidar. Atmospheric Environment, 290: 119358, doi: 10.1016/j.atmosenv.2022.119358.

[42]
Wu T G, Yu M K, Wang G, et al. 2012. Effects of stand structure on wind speed reduction in a Metasequoia glyptostroboides shelterbelt. Agroforestry Systems, 87(2): 251-257.

DOI

[43]
Wu X X, Zou X X, Zhou N, et al. 2015. Deceleration efficiencies of shrub windbreaks in a wind tunnel. Aeolian Research, 16: 11-23.

DOI

[44]
Yang B, Raupach M R, Shaw R H, et al. 2006. Large-eddy simulation of turbulent flow across a forest edge. Part I: Flow statistics. Boundary-Layer Meteorol, 120(3): 377-412.

DOI

[45]
Yang X G, Li F R, Fan W Y, et al. 2021. Evaluating the efficiency of wind protection by windbreaks based on remote sensing and geographic information systems. Agroforestry Systems, 95: 353-365.

DOI

[46]
Yuan W W, Zhu N F, Zhang L, et al. 2024. Three-dimensional aerodynamic structure estimation and wind field simulation for wide tree shelterbelts. Forest Ecology and Management, 559: 121813, doi: 10.1016/j.foreco.2024.121813.

[47]
Zhang K, Qu J J, Zhang X X, et al. 2022. Protective efficiency of railway Arbor-shrub windbreak forest belts in Gobi regions: Numerical simulation and wind tunnel tests. Frontiers in Environmental Science, 10: 885070, doi: 10.3389/fenvs.2022.885070.

[48]
Zhang S, Yuan W J, Yu Y, et al. 2024. Shrubs plays an important role in configuration of shelterbelt in windy and sandy areas. Frontiers in Ecology and Evolution, 12: 1347714, doi: 10.3389/fevo.2024.1347714.

Outlines

/