
Projection and reclassification of land use types in Lanzhou, Northwest China
Received date: 2025-07-15
Revised date: 2025-11-18
Accepted date: 2025-11-25
Online published: 2026-02-04
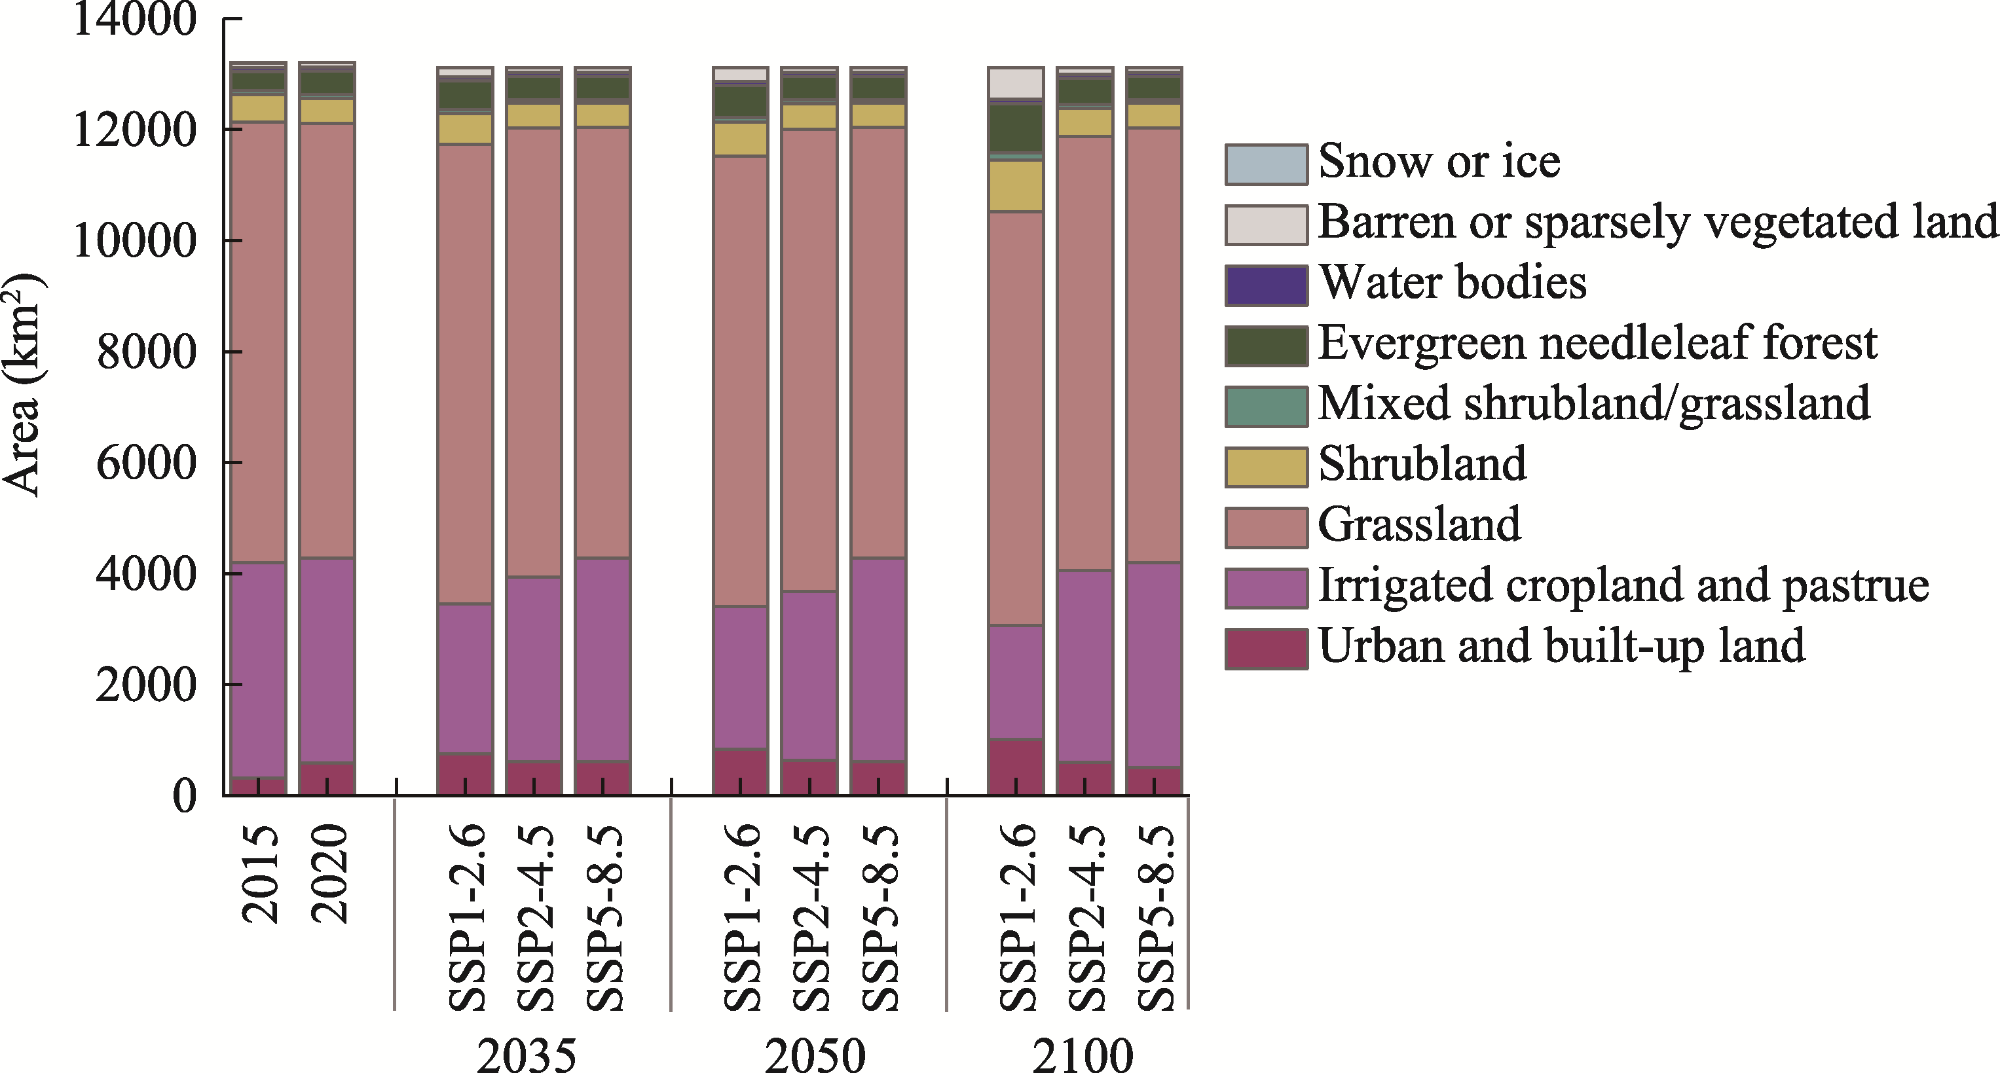
Land use in arid and semi-arid regions has a substantial effect on climate, environment, and biodiversity, thereby projecting the spatiotemporal changes in land use and the subsequent effects. This study employed the locally calibrated Future Land Use Simulation (FLUS) model, which coupled system dynamics with cellular automata and integrated an artificial neural network algorithm and a roulette wheel selection mechanism. We projected future land use (2020-2100) dynamics of Lanzhou, a typical river valley city in Northwest China, under three different Shared Socioeconomic Pathway (SSP) scenarios (SSP1-2.6, SSP2-4.5, and SSP5-8.5). The simulation results were validated and subsequently reclassified using the International Geosphere Biosphere Programme (IGBP) system to produce a dataset suitable for driving climatic and environmental models. Under the SSP1-2.6 scenario, urban and built-up land expanded consistently, whereas irrigated cropland and pasture as well as grassland contracted continuously. Conversely, the SSP5-8.5 scenario was characterized by a contraction of urban and built-up land, and relative stability of irrigated cropland and pasture as well as grassland. The SSP2-4.5 scenario presented a more complex trade-off, where urban and built-up land and grassland increased first and then decreased, whereas irrigated cropland and pasture followed an opposite trajectory. A significant inverse relationship between urban and built-up land and irrigated cropland and pasture was observed under all scenarios, underscoring the fundamental spatial competition that prevailed in this land-constrained valley city. Furthermore, the negative correlation of grassland with urban and built-up land, coupled with the positive correlation of grassland with irrigated cropland and pasture under both the SSP1-2.6 and SSP5-8.5 scenarios, indicated an evolution from broad confrontation to intricate internal trade-offs within the urban-agricultural-ecological system. This study underscored the critical influence of regional topographic and hydrological constraints on land-use evolution in arid regions, providing guidance for water resource management and ecosystem protection in Lanzhou, with applications for sustainable land-use planning in other arid and semi-arid river valley cities.
ZHU Rong , JIANG Youyan , LEI Runzhi . Projection and reclassification of land use types in Lanzhou, Northwest China[J]. Journal of Arid Land, 2026 , 18(1) : 17 -33 . DOI: 10.1016/j.jaridl.2026.01.005
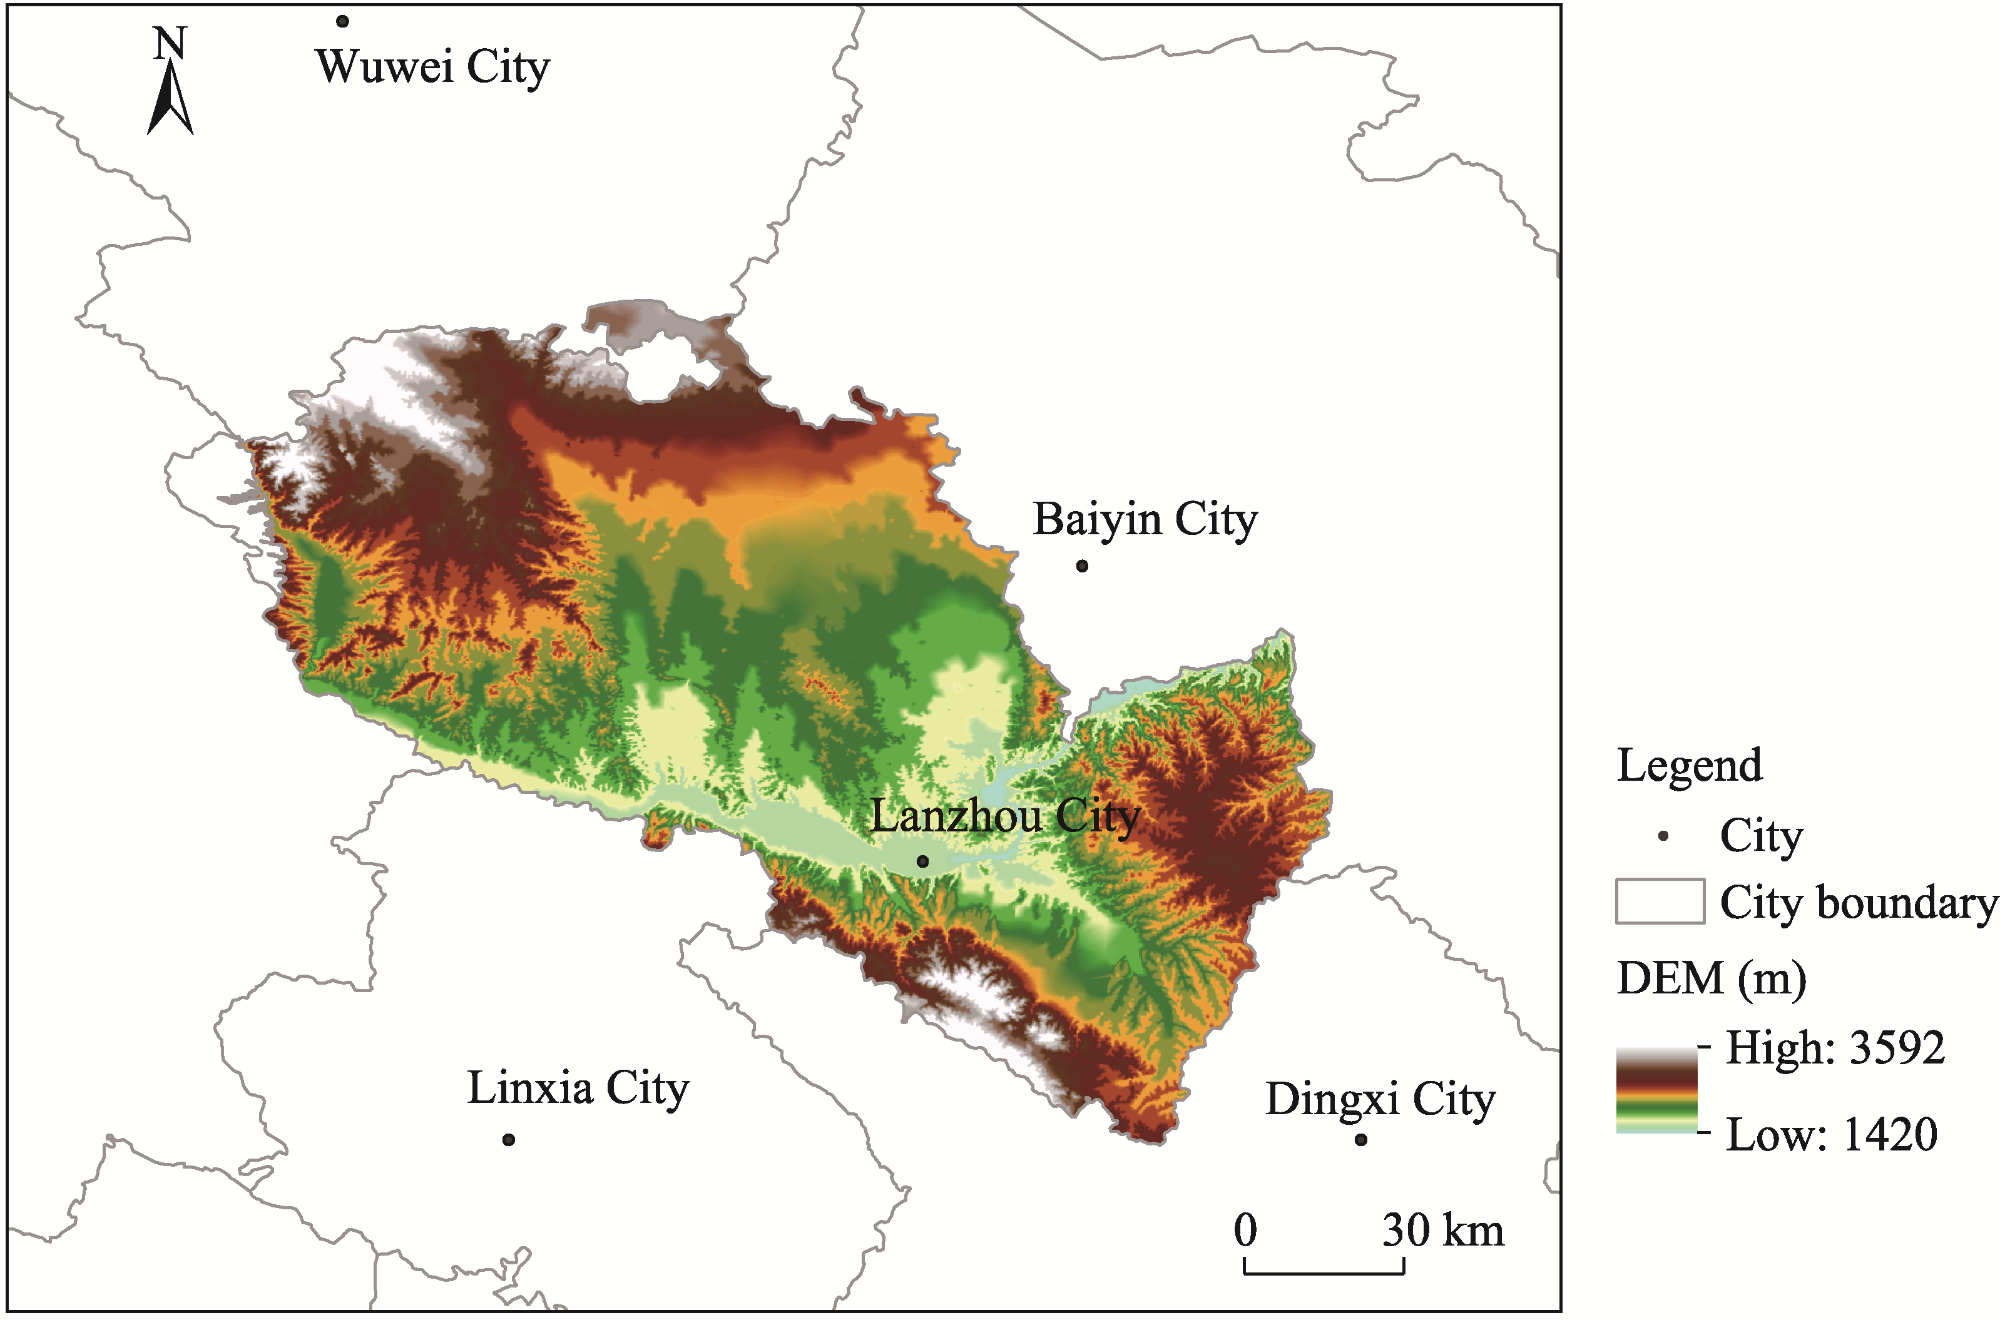
Fig. 1 Location of Lanzhou City and overview of Lanzhou based on DEM (digital elevation model) |
Table 1 Description of the driving factors of land use changes in Lanzhou |
| Data name | Year | Resolution | Source |
|---|---|---|---|
| GDP | 2020 | 1 km | Resource and Environmental Science Data Platform (https://www.resdc.cn) |
| Population | 2020 | 1 km | Resource and Environmental Science Data Platform (https://www.resdc.cn) |
| DEM | 2015 | 30 m | Geospatial Data Cloud (https://www.gscloud.cn) |
| Slope | 2020 | 1 km | Calculated based on DEM |
| Aspect | 2020 | 1 km | Calculated based on DEM |
| Distance from railway | 2020 | 1 km | OSM road data (https://www.openstreetmap.org/) processed based on Euclidean distance |
| Distance from first-order stream | 2020 | 1 km | OSM road data (https://www.openstreetmap.org/) processed based on Euclidean distance |
| Distance from downtown | 2020 | 1 km | OSM road data (https://www.openstreetmap.org/) processed based on Euclidean distance |
| Distance from highway | 2020 | 1 km | OSM road data (https://www.openstreetmap.org/) processed based on Euclidean distance |
| Distance from provincial road | 2020 | 1 km | OSM road data (https://www.openstreetmap.org/) processed based on Euclidean distance |
| Precipitation | 2020 | 1 km | Resource and Environmental Science Data Platform (https://www.resdc.cn) |
| Air temperature | 2020 | 1 km | Resource and Environmental Science Data Platform (https://www.resdc.cn) |
Note: GDP, gross domestic product; DEM, digital elevation model; OSM, OpenStreetMap. |
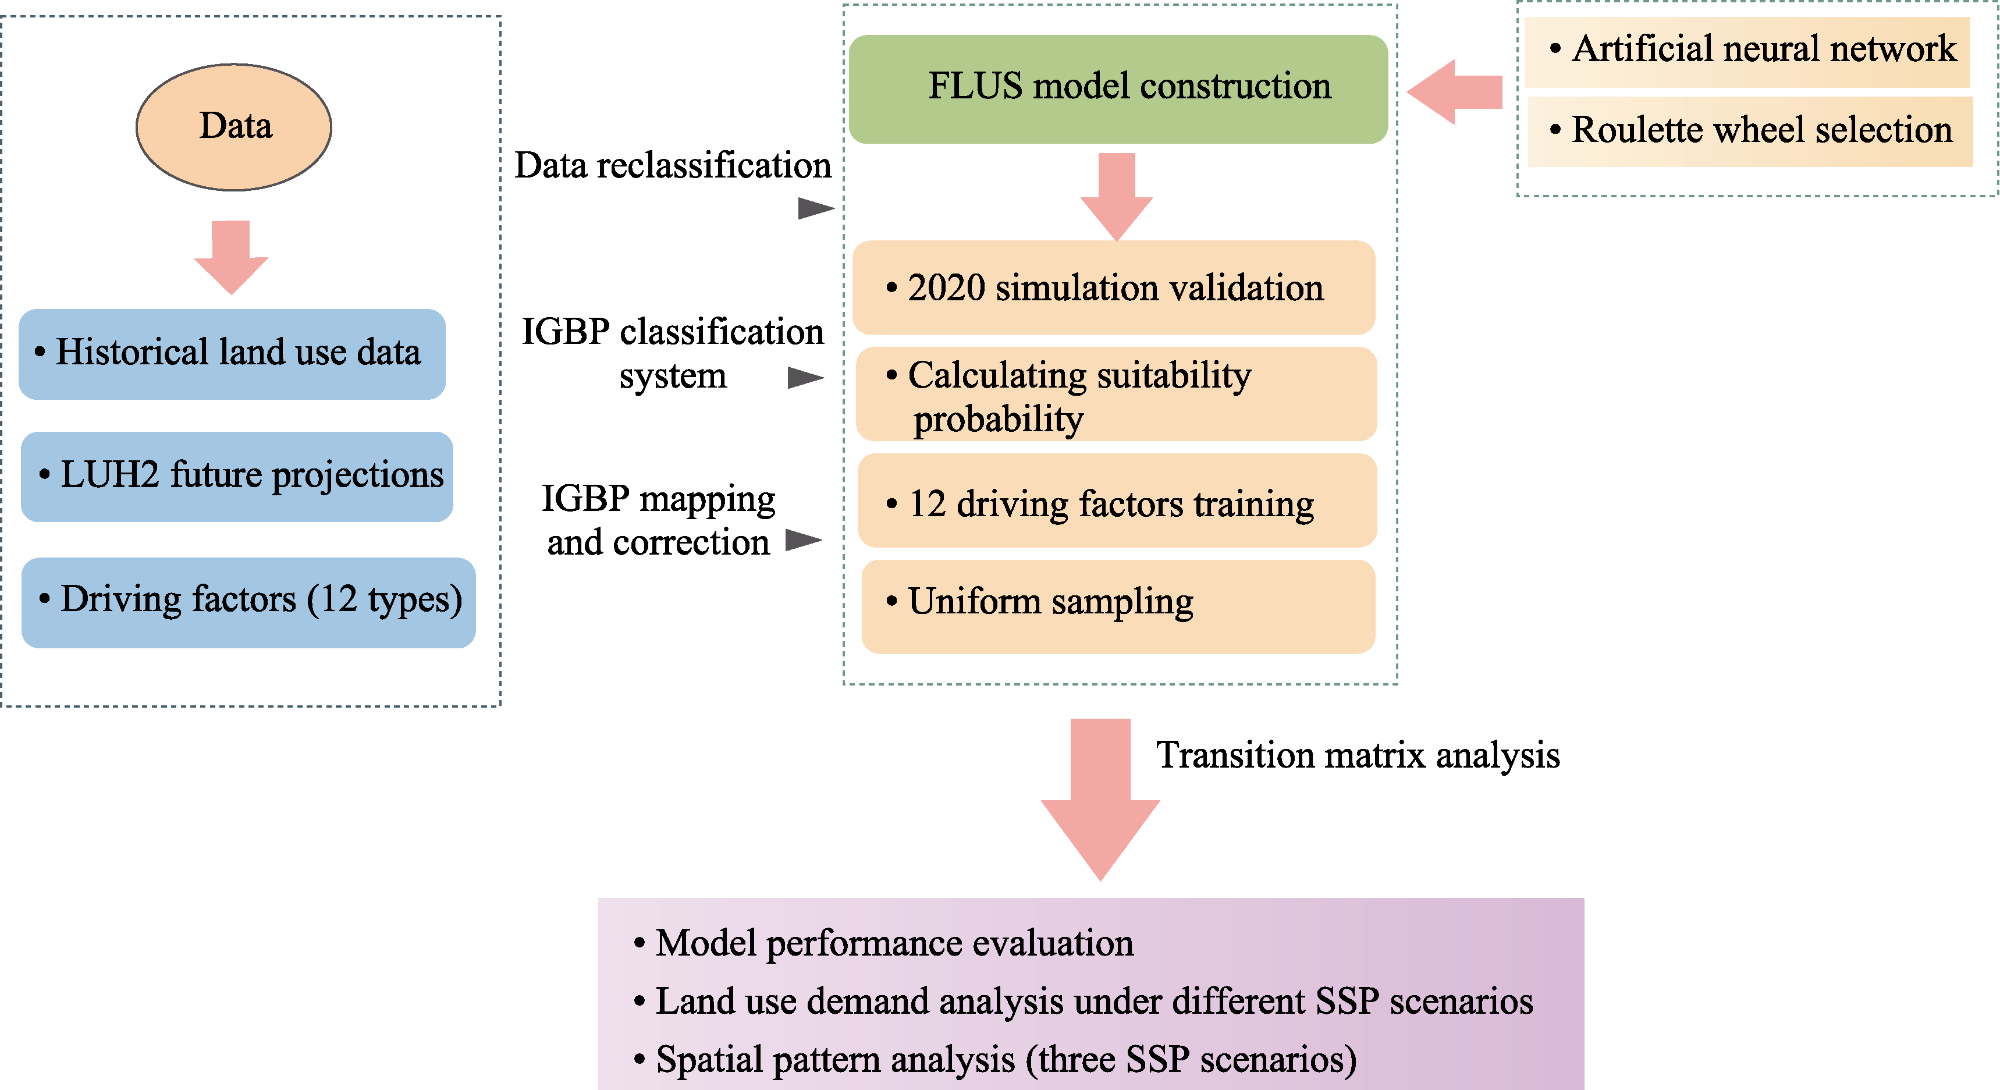
Fig. 2 Technology workflow used in this study. LUH2, Land Use Harmonization 2; IGBP, International Geosphere Biosphere Programme; FLUS, Future Land Use Simulation; SSP, Shared Socioeconomic Pathway. |
Table 2 Reclassification of land use types in Lanzhou |
| Initial land use type in LUH2 | Reclassification of land use type | LUCC classification code |
|---|---|---|
| C3 annual crops | Farmland | 1 |
| C3 perennial crops | ||
| C4 annual crops | ||
| C4 perennial crops | ||
| C3 nitrogen-fixing crops | ||
| Primary forest | Forest | 2 |
| Potential secondary forest | ||
| Anthropogenically managed rangeland | Grassland | 3 |
| Rangeland | ||
| Urban land | Urban land | 5 |
| Non-forested primary land | Bare land | 6 |
| Potentially non-forested secondary land |
Note: LUH2, Land Use Harmonization 2; LUCC, land use and land cover change. |
Table 3 Mapping relationship between IGBP and LUCC classification in Lanzhou |
| Land use type | IGBP land use type classification code | Land use change classification code |
|---|---|---|
| Urban and built-up land | 1 | 51, 53, 54 |
| Dry cropland and pasture | 2 | |
| Irrigated cropland and pasture | 3 | 11, 12, 52 |
| Mixed dry/irrigated cropland and pasture | 4 | |
| Cropland/grassland mosaic | 5 | |
| Cropland/woodland mosaic | 6 | |
| Grassland | 7 | 31, 32, 33, 34 |
| Shrubland | 8 | 23, 22 |
| Mixed shrubland/grassland | 9 | 24, 25 |
| Savannah | 10 | |
| Deciduous broadleaf forest | 11 | |
| Deciduous needleleaf forest | 12 | |
| Evergreen broadleaf forest | 13 | |
| Evergreen needleleaf forest | 14 | 21 |
| Mixed forest | 15 | |
| Water bodies | 16 | 41, 42, 43, 46, 99 |
| Herbaceous wetland | 17 | 45, 64 |
| Wooden wetland | 18 | |
| Barren or sparsely vegetated land | 19 | 61, 62, 63, 65, 67 |
| Herbaceous tundra | 20 | |
| Wooded tundra | 21 | |
| Mixed tundra | 22 | |
| Bare ground tundra | 23 | 66 |
| Snow or ice | 24 | 44 |
Note: IGBP, International Geosphere Biosphere Programme. |
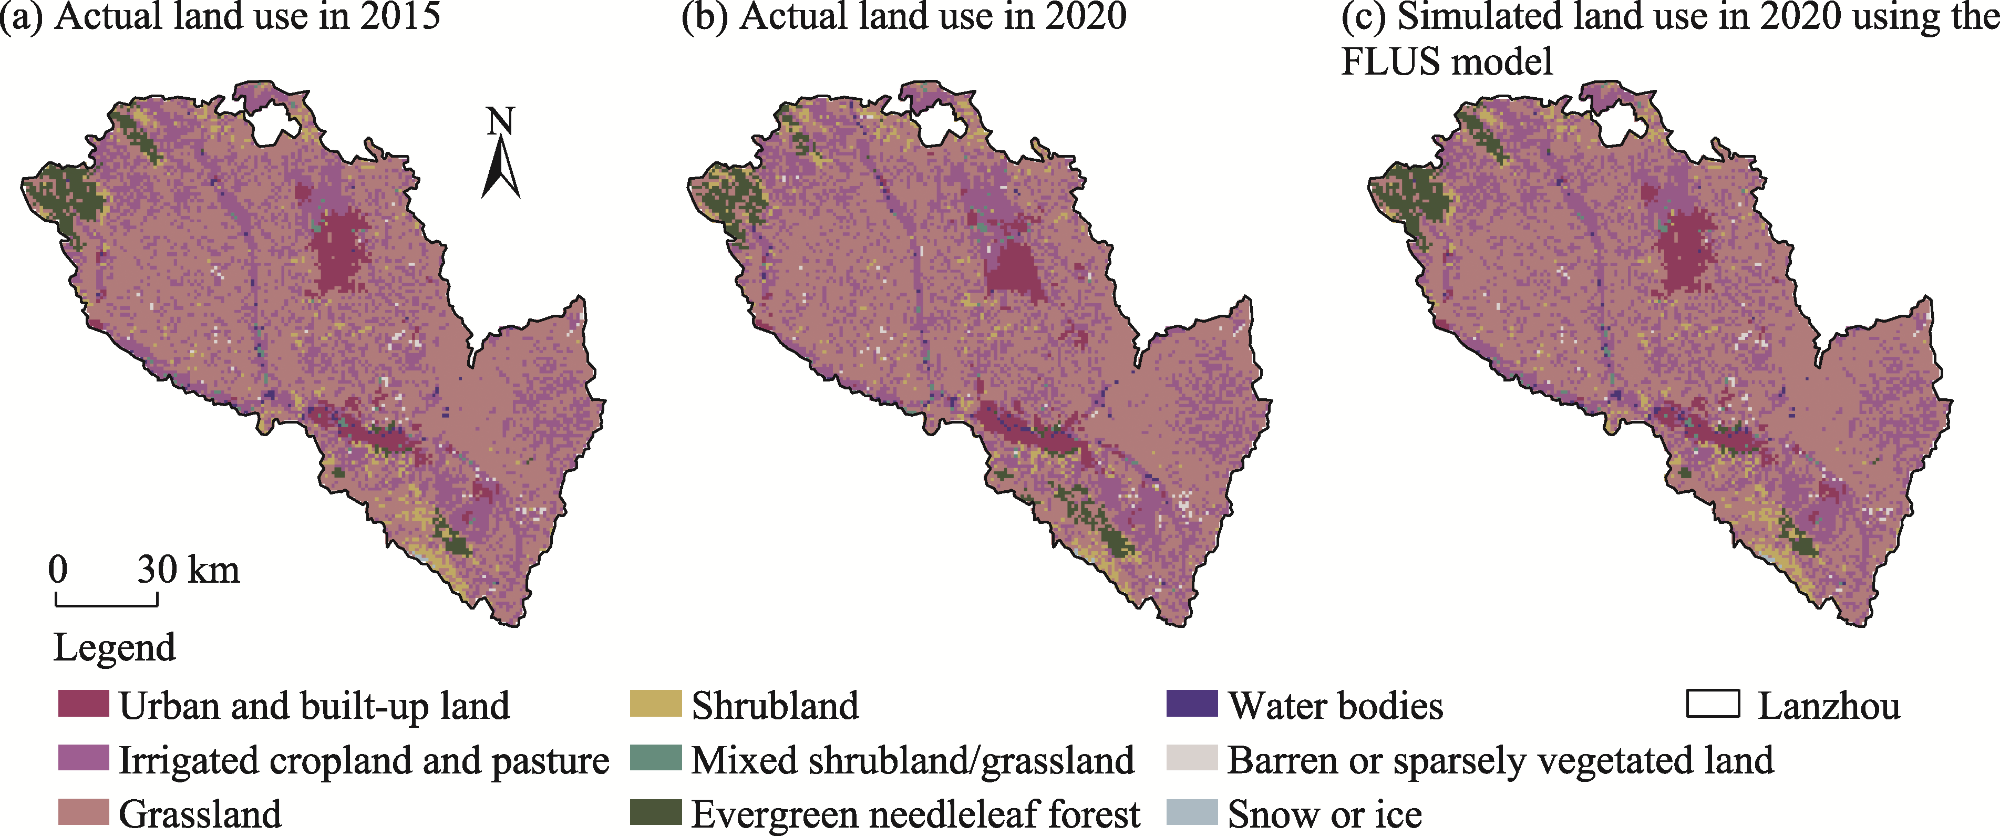
Fig. 3 Land use distribution patterns in Lanzhou. (a), actual land use in 2015; (b), actual land use in 2020; (c), simulated land use in 2020 using the FLUS model. |
Table 4 Transformation matrix of land use types between 2015 and 2020 (unit: km2) |
| 2020 | 2015 | ||||||||
|---|---|---|---|---|---|---|---|---|---|
| Urban and built-up land | Irrigated cropland and pasture | Grassland | Shrubland | Mixed shrubland/grassland | Evergreen needleleaf forest | Water bodies | Barren or sparsely vegetated land | Snow or ice | |
| Urban and built-up land | 267 | 159 | 121 | 5 | 13 | 5 | 6 | 19 | 0 |
| Irrigated cropland and pasture | 32 | 1939 | 1566 | 55 | 27 | 16 | 32 | 15 | 0 |
| Grassland | 13 | 1590 | 5913 | 196 | 9 | 66 | 9 | 34 | 1 |
| Shrubland | 0 | 65 | 170 | 179 | 2 | 29 | 0 | 0 | 5 |
| Mixed shrubland/grassland | 2 | 31 | 7 | 0 | 18 | 0 | 3 | 0 | 0 |
| Evergreen needleleaf forest | 2 | 24 | 112 | 56 | 0 | 232 | 1 | 0 | 0 |
| Water bodies | 12 | 39 | 10 | 1 | 2 | 0 | 9 | 1 | 0 |
| Barren or sparsely vegetated land | 0 | 22 | 31 | 3 | 0 | 0 | 0 | 20 | 0 |
| Snow or ice | 0 | 0 | 2 | 2 | 0 | 0 | 0 | 0 | 2 |
Table 5 Estimated areas of various land use types in Lanzhou in the future under different SSP scenarios |
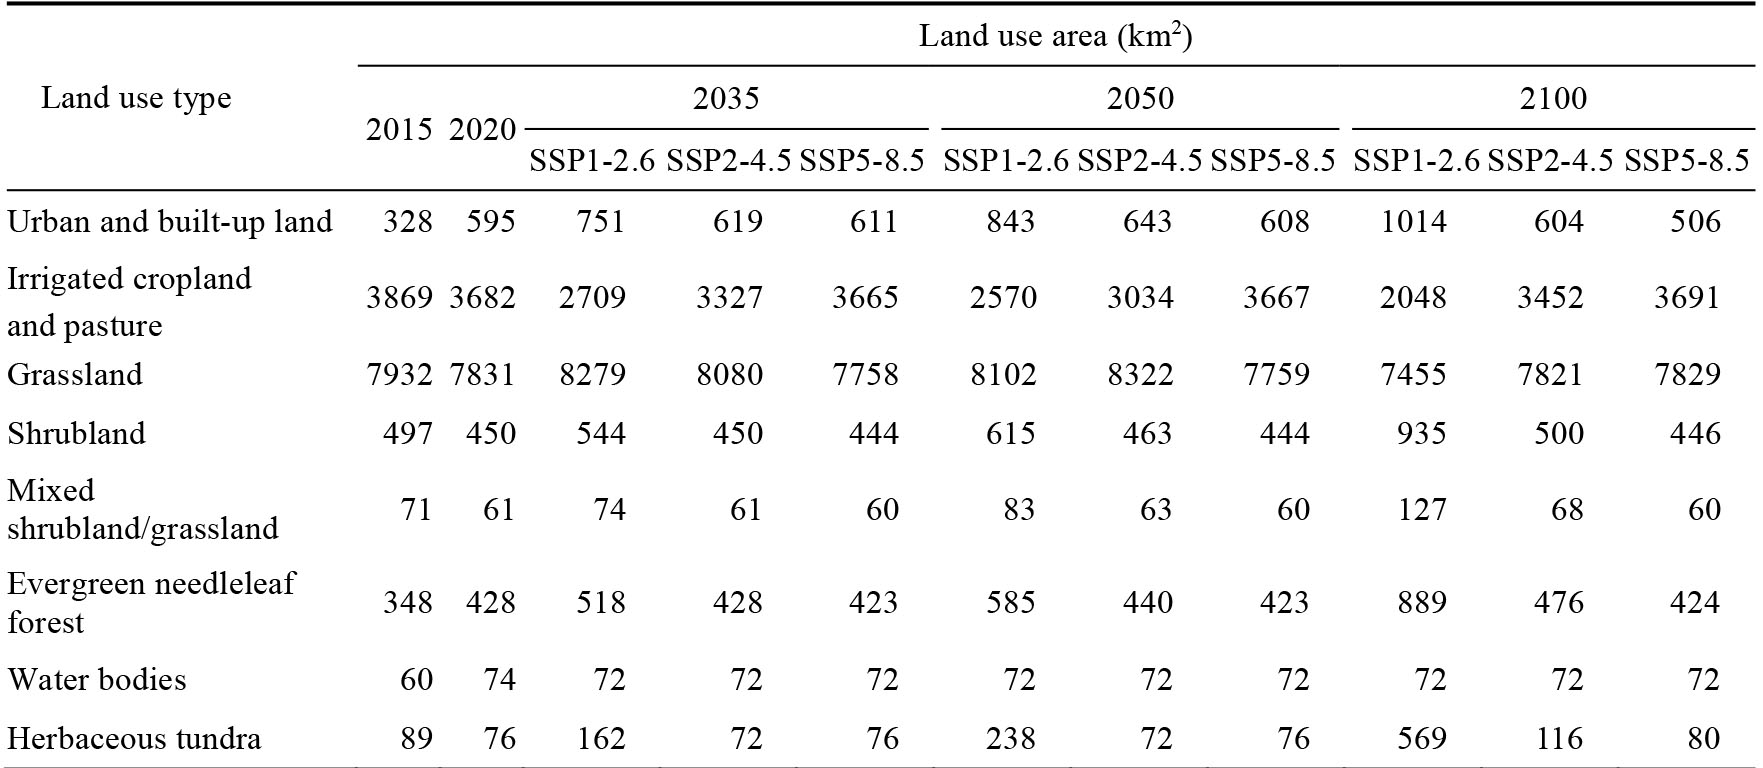 |
Fig. 4 Land use demand in Lanzhou in the future under different SSP scenarios |
Fig. 5 Spatial patterns of land use types in Lanzhou in 2030 under different SSP scenarios. (a), SSP1-2.6; (b), SSP2-4.5; (c), SSP5-8.5. |
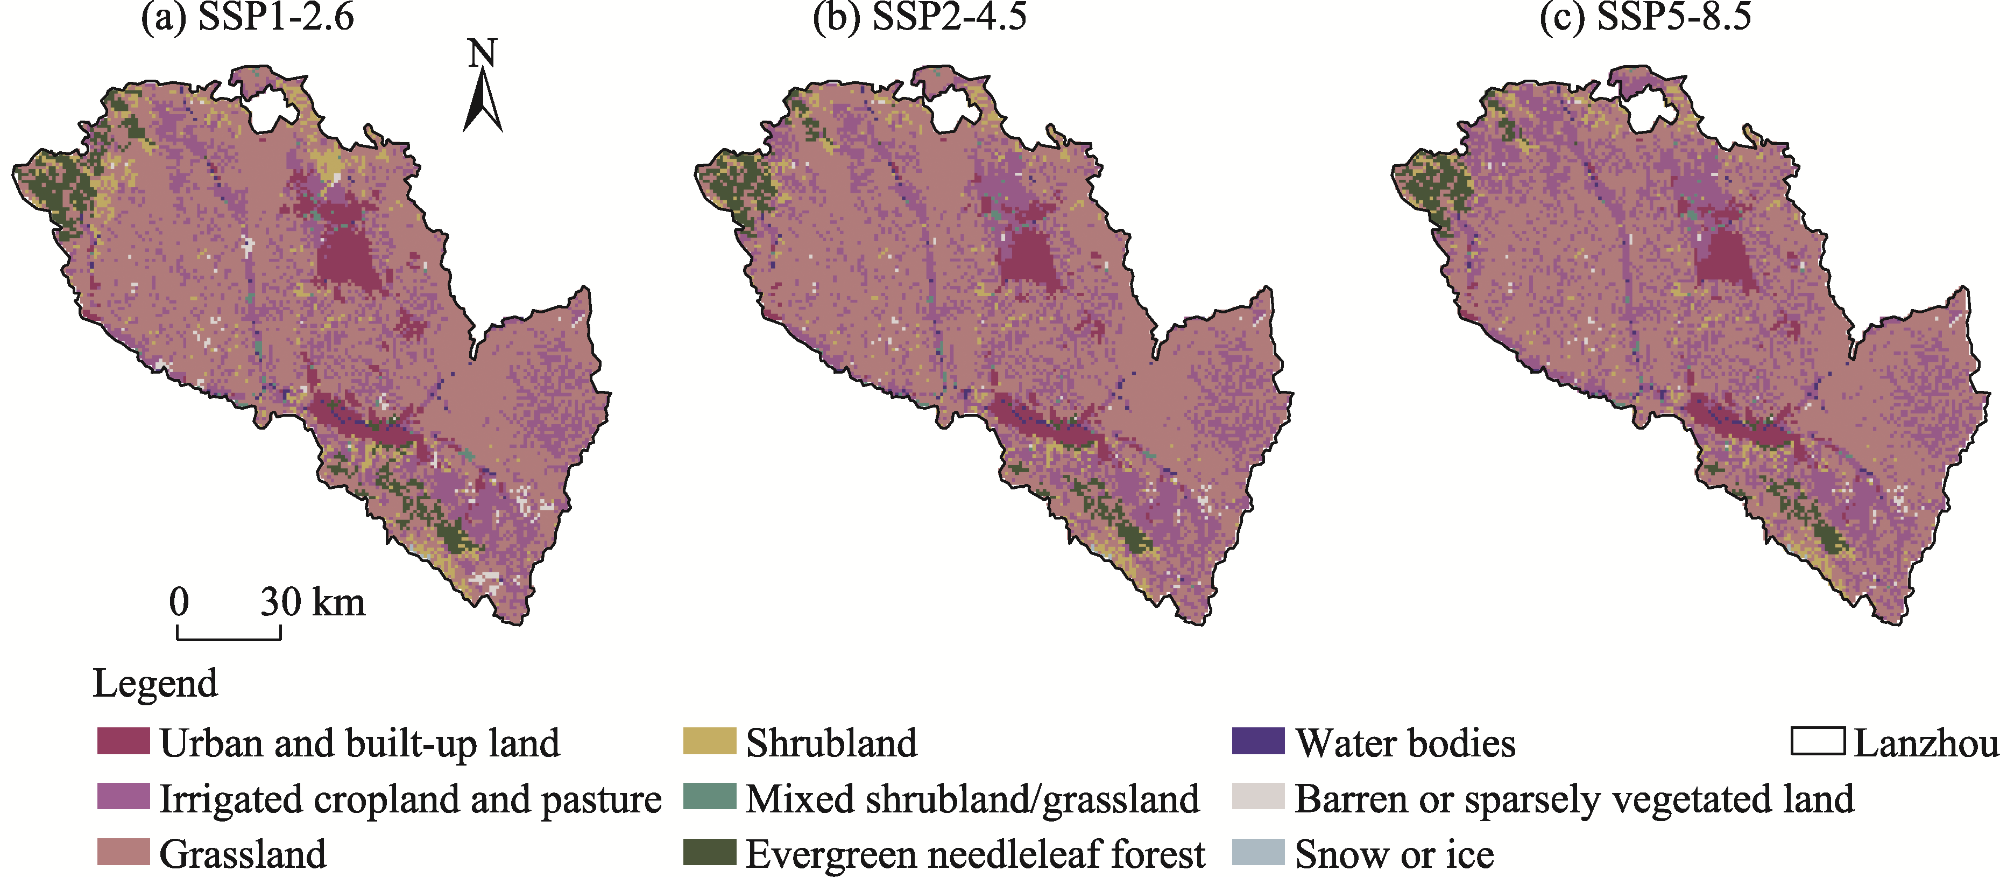
Fig. 6 Spatial patterns of land use types in Lanzhou in 2050 under different SSP scenarios. (a), SSP1-2.6; (b), SSP2-4.5; (c), SSP5-8.5. |
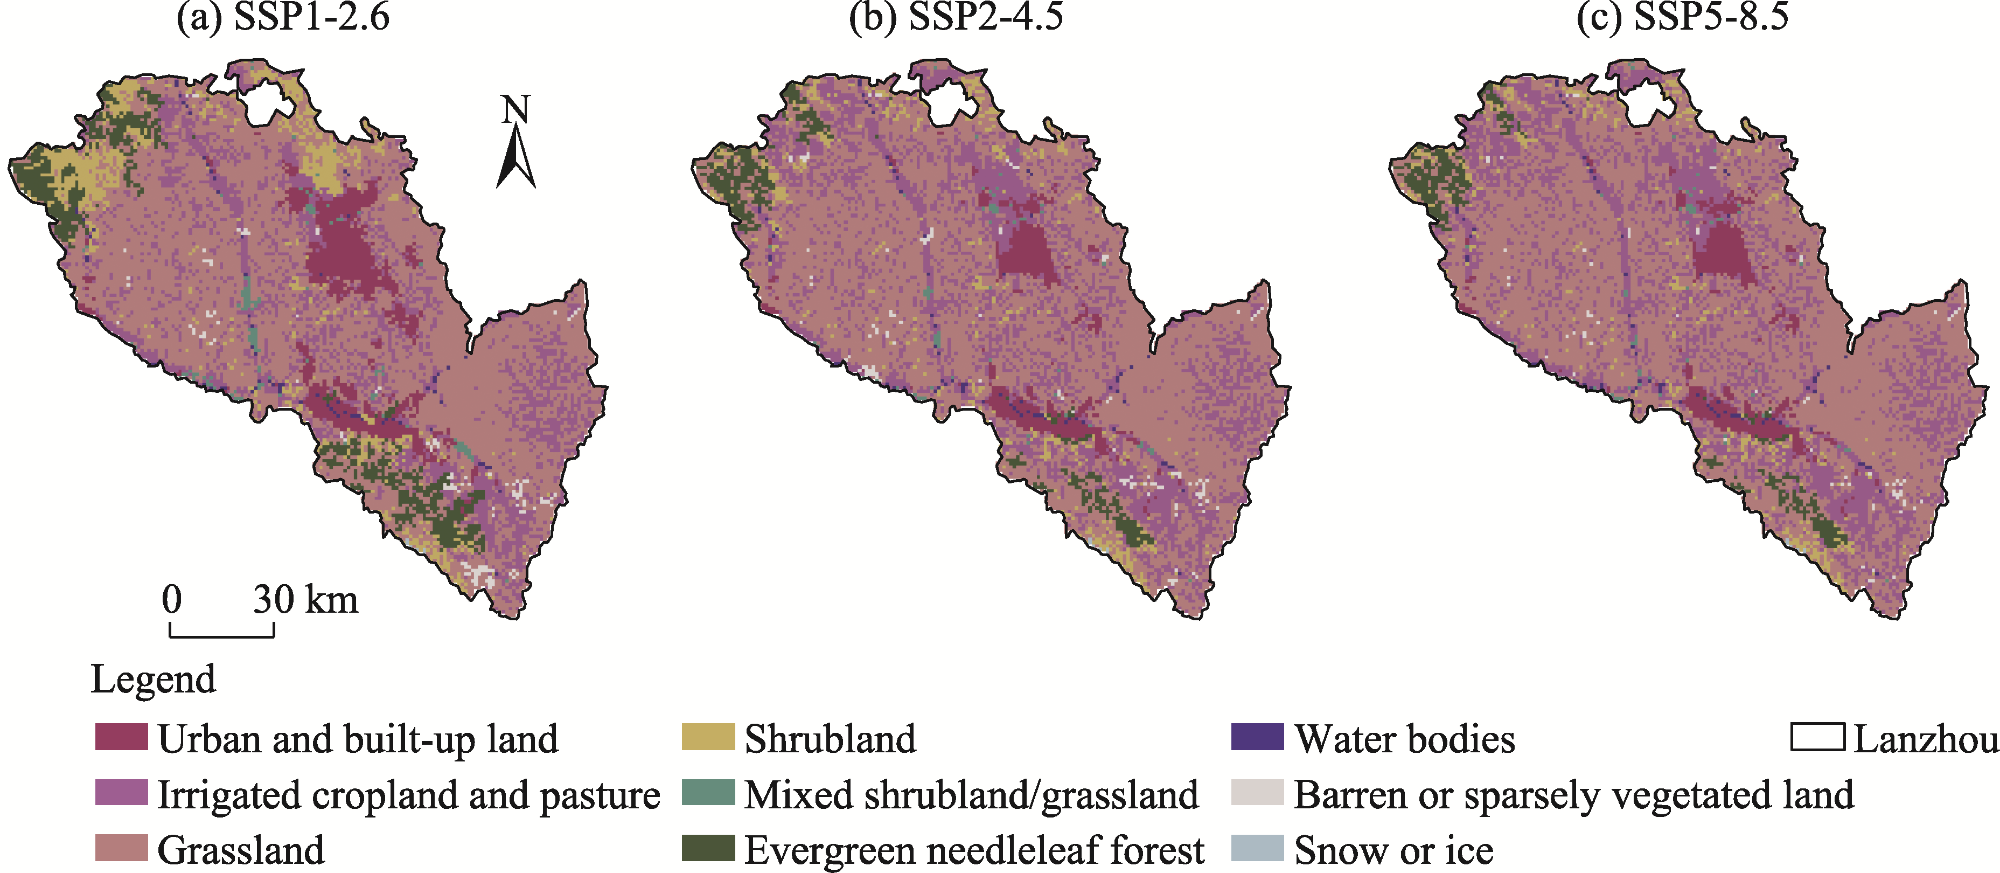
Fig. 7 Spatial patterns of land use types in Lanzhou in 2100 under different SSP scenarios. (a), SSP1-2.6; (b), SSP2-4.5; (c), SSP5-8.5. |
| [1] |
|
| [2] |
|
| [3] |
|
| [4] |
|
| [5] |
|
| [6] |
|
| [7] |
|
| [8] |
|
| [9] |
|
| [10] |
|
| [11] |
|
| [12] |
|
| [13] |
|
| [14] |
|
| [15] |
|
| [16] |
|
| [17] |
|
| [18] |
Intergovernmental Panel on Climate Change (IPCC). 2021. Climate Change 2021:The Physical Science Basis. Contribution of Working Group I to the Sixth Assessment Report of the Intergovernmental Panel on Climate Change. Cambridge, United Kingdom and New York, USA: Cambridge University Press.
|
| [19] |
|
| [20] |
|
| [21] |
|
| [22] |
|
| [23] |
|
| [24] |
|
| [25] |
|
| [26] |
|
| [27] |
|
| [28] |
|
| [29] |
|
| [30] |
|
| [31] |
|
| [32] |
|
| [33] |
|
| [34] |
|
| [35] |
|
| [36] |
|
| [37] |
|
| [38] |
|
| [39] |
|
| [40] |
Standardization Administration of China (SAC) and the General Administration of Quality Supervision, Inspection and Quarantine of China (AQSIQ). 2017. Current Land Use Classification Standard (GB/T 21010-2017). Beijing: Standards Press of China. (in Chinese)
|
| [41] |
|
| [42] |
|
| [43] |
|
| [44] |
|
| [45] |
|
| [46] |
|
| [47] |
|
| [48] |
|
| [49] |
|
| [50] |
|
| [51] |
|
| [52] |
|
| [53] |
|
| [54] |
|
| [55] |
|
| [56] |
|
| [57] |
|
| [58] |
|
| [59] |
|
| [60] |
|
| [61] |
|
/
| 〈 |
|
〉 |
