
Changes and determinants of belowground bud banks of a rhizomatous clonal plant Sophora alopecuroides L. in the desert steppe, northern China
Received date: 2025-05-01
Revised date: 2025-11-06
Accepted date: 2025-11-21
Online published: 2026-02-04
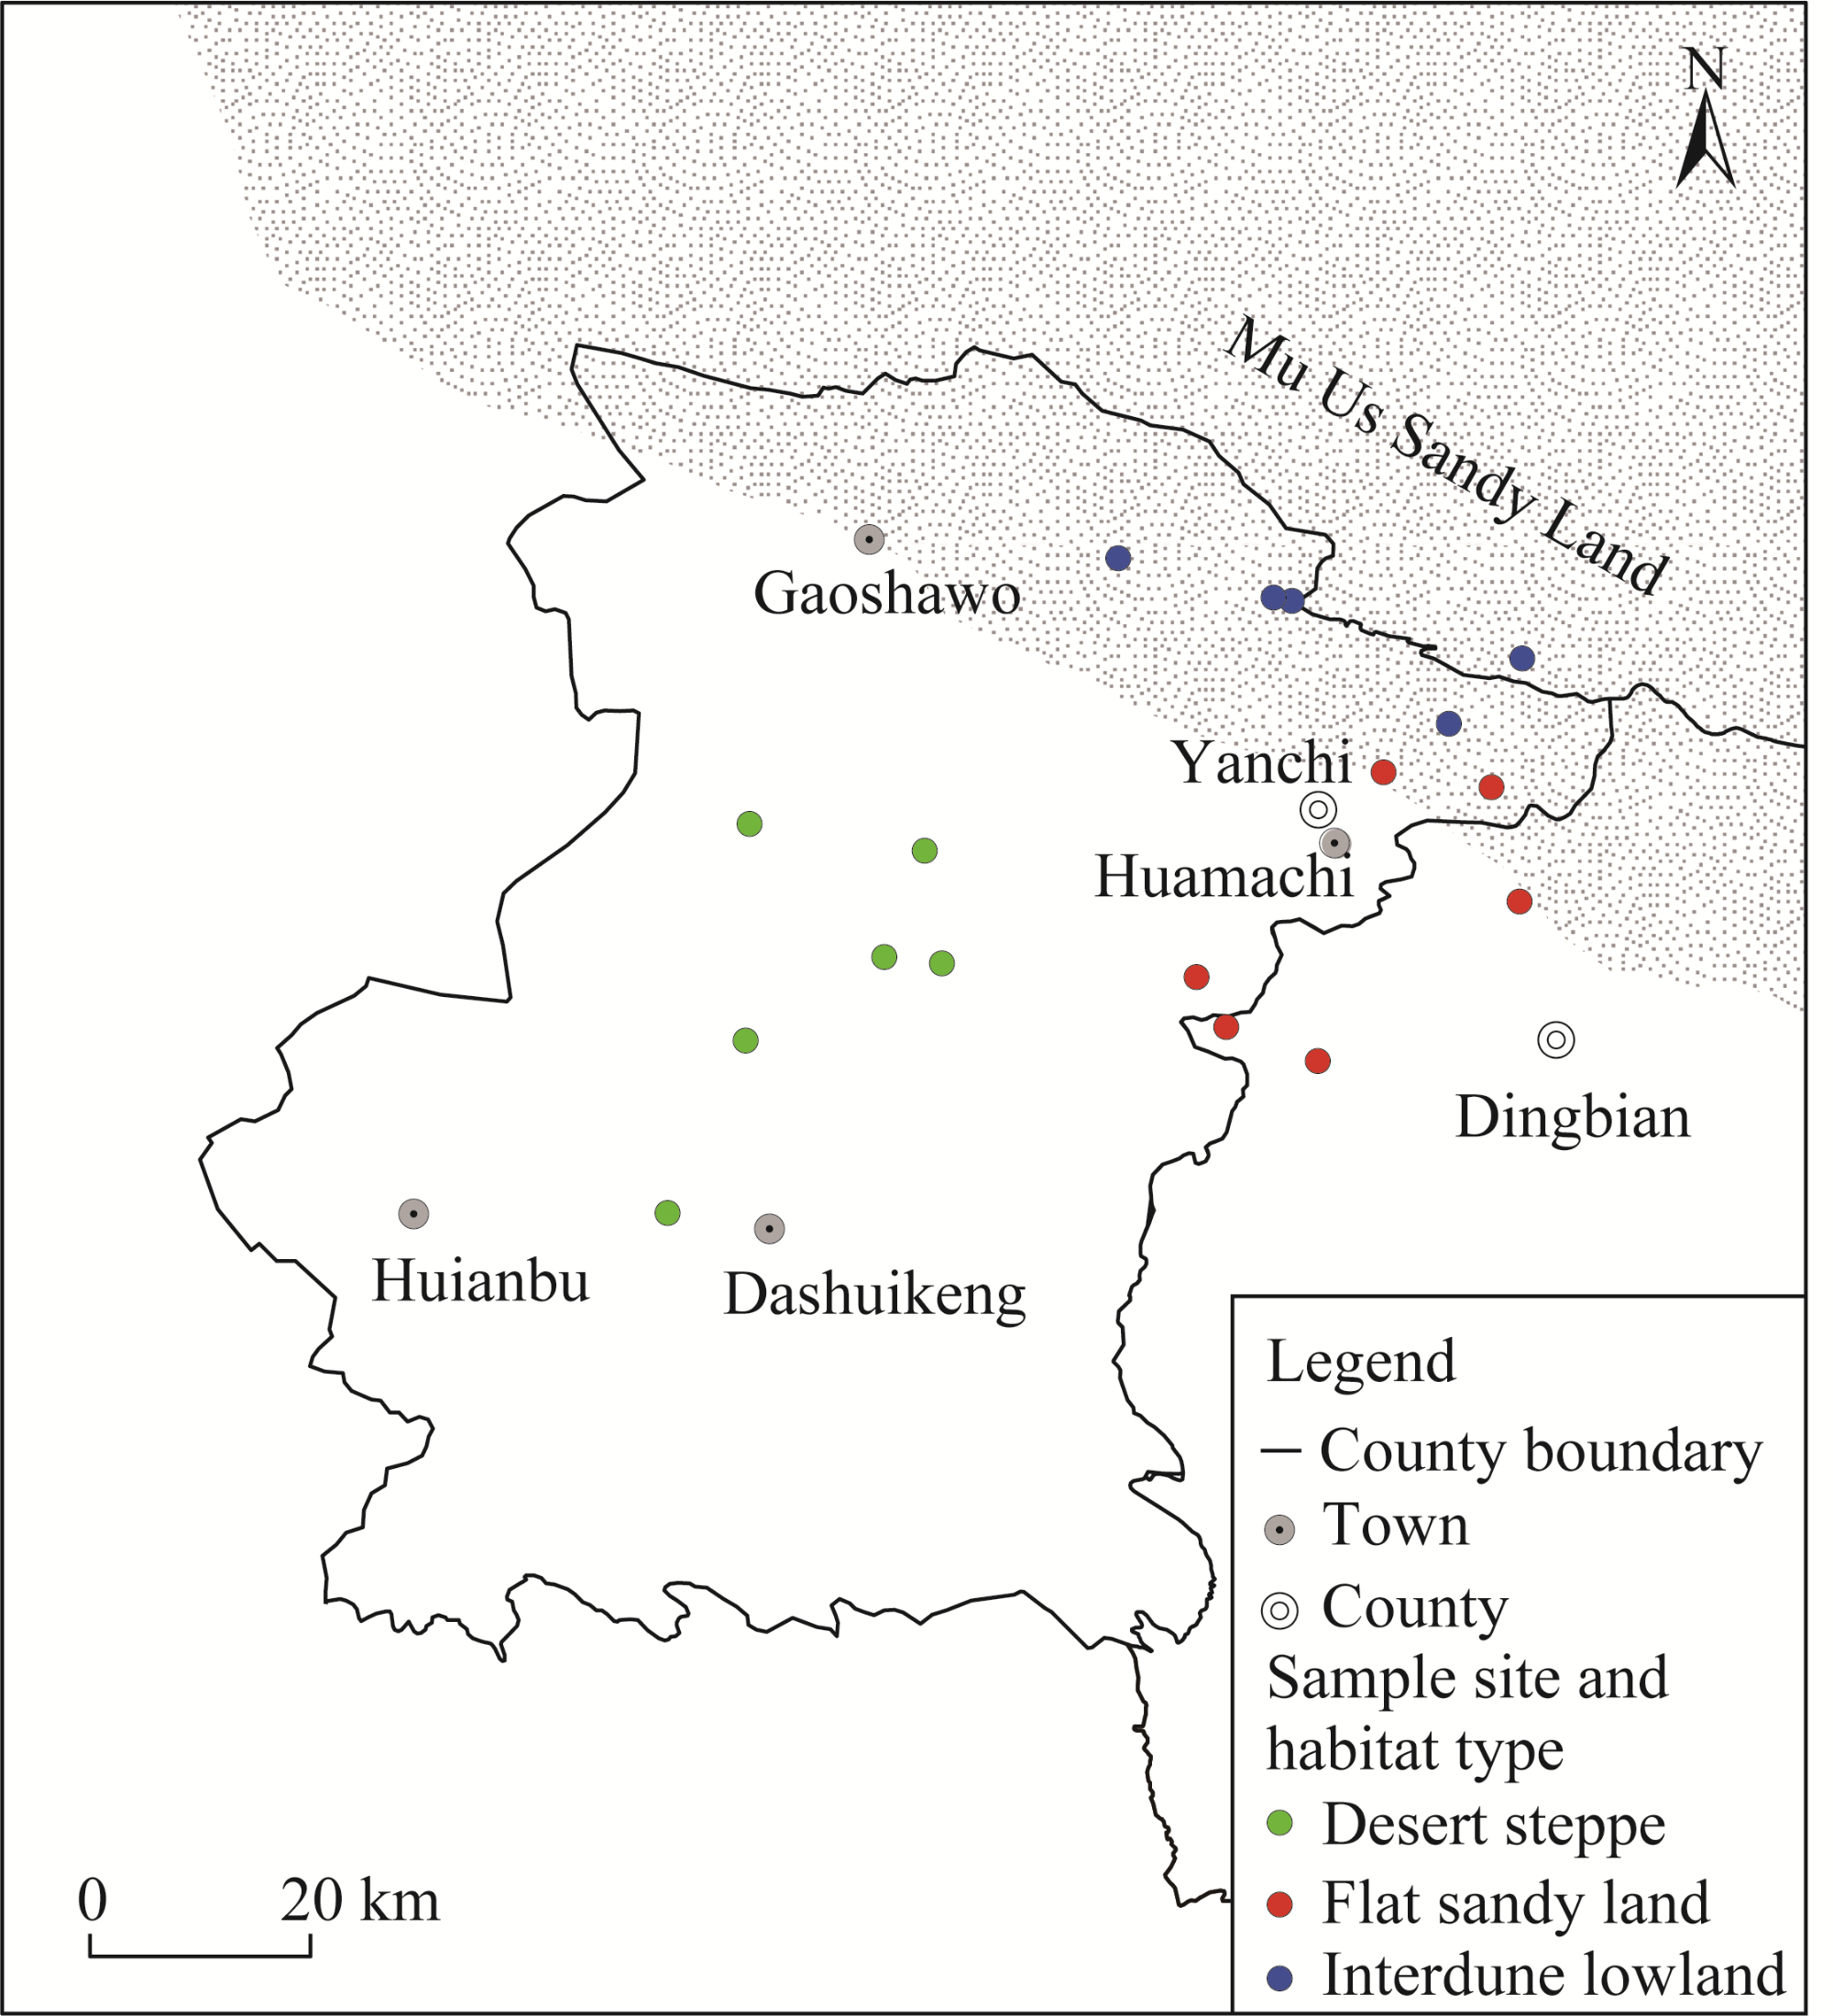
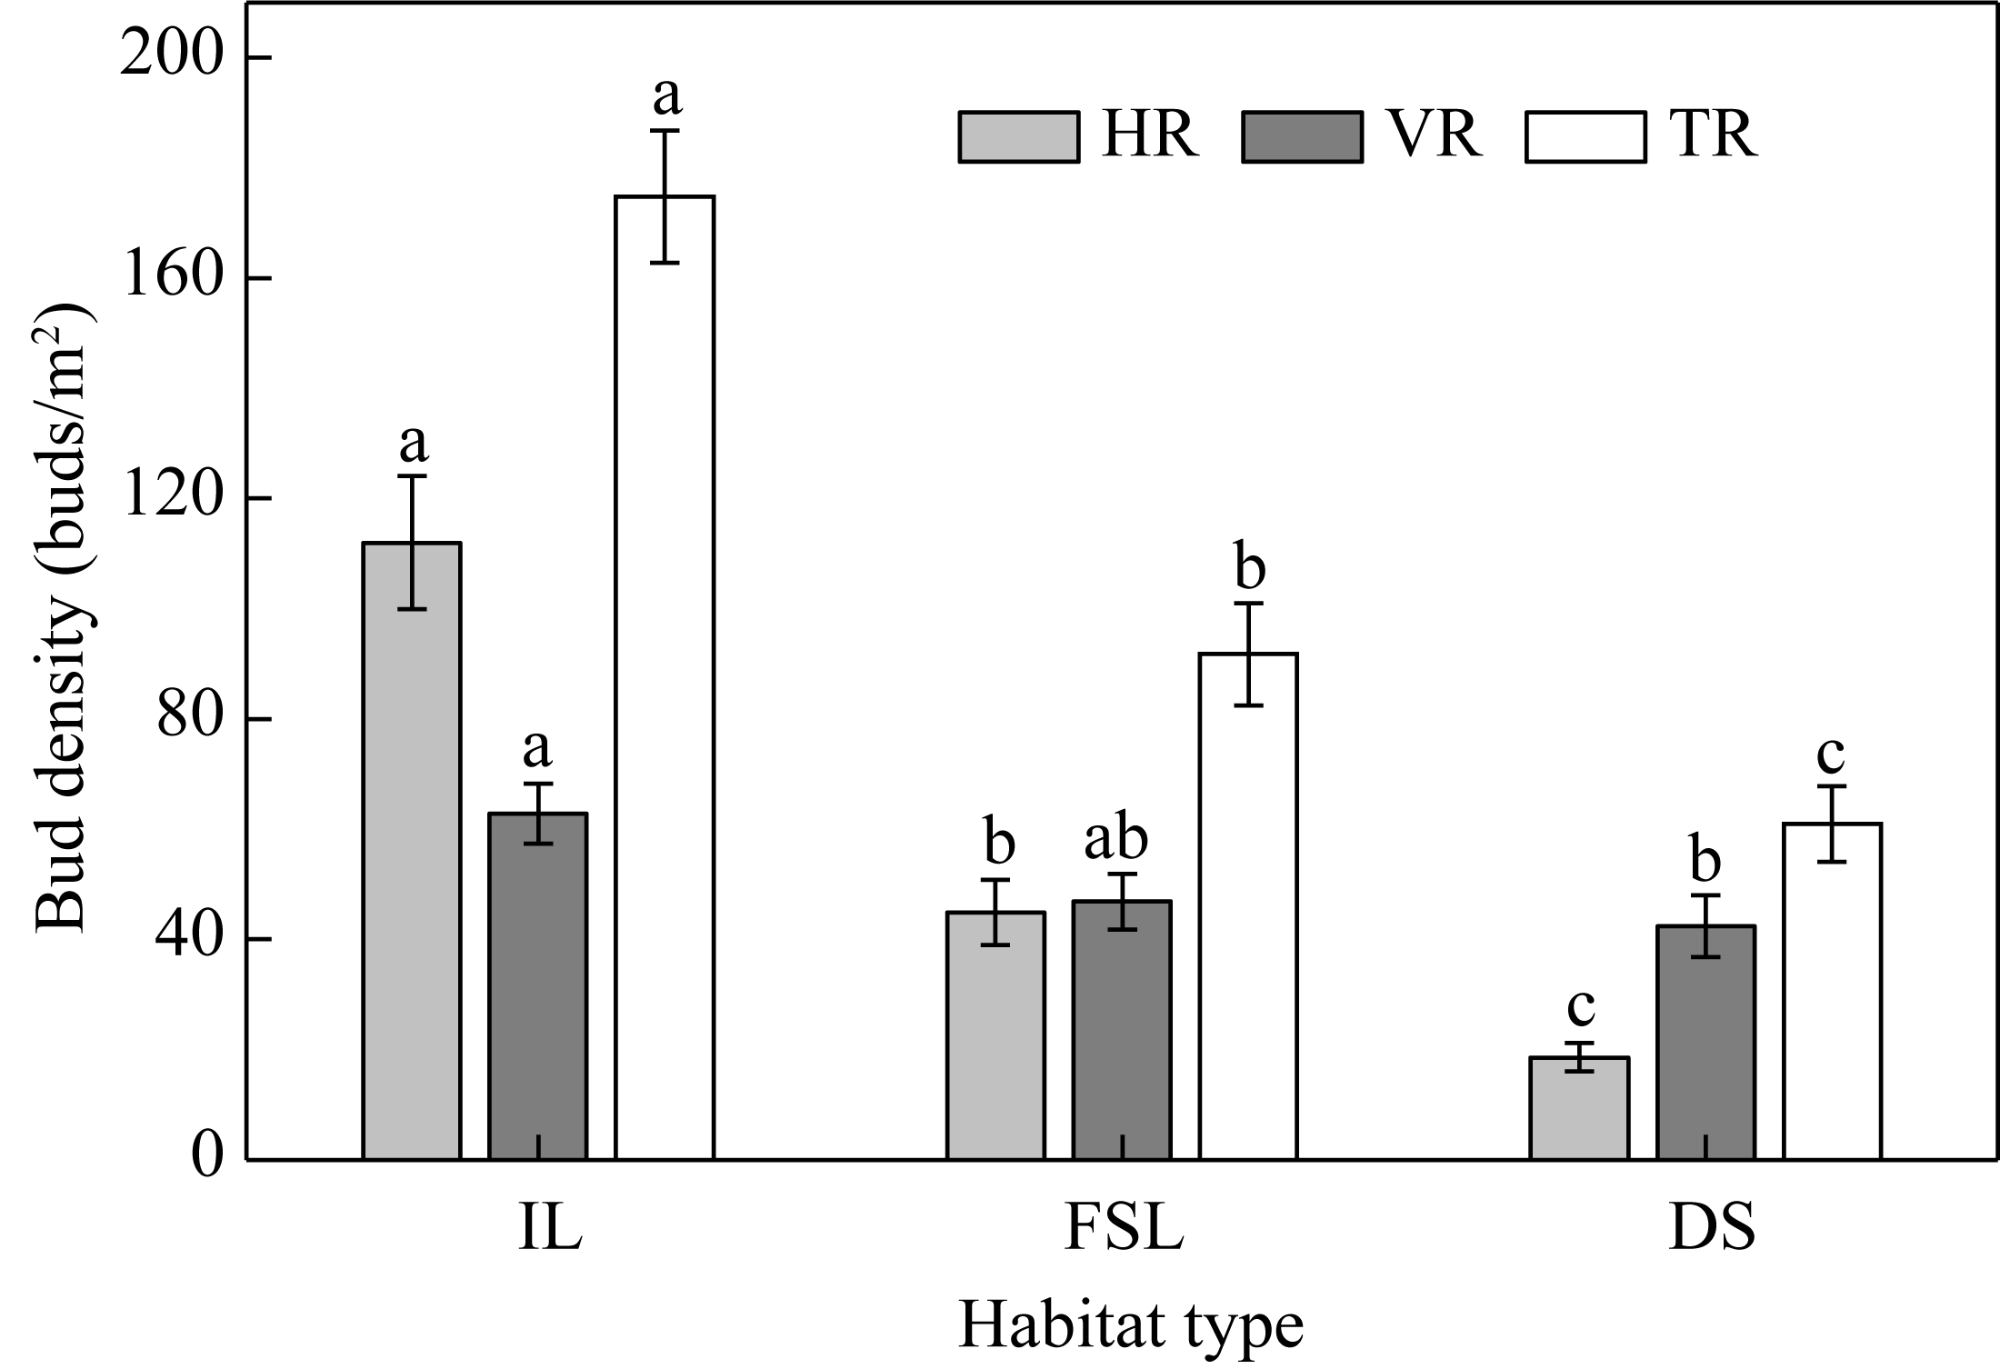
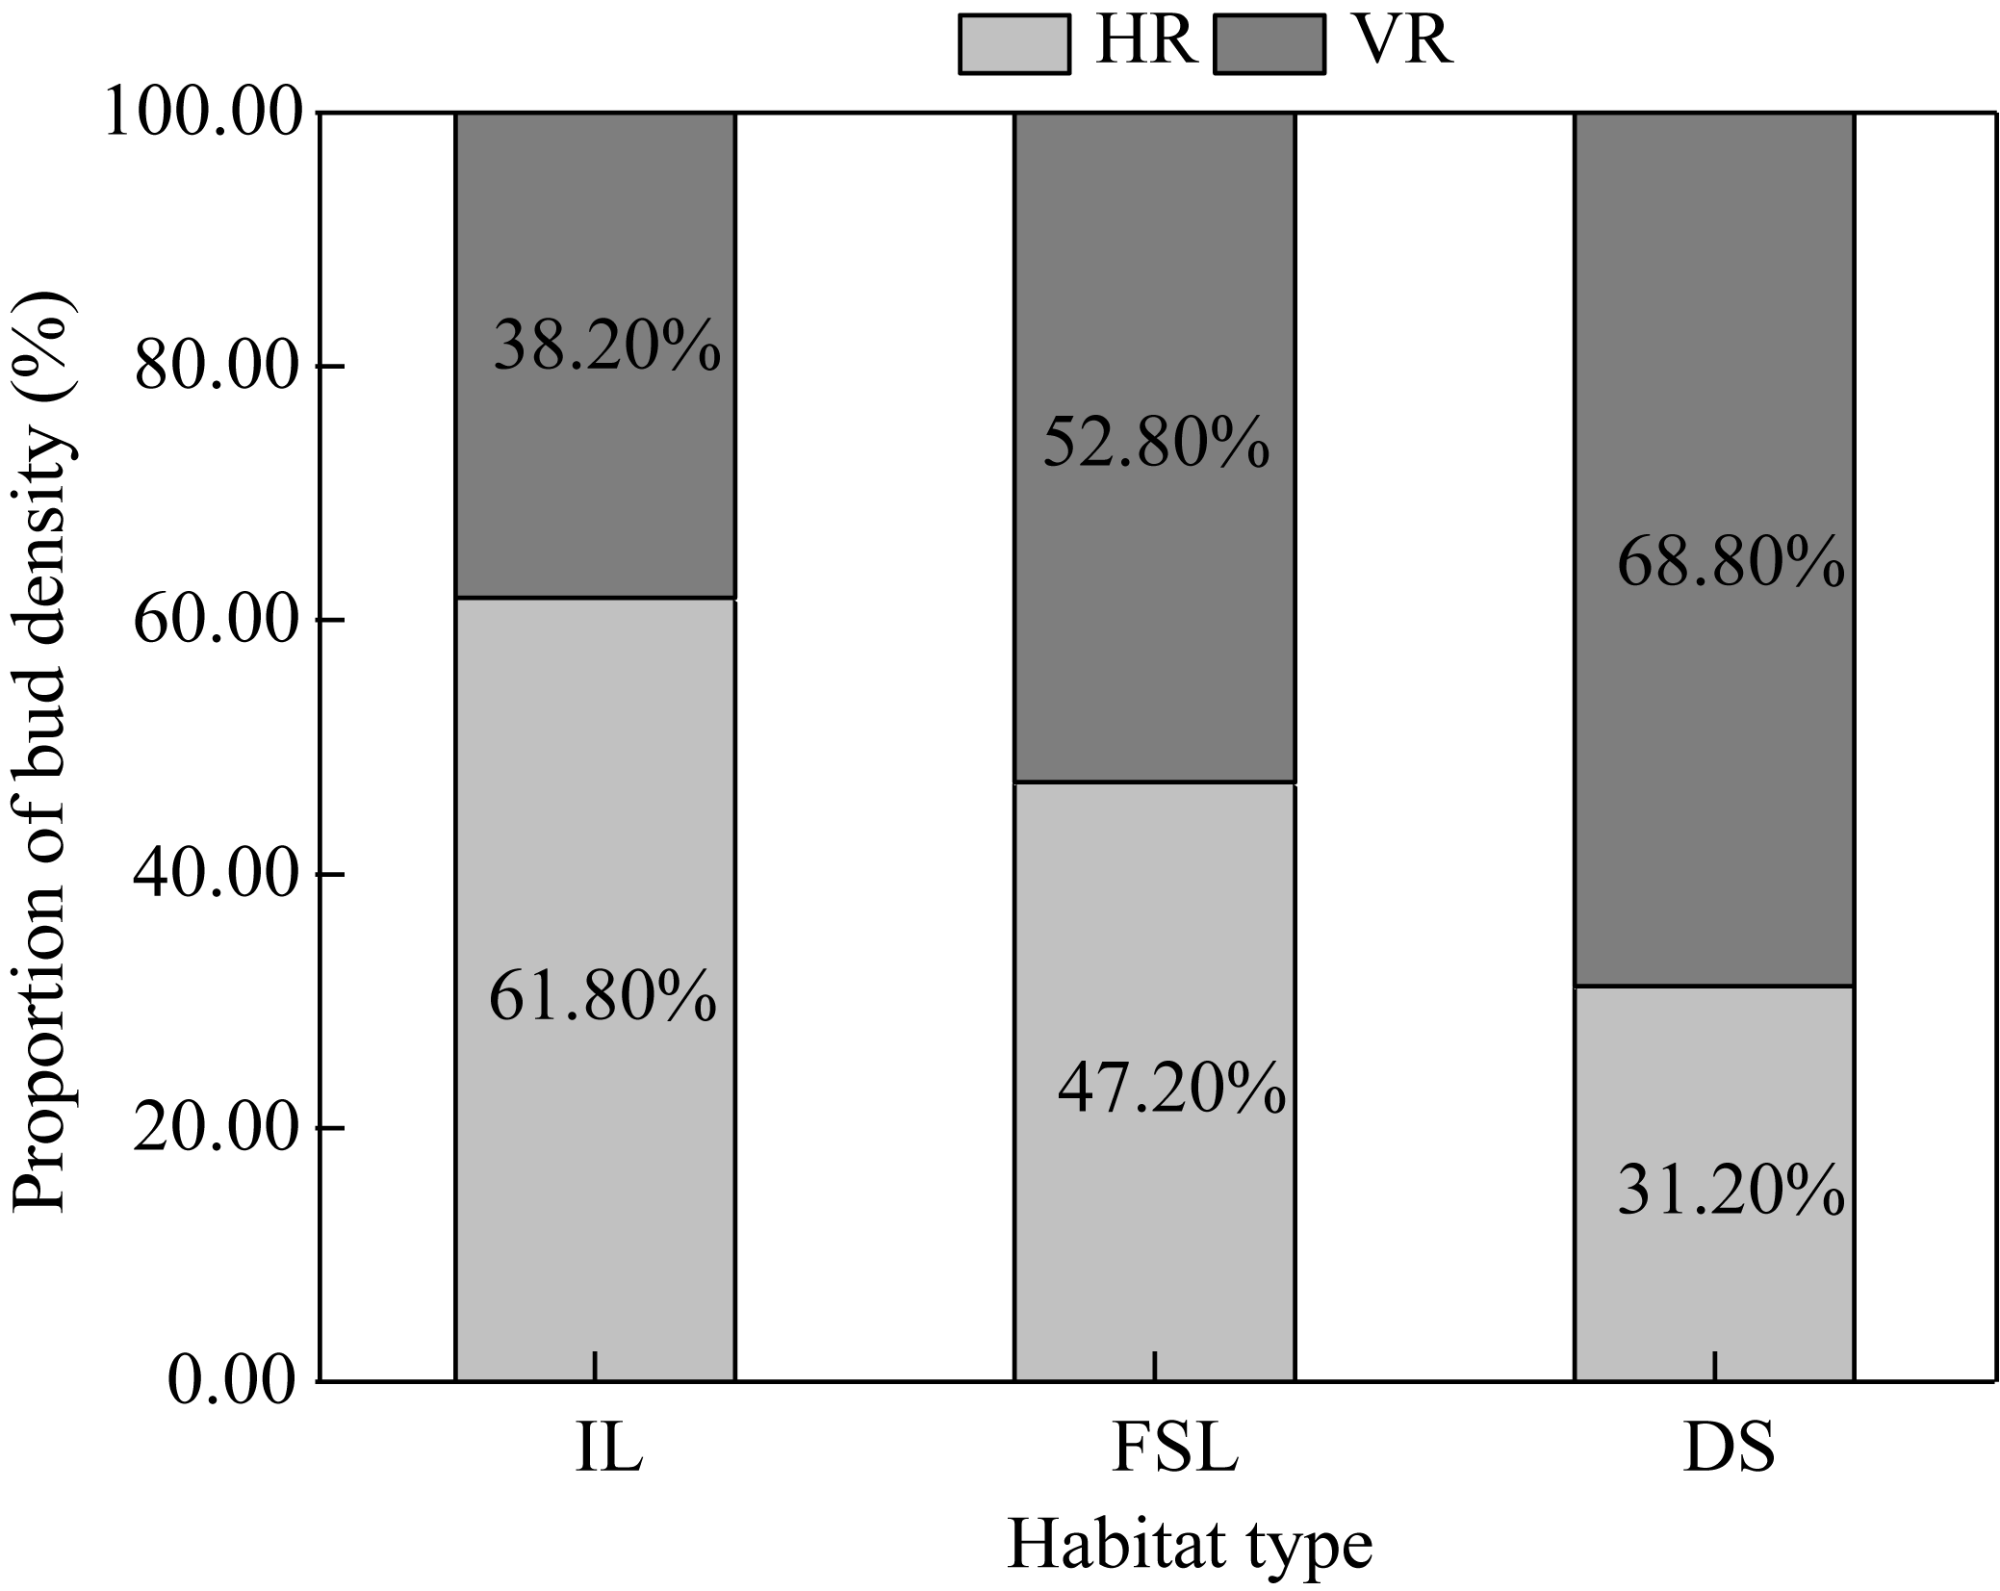
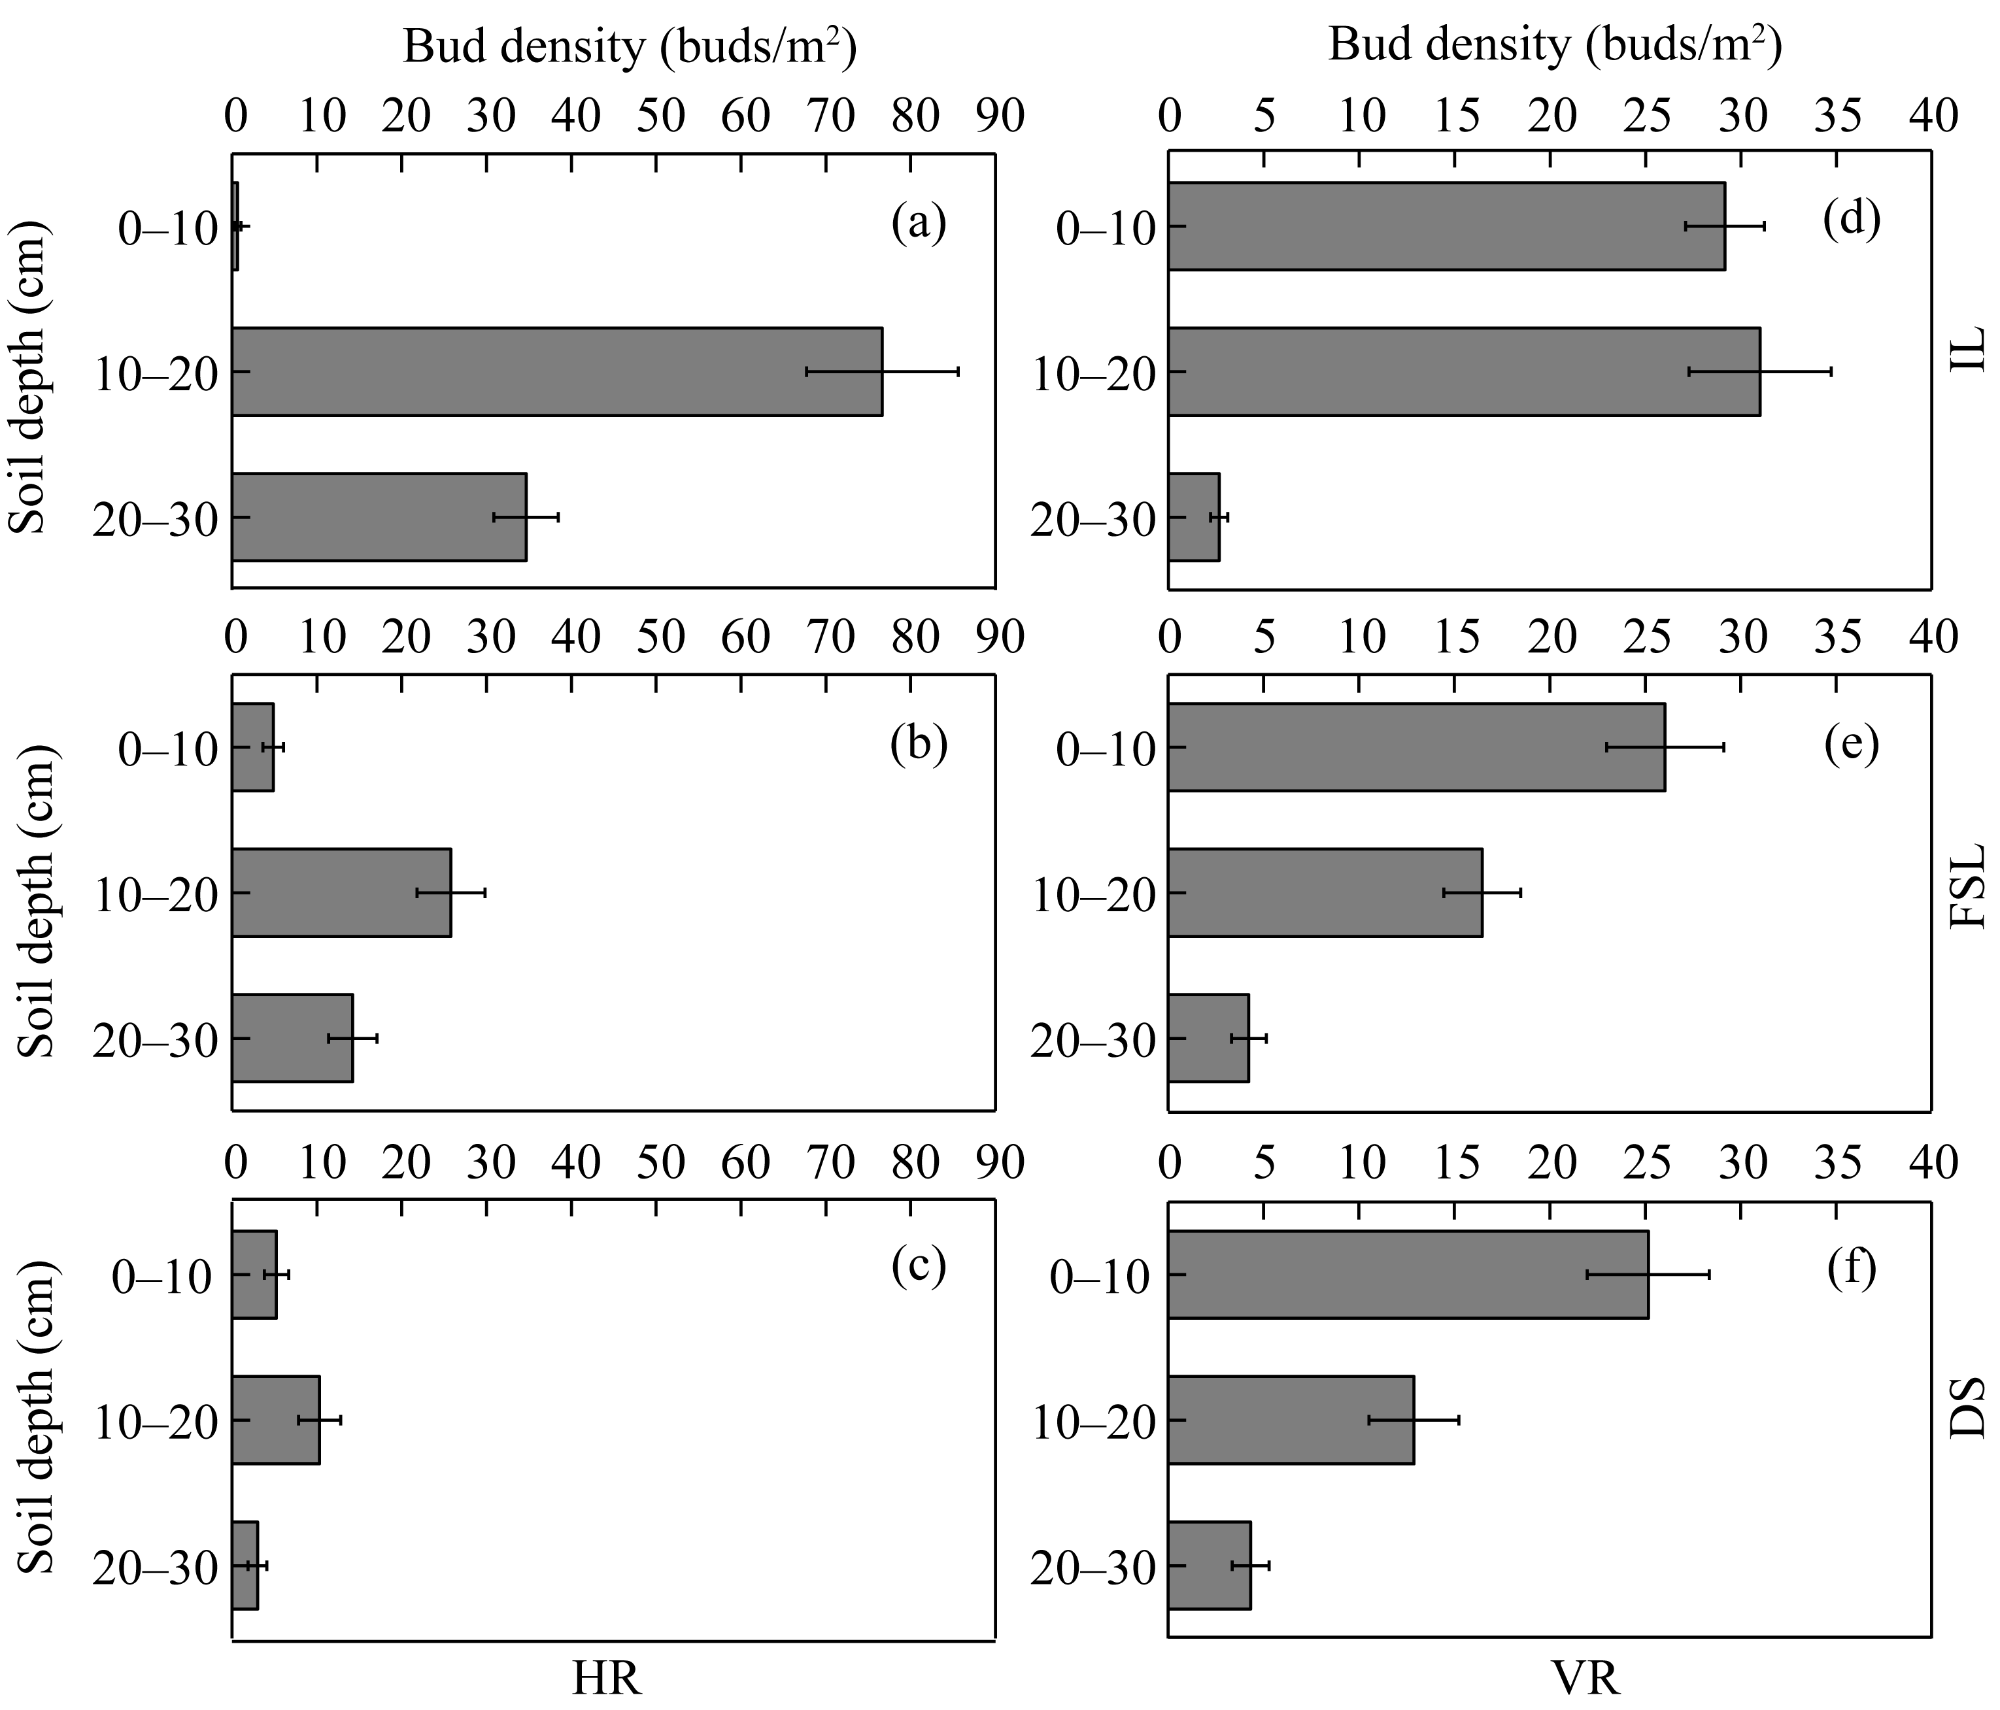
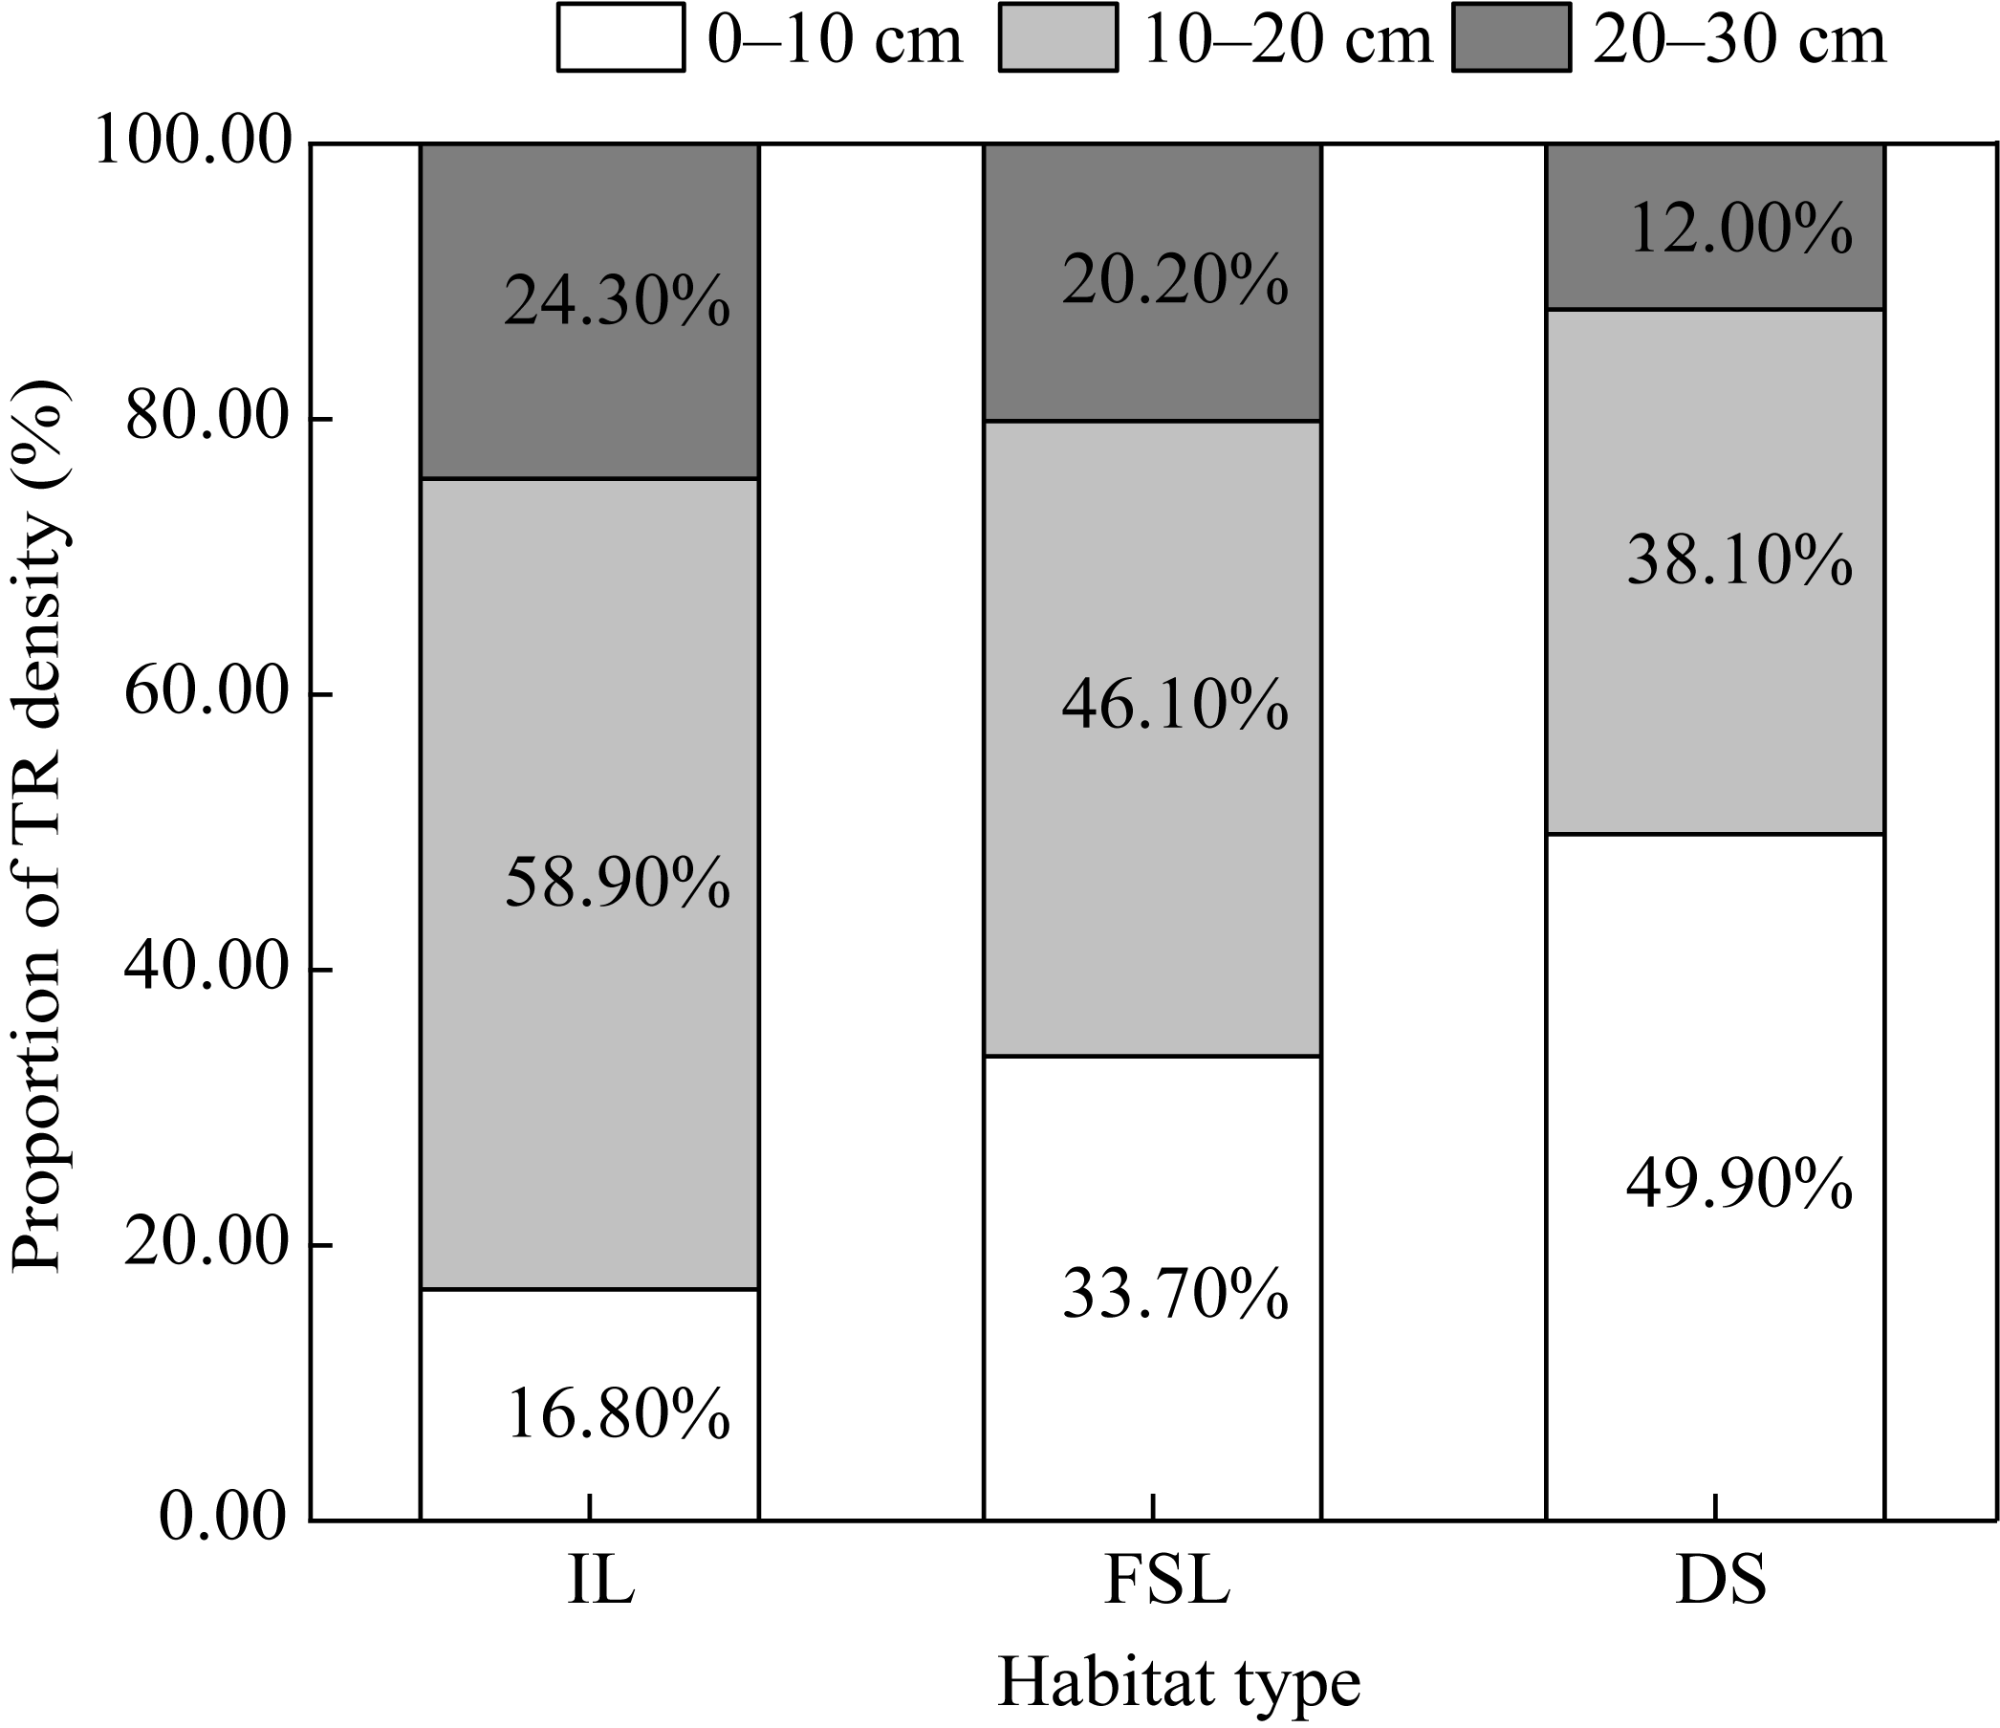
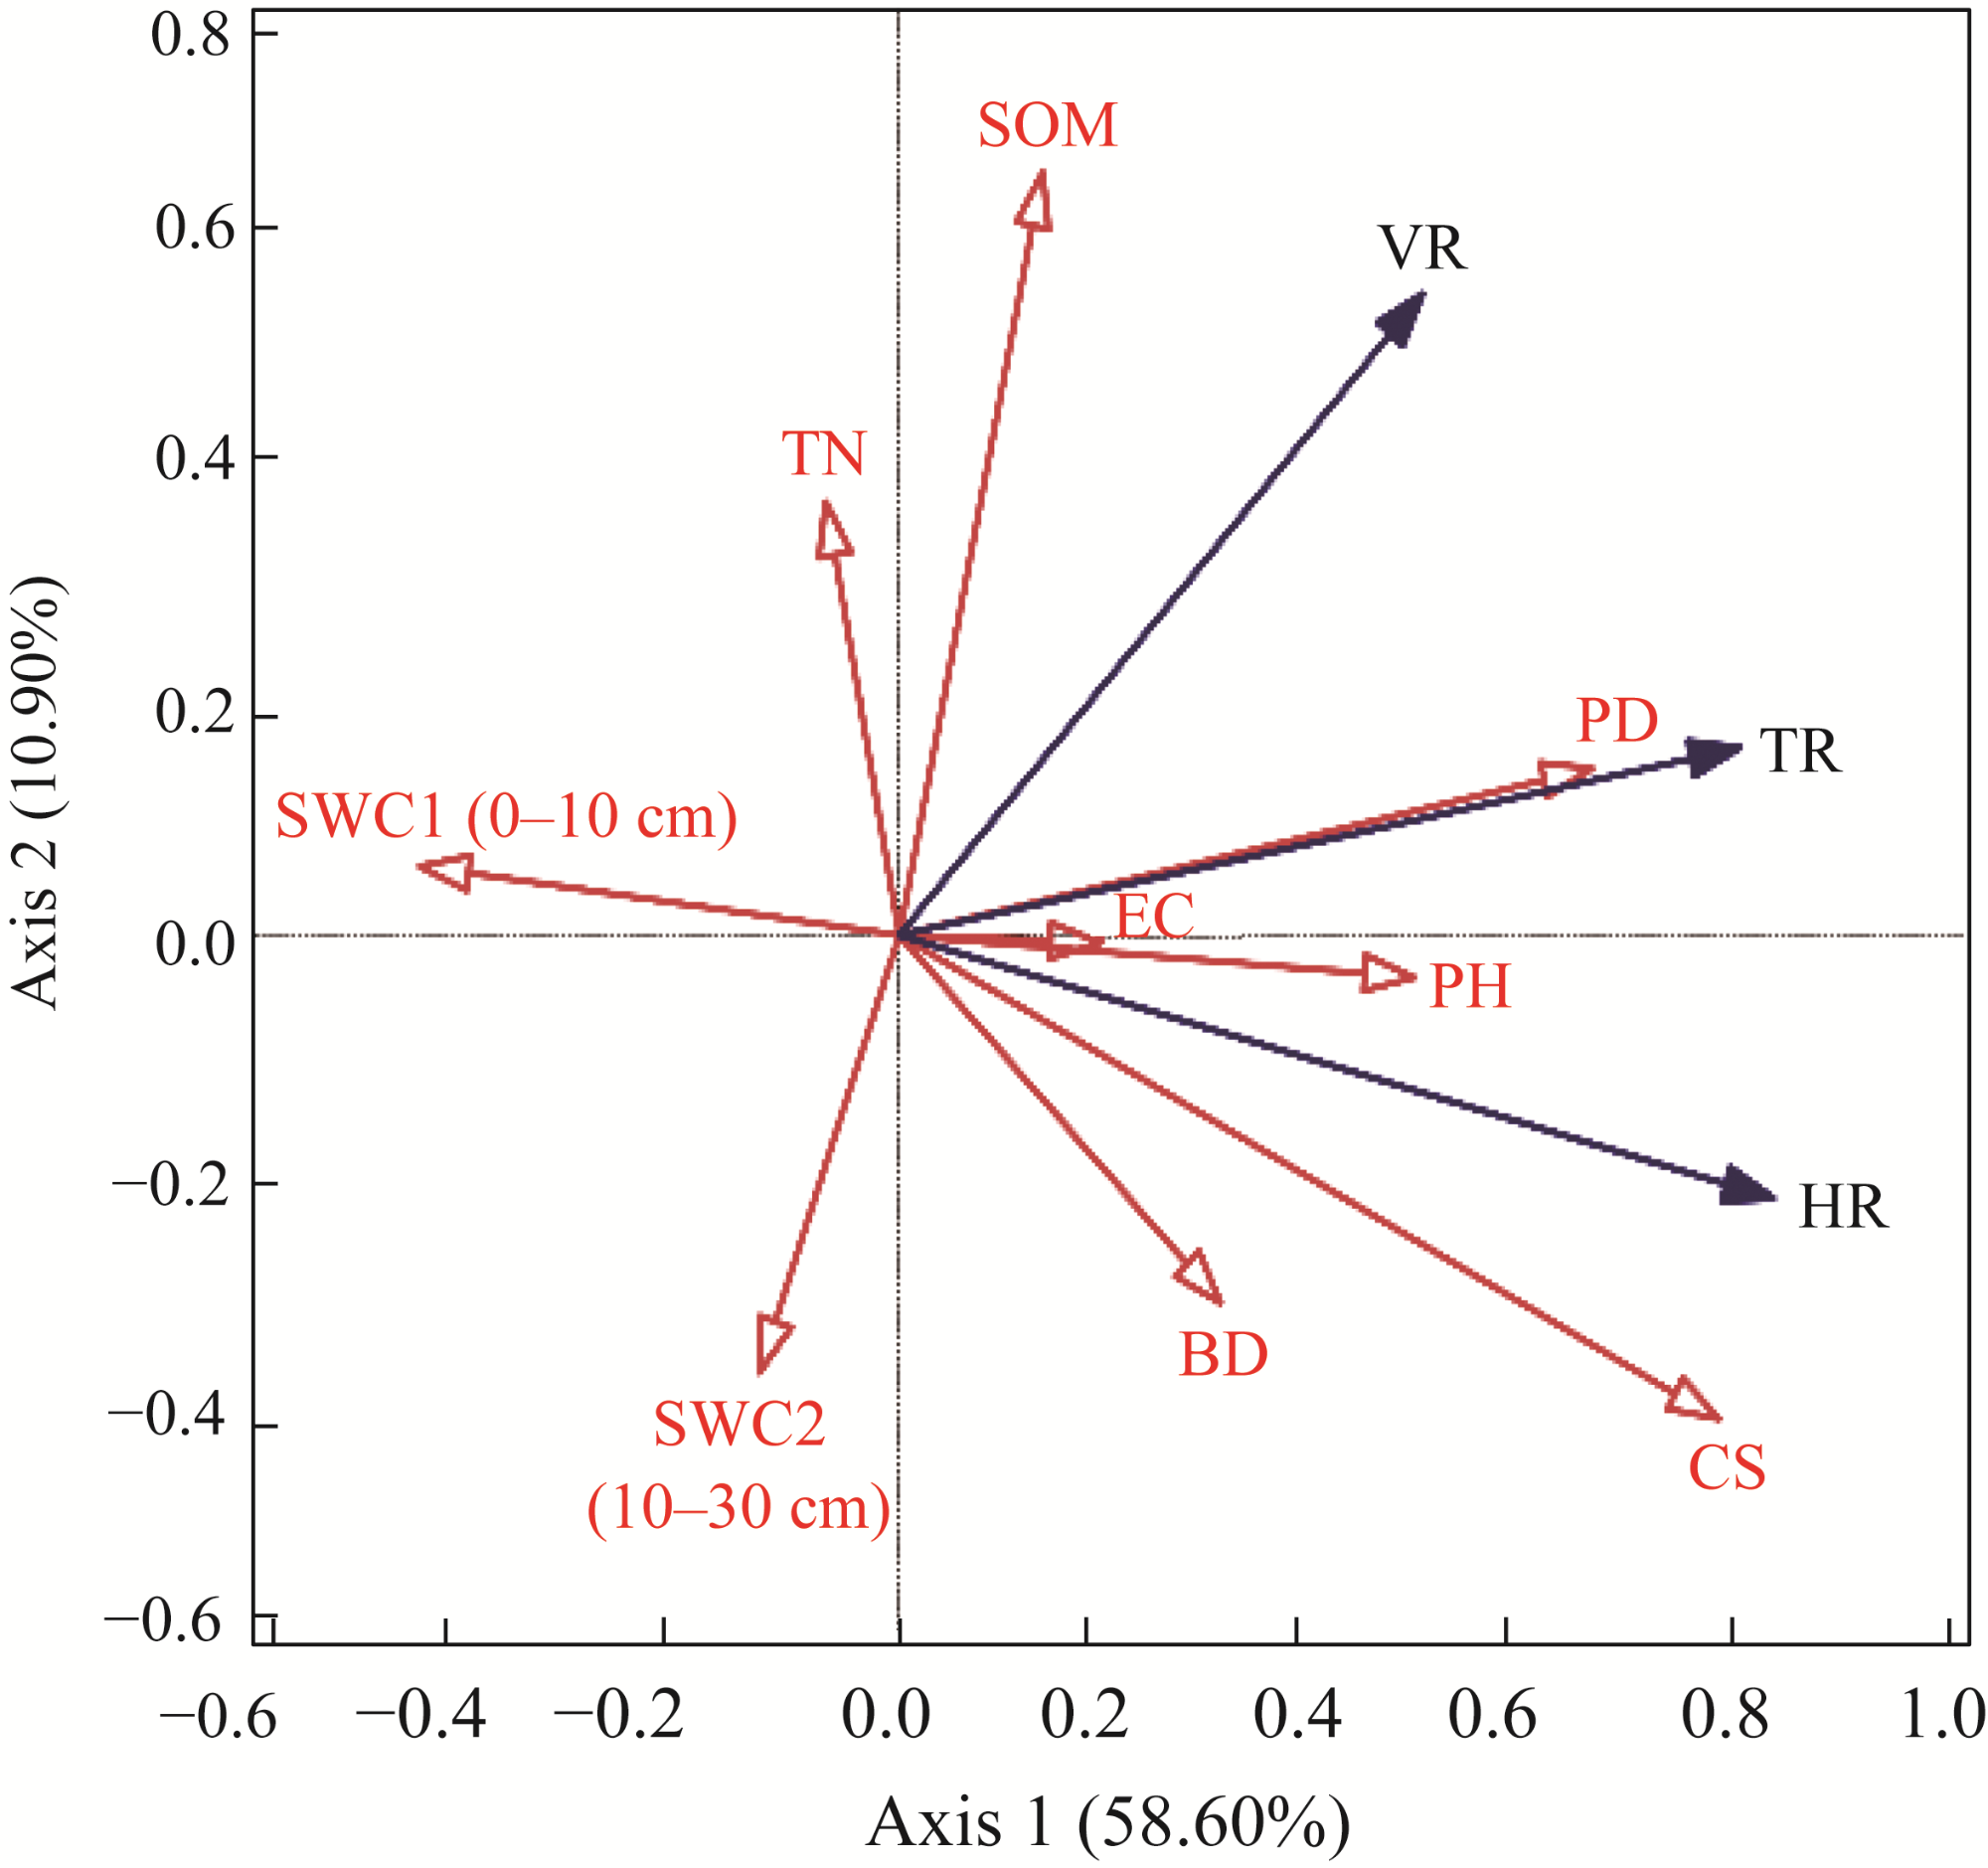
Belowground bud banks are essential for the regeneration of plant population in arid desert areas, and their response to environmental changes could reflect adaptive strategies of plants to desert habitats. However, the size and composition of belowground bud banks and their response to environmental factors in the desert steppe zone remain poorly understood, challenging desertification control efforts in arid desert areas. This study examined the density and vertical distribution of horizontal and vertical rhizome buds of a rhizomatous legume herb Sophora alopecuroides L., its population characteristics, and soil physical-chemical properties in three habitats (interdune lowland (IL), flat sandy land (FSL), and desert steppe (DS)) in a desert steppe zone, northern China. Our findings revealed that: (1) total and horizontal rhizome bud densities of S. alopecuroides differed significantly among the three habitats (P<0.05), with the largest total rhizome bud density (177 buds/m2) in IL and the smallest (63 buds/m2) in DS; (2) horizontal rhizome buds distributed in the deep soil layer were dominant in IL, while vertical rhizome buds in the top soil layer were predominant in DS; and (3) soil coarse sand, nutrient content, and population density were the primary factors affecting bud bank density of S. alopecuroides. Specifically, horizontal rhizome buds were dependent largely on soil coarse sand content, and vertical rhizome buds tended to be more related to soil organic matter content and population density. Our results indicated that horizontal rhizome buds were more important in IL with frequent aeolian disturbance, whereas vertical rhizome buds were more important in DS with abundant water and nutrient resources. The plastic responses and survival strategies of S. alopecuroides bud bank to different habitats provide valuable information for the effective implementation of desertification control measures and the management of desert steppe ecosystems.
ZHANG Dongmei , LUO Weicheng , KANG Jianjun , REN Heng , GAO Jinlong . Changes and determinants of belowground bud banks of a rhizomatous clonal plant Sophora alopecuroides L. in the desert steppe, northern China[J]. Journal of Arid Land, 2026 , 18(1) : 150 -166 . DOI: 10.1016/j.jaridl.2026.01.001
Fig. 1 Map of the study area with sampling sites and habitat types |
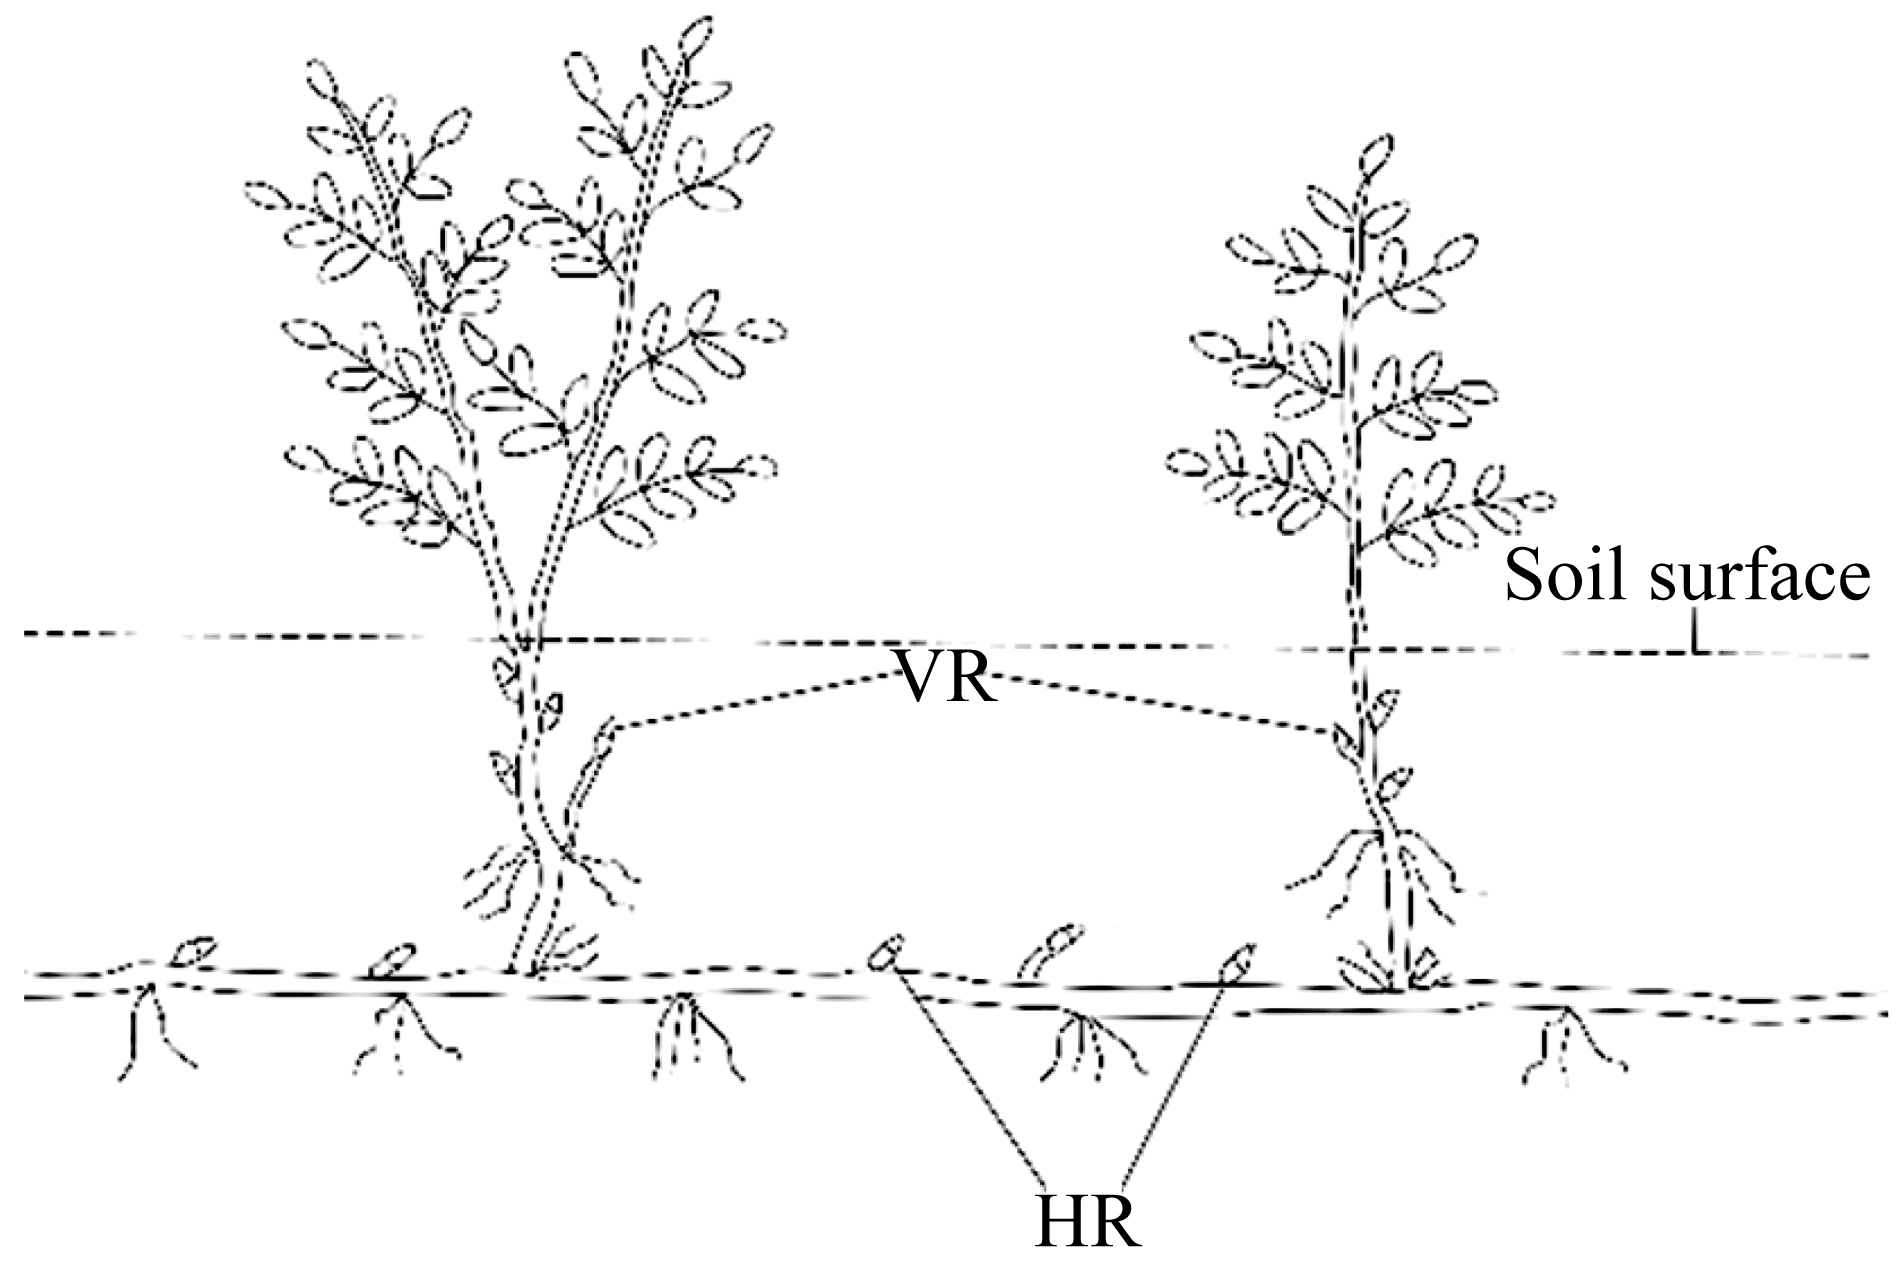
Fig. 2 Schematic representation of belowground rhizome bud in Sophora alopecuroides L. HR, horizontal rhizome bud; VR, vertical rhizome bud. |
Fig. 3 Bud densities of HR, VR, and total rhizome bud (TR) of S. alopecuroides at the population level. IL, interdune lowland; FSL, flat sandy land; DS, desert steppe. Different lowercase letters within the same type of rhizome bud indicate significant differences among the three habitats at P<0.05 level. Bars are standard errors. |
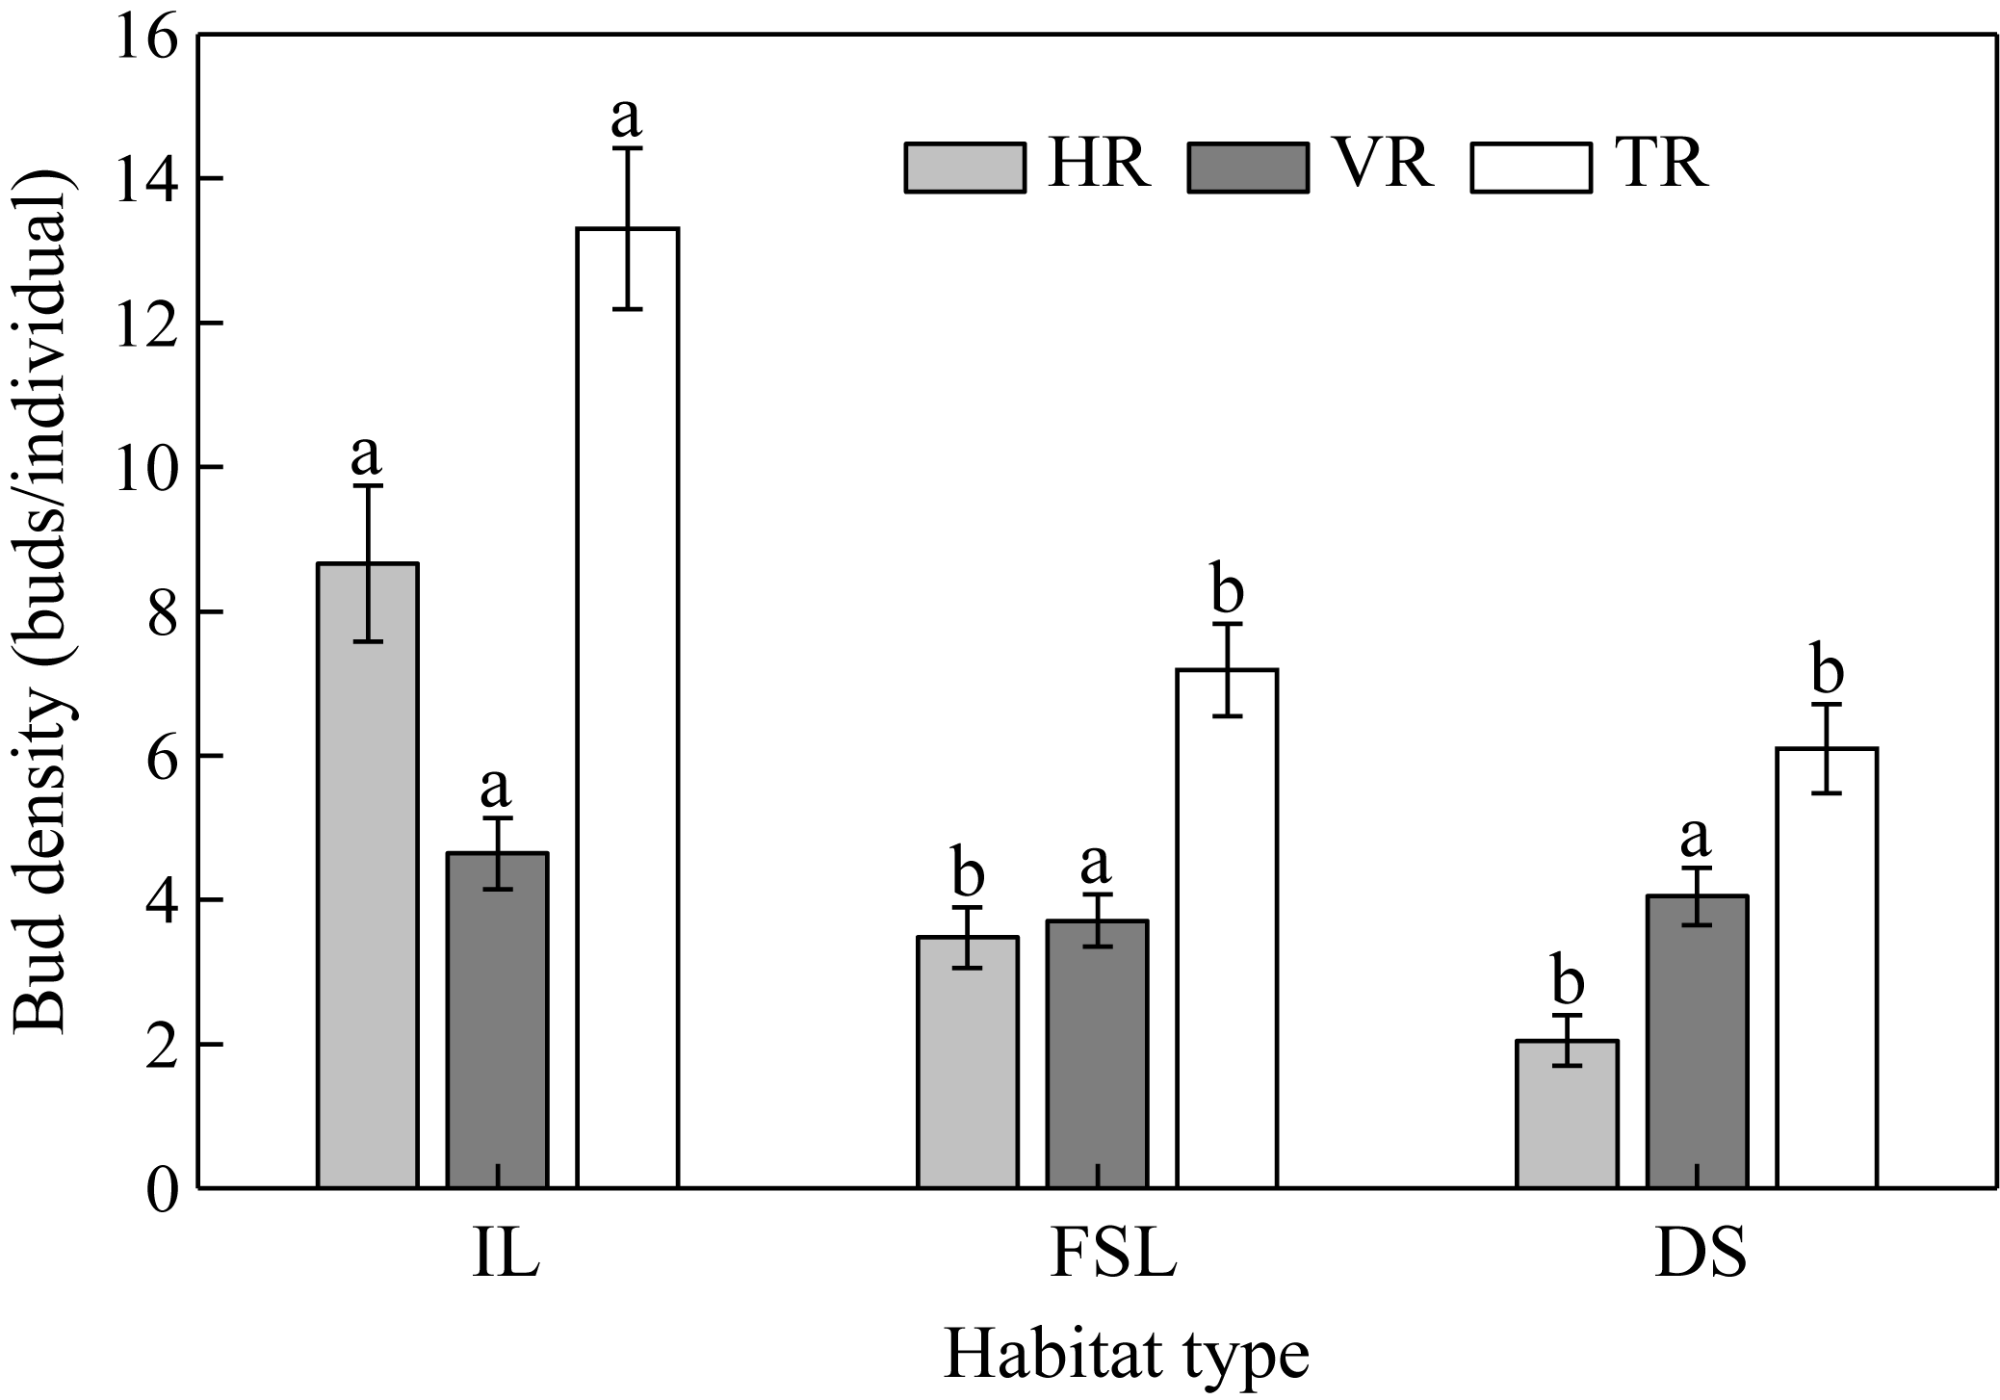
Fig. 4 Bud densities of HR, VR, and TR of S. alopecuroides at the individual level. Different lowercase letters within the same type of rhizome bud indicate significant differences among the three habitats at P<0.05 level. Bars are standard errors. |
Fig. 5 Proportions of HR and VR density in the three habitats |
Fig. 6 Bud densities of HR (a-c) and VR (d-f) in different soil depths in the three habitats. Bars are standard errors. |
Fig. 7 Proportions of TR density in different soil depths in the three habitats |
Table 1 One-way analysis of variation (ANOVA) of vegetation and soil properties in the three habitats |
| Environmental factor | Parameter | Habitat type | F | P | |||
|---|---|---|---|---|---|---|---|
| IL | FSL | DS | |||||
| Vegetation properties | PD (buds/m2) | 14±1.30a | 13±0.70ab | 11±0.90b | 2.592 | 0.084 | |
| PH (cm) | 37.12±1.72a | 32.24±0.91b | 30.42±1.43b | 3.733 | 0.030 | ||
| Soil properties | CS (%) | 36.74±3.44a | 19.69±1.94b | 12.59±1.07c | 17.414 | <0.001 | |
| BD (g/cm3) | 1.57±0.02a | 1.57±0.01a | 1.55±0.01a | 0.368 | 0.694 | ||
| SWC1 (0-10 cm) (%) | 3.30±0.43b | 3.74±0.22ab | 4.67±0.43a | 3.239 | 0.039 | ||
| SWC2 (10-30 cm) (%) | 6.27±1.00ab | 5.65±0.34b | 7.08±0.46a | 3.494 | 0.048 | ||
| EC (dS/m) | 0.25±0.03a | 0.10±0.00c | 0.15±0.02b | 15.057 | <0.001 | ||
| SOM (g/kg) | 2.59±0.25a | 2.31±0.12b | 2.68±0.06a | 6.091 | 0.037 | ||
| TN (g/kg) | 0.373±0.021a | 0.336±0.007b | 0.370±0.012a | 3.671 | 0.041 | ||
Note: PD, population density; PH, plant height; CS, coarse sand; BD, bulk density; SWC, soil water content; EC, electrical conductivity; SOM, soil organic matter; TN, total nitrogen; IL, interdune lowland; FSL, flat sandy land; DS, desert steppe. Different lowercase letters with the same row indicate significant differences among different habitat types at P<0.05 level. Mean±SE. The abbreviations are the same in the following figure and tables. |
Fig. 8 Redundancy analysis (RDA) for the relationship between bud densities of HR, VR, and TR of S. alopecuroides and environmental factors. The red arrows denote environmental variables, and the blue arrows denote bud types. |
Table 2 Explanatory power and contribution of environmental factors to the total variation in bud density of S. alopecuroides |
| Environmental factor | Parameter | Explanatory power (%) | Contribution (%) | F | P |
|---|---|---|---|---|---|
| Soil properties | CS | 38.20 | 54.90 | 14.900 | 0.002** |
| SOM | 9.10 | 13.10 | 4.700 | 0.028* | |
| EC | 6.10 | 8.70 | 3.500 | 0.060 | |
| SWC1 (0-10 cm) | 2.70 | 3.90 | 1.600 | 0.222 | |
| BD | 0.90 | 1.20 | 0.500 | 0.568 | |
| SWC2 (10-30 cm) | 0.50 | 0.70 | 0.300 | 0.750 | |
| TN | 0.30 | 0.40 | 0.200 | 0.808 | |
| Vegetation properties | PD | 10.10 | 14.40 | 4.500 | 0.032* |
| PH | 1.80 | 2.60 | 1.100 | 0.364 |
Note: *, P<0.05 level; **, P<0.01 level. |
Table 3 Explanatory power and contribution of environmental factors to the total variation in horizontal rhizome bud (HR), vertical rhizome bud (VR), and total rhizome bud (TR) densities of S. alopecuroides |
| Bud type | Environmental factor | Parameter | Explanatory power (%) | Contribution (%) | F | P |
|---|---|---|---|---|---|---|
| HR | Soil properties | CS | 57.20 | 75.40 | 32.000 | 0.002** |
| SWC2 | 4.70 | 6.20 | 3.300 | 0.086 | ||
| SOM | 3.50 | 4.70 | 2.700 | 0.108 | ||
| EC | 2.00 | 2.60 | 1.400 | 0.274 | ||
| SWC1 | 0.40 | 0.50 | 0.300 | 0.638 | ||
| BD | 0.20 | 0.30 | 0.200 | 0.676 | ||
| TN | 0.20 | 0.30 | 0.200 | 0.712 | ||
| Vegetation properties | PD | 6.10 | 8.00 | 3.800 | 0.066 | |
| PH | 1.60 | 2.00 | 1.000 | 0.358 | ||
| Total | 75.90 | 100.00 | ||||
| VR | Soil properties | SOM | 20.80 | 36.10 | 6.300 | 0.020* |
| SWC2 | 8.30 | 14.40 | 3.600 | 0.056 | ||
| BD | 5.90 | 10.30 | 2.700 | 0.096 | ||
| EC | 1.30 | 2.20 | 0.600 | 0.426 | ||
| CS | 1.10 | 2.00 | 0.500 | 0.542 | ||
| TN | 0.30 | 0.70 | 0.200 | 0.631 | ||
| SWC1 | 0.10 | 0.20 | <0.100 | 0.814 | ||
| Vegetation properties | PD | 19.70 | 34.10 | 7.600 | 0.016* | |
| PH | <0.10 | <0.10 | <0.100 | 1.000 | ||
| Total | 57.50 | 100.00 | ||||
| TR | Soil properties | CS | 33.00** | 48.50 | 11.800 | 0.004** |
| SOM | 11.50 | 16.90 | 6.000 | 0.026* | ||
| EC | 7.20 | 10.60 | 4.300 | 0.062 | ||
| SWC1 | 1.10 | 1.60 | 0.600 | 0.438 | ||
| BD | 0.30 | 0.50 | 0.200 | 0.678 | ||
| SWC2 | 0.10 | 0.20 | 0.100 | 0.728 | ||
| TN | <0.10 | 0.10 | <0.100 | 0.848 | ||
| Vegetation properties | PD | 13.20 | 19.30 | 5.600 | 0.030* | |
| PH | 1.60 | 2.30 | 0.900 | 0.334 | ||
| Total | 68.00 | 100.00 |
Note: *, P<0.05 level; **, P<0.01 level. |
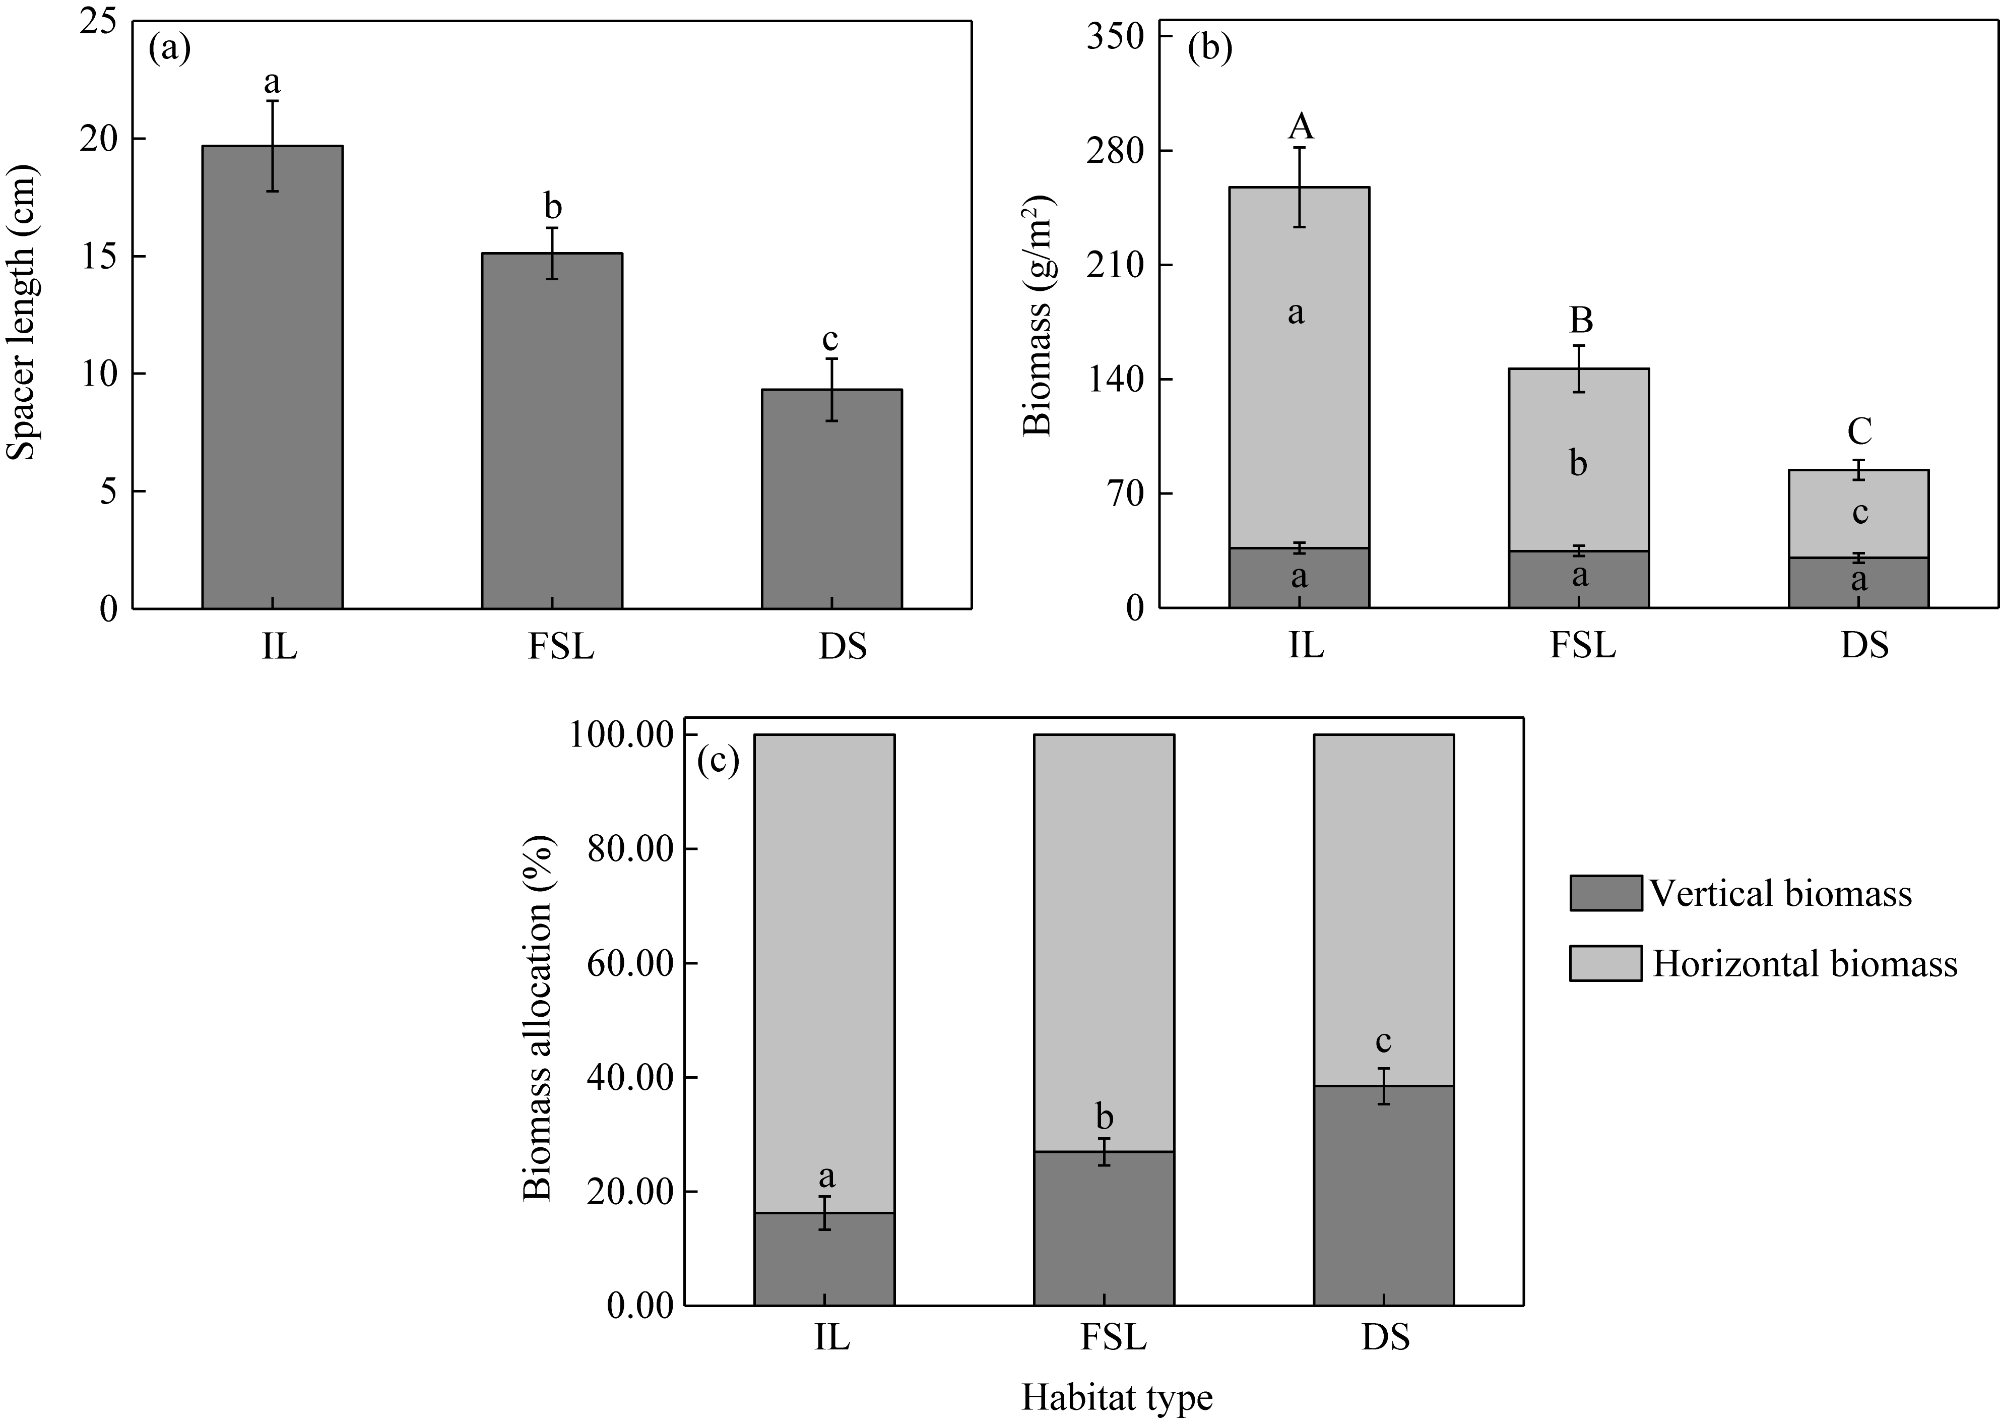
Fig. S1 Spacer length (a), biomass (b), and biomass allocation (c) for Sophora alopecuroides L. in the three habitats. IL, interdune lowland; FSL, flat sandy land; DS, desert steppe. Lowercase letters indicate significant differences in spacer length, horizontal and vertical biomass, and biomass allocation among the three habitats at P<0.05 level, while uppercase letters indicate significant differences in total biomass (horizontal biomass+vertical biomass) among the three habitats at P<0.05 level. Bars are standard errors. |
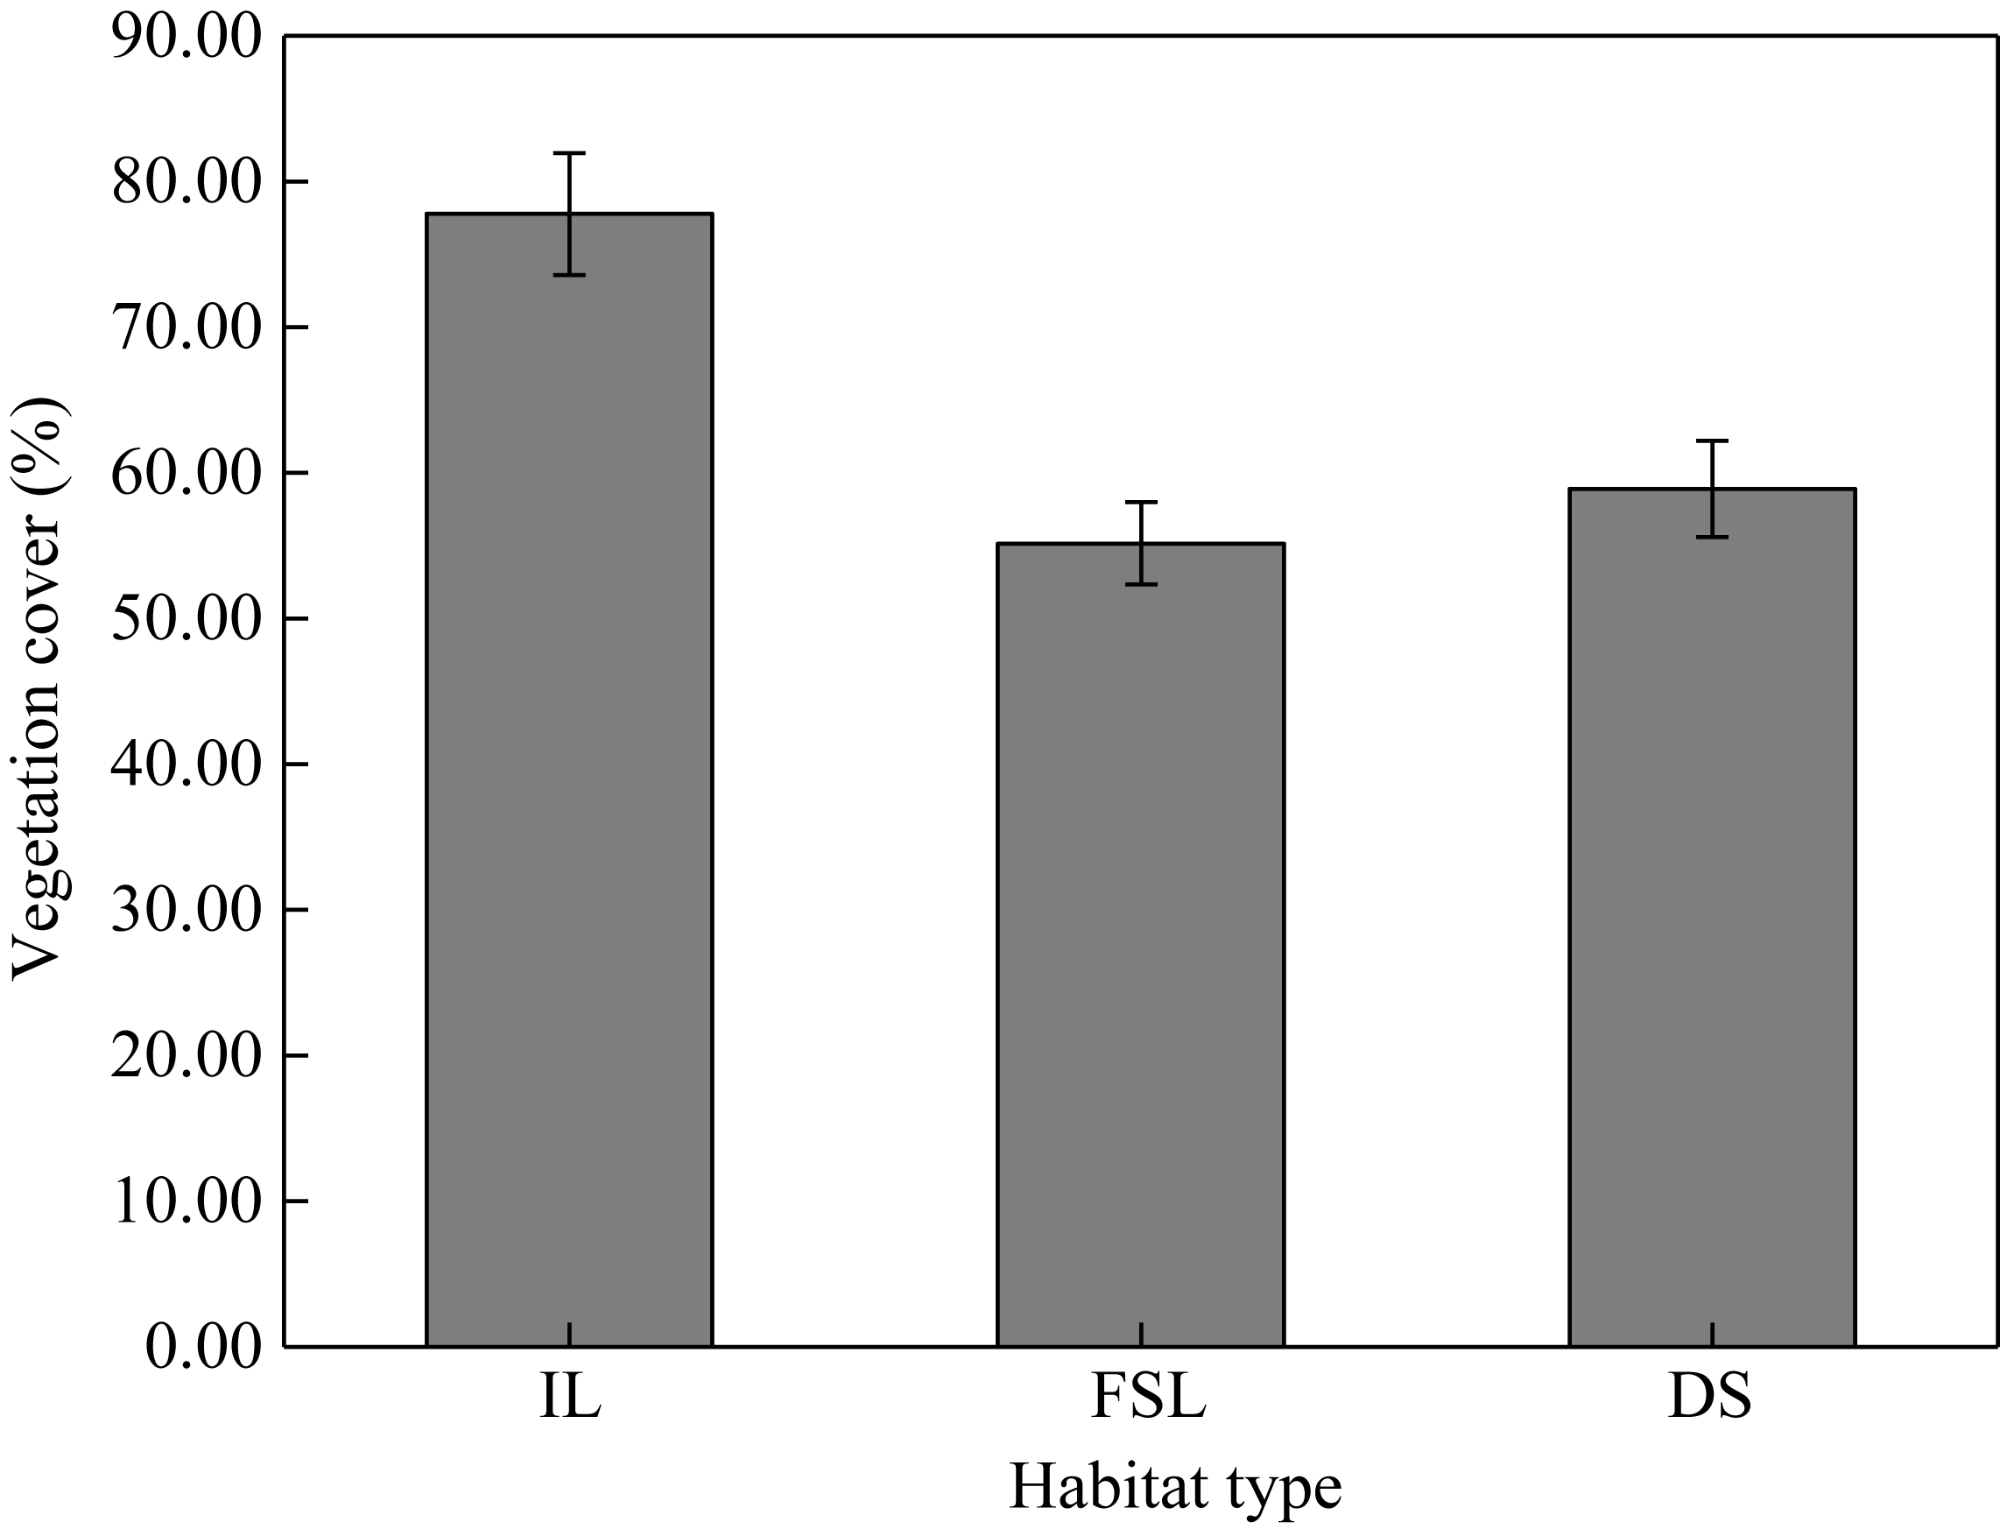
Fig. S2 Vegetation cover in the three habitats. Bars are standard errors. |
| [1] |
Alamusa,
|
| [2] |
|
| [3] |
|
| [4] |
|
| [5] |
|
| [6] |
|
| [7] |
|
| [8] |
|
| [9] |
|
| [10] |
|
| [11] |
|
| [12] |
|
| [13] |
|
| [14] |
|
| [15] |
|
| [16] |
|
| [17] |
|
| [18] |
|
| [19] |
|
| [20] |
|
| [21] |
|
| [22] |
|
| [23] |
|
| [24] |
|
| [25] |
|
| [26] |
|
| [27] |
|
| [28] |
|
| [29] |
|
| [30] |
|
| [31] |
|
| [32] |
|
| [33] |
|
| [34] |
|
| [35] |
|
| [36] |
|
| [37] |
|
| [38] |
|
| [39] |
|
| [40] |
|
| [41] |
|
| [42] |
|
| [43] |
|
| [44] |
|
| [45] |
|
| [46] |
|
| [47] |
|
| [48] |
|
| [49] |
|
| [50] |
|
| [51] |
|
| [52] |
|
| [53] |
|
| [54] |
|
| [55] |
|
| [56] |
|
| [57] |
|
| [58] |
|
| [59] |
|
| [60] |
|
| [61] |
|
| [62] |
|
| [63] |
|
| [64] |
|
| [65] |
|
| [66] |
|
| [67] |
|
| [68] |
|
| [69] |
|
| [70] |
|
| [71] |
|
| [72] |
|
| [73] |
|
/
| 〈 |
|
〉 |