Research article

Trade-offs and synergies between ecosystem services in Yutian County along the Keriya River Basin, Northwest China

  • ZUBAIDA Muyibul , *
Expand
  • College of Tourism, Xinjiang University, Urumqi 830049, China
* ZUBAIDA Muyibul (E-mail: )

Received date: 2024-01-30

  Revised date: 2024-05-27

  Accepted date: 2024-06-04

  Online published: 2025-08-14

Abstract

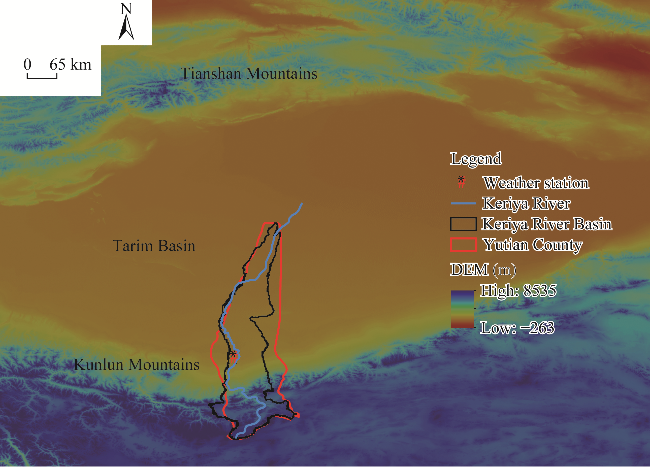
The Keriya River Basin is located in an extremely arid climate zone on the southern edge of the Tarim Basin of Northwest China, exhibiting typical mountain-oasis-desert distribution characteristics. In recent decades, climate change and human activities have exerted significant impacts on the service functions of watershed ecosystems. However, the trade-offs and synergies between ecosystem services (ESs) have not been thoroughly examined. This study aims to reveal the spatiotemporal changes in ESs within the Keriya River Basin from 1995 to 2020 as well as the trade-offs and synergies between ESs. Leveraging the Integrated Valuation of Ecosystem Services and Trade-offs (InVEST) and Revised Wind Erosion Equation (RWEQ) using land use/land cover (LULC), climate, vegetation, soil, and hydrological data, we quantified the spatiotemporal changes in the five principal ESs (carbon storage, water yield, food production, wind and sand prevention, and habitat quality) of the watershed from 1995 to 2020. Spearman correlation coefficients were used to analyze the trade-offs and synergies between ES pairs. The findings reveal that water yield, carbon storage, and habitat quality exhibited relatively high levels in the upstream, while food production and wind and sand prevention dominated the midstream and downstream, respectively. Furthermore, carbon storage, food production, wind and sand prevention, and habitat quality demonstrated an increase at the watershed scale while water yield exhibited a decline from 1995 to 2020. Specifically, carbon storage, wind and sand prevention, and habitat quality presented an upward trend in the upstream but downward trend in the midstream and downstream. Food production in the midstream showed a continuously increasing trend during the study period. Trade-off relationships were identified between water yield and wind and sand prevention, water yield and carbon storage, food production and water yield, and habitat quality and wind and sand prevention. Prominent temporal and spatial synergistic relationships were observed between different ESs, notably between carbon storage and habitat quality, carbon storage and food production, food production and wind and sand prevention, and food production and habitat quality. Water resources emerged as a decisive factor for the sustainable development of the basin, thus highlighting the intricate trade-offs and synergies between water yield and the other four services, particularly the relationship with food production, which warrants further attention. This research is of great significance for the protection and sustainable development of river basins in arid areas.

Cite this article

ZUBAIDA Muyibul . Trade-offs and synergies between ecosystem services in Yutian County along the Keriya River Basin, Northwest China[J]. Journal of Arid Land, 2024 , 16(7) : 943 -962 . DOI: 10.1007/s40333-024-0103-2

1 Introduction

Ecosystems provide various services to humans. Natural changes and human activities directly impact ecosystem services (ESs) and can affect other services by affecting one particular service. This relationship manifests differently across regions and scales (Li et al., 2021). The correlation between ESs presents as a synergistic and trade-off relationship (Bennett and Balvanera, 2007). Synergy refers to increases or decreases in the functions of other ESs related to changes in one ES (Bennett et al., 2009). For instance, planting trees and afforestation can improve the production of raw materials in an ecosystem and bolster functions such as climate regulation, air purification, and soil and water conservation. Trade-offs among ESs are analyzed from both temporal and spatial perspectives (Power, 2010; Raudsepp-Hearne et al., 2010). Temporal trade-offs refer to the long-term impact that the short-term utilization of a certain type of ES may have on other types of ES. Spatial trade-offs refer to the impact of preferences for a certain type of ES in a particular area on other types of ES in that area. For example, increasing fertilizer usage in agricultural production may boost grain yield while deteriorating water and soil quality, thereby diminishing the regulatory function of the ecosystem (Li et al., 2020). Excessive pursuit of economic benefits in rural tourism development might amplify the supply capacity of cultural services in the ecosystem while reducing agricultural production function and negatively affecting ecosystem regulation and support functions (Li et al., 2020). Many researchers have focused on the synergy and trade-off relationships between ESs. Examples include the coordination and trade-off relationships of marine ESs (Pellowe et al., 2023) and the impact of crucial ecological restoration projects on the coordination and trade-off relationships of ESs (Chen et al., 2022b; Zhao et al., 2023). Scholars have also simulated the synergy and trade-off relationships of ESs based on future land use change scenarios through different frameworks (Liu et al., 2023) and explored the trade-off relationship between oasis agricultural production and other ESs (Li et al., 2020). The coordination and trade-off relationships between ESs exhibit distinct characteristics in various areas and at different scales.
Owing to the limitations in natural conditions, arid fragile ecological environment, continuous increases in population, and rapid socioeconomic development, the inland river basins in Northwest China have witnessed an escalating intensity of natural resource utilization. In recent decades, a series of ecological and environmental issues have emerged in major watersheds in northwestern area under the influence of climate change and human activity (Tengberg et al., 2016; Zubaida et al., 2018; Ling et al., 2019; Muhtar et al., 2021). Climate change and human interference diminish ecosystem service functionality while exacerbating the contradiction between ecological protection and economic development, resulting in complex trade-offs and synergies between ESs and economic development. Ultimately, this intricate trade-off and synergetic relationship adversely affects natural and social systems (Sanon et al., 2012; Butler et al., 2013; Zheng et al., 2014; Nagendra et al., 2015).
Large inland river basins present distinct characteristics in arid areas, with the upstream area serving as a water-producing area, the midstream area functioning as the primary grain production area, and the downstream area hosting natural oases that protect against winds and fix sand throughout the basin. Changes in one certain ES within a watershed may influence other ESs. For instance, a decrease in the upstream water conservation function affects the water supply function in the upstream area, grain production function in the midstream, and wind and sand fixation function in the downstream. Alterations in the agricultural production structure and development mode in the midstream might affect the food production of the watershed ecosystem and the habitat quality, wind and sand prevention, carbon sequestration, and other services of the entire watershed. Overgrazing in mountainous areas may lead to grassland desertification, reducing the carbon storage and the biodiversity of watershed ecosystems. Many scholars have studied the changes in ESs of arid inland rivers in Northwest China, such as the Shiyang River (Wang et al., 2019; Zhou et al., 2020), Shule River (Pan et al., 2021; Yue et al., 2022), Heihe River (Wang et al., 2022a; Zhao et al., 2022), Tarim River (Maimaiti et al., 2021; Kulaixi et al., 2023), Manas River (Ling et al., 2019; Xu et al., 2019), and Sangong River (Chen et al., 2022a). However, limited research has focused on the trade-off and synergistic relationships between ESs in these areas. Understanding the trade-off and synergistic relationships among various ESs and adopting scientific management measures on this basis are effective methods of maintaining the balance of arid basin ecosystems and achieving sustainable development.
The Tarim Basin is located within the southern Tianshan Mountains of Xinjiang Uygur Autonomous Region in the arid Northwest China and is a fragile ecological zone and a crucial grain production area (Wu et al., 2022). Situated at the southern periphery of the Tarim Basin, the Keriya River Basin originates from the Kunlun Mountains, meanders through Yutian County, and ultimately dissipates upon reaching the Taklimakan Desert. This basin epitomizes the mountain-oasis-desert ecosystem. Previous investigations have demonstrated significant alterations in land use/land cover (LULC) and landscape patterns within the Keriya River Basin due to the dual influences of natural phenomena and human interventions (Zubaida et al., 2018). Human activities have disrupted the equilibrium of water resource utilization in this watershed, resulting in expanded arable land in the midstream, heightened agricultural water consumption, diminished vegetation water uptake, degradation of grasslands, and increased area of desert (Muhtar et al., 2021). Currently, numerous studies have focused on land use, water resources, soil, and vegetation in the Keriya River Basin, predominantly analyzing the agricultural oasis situated in the midstream of the river or the downstream Daliyaboyi Oasis. However, limited research has investigated the interplay among mountainous areas, agricultural oases, and the downstream Daliyaboyi Oasis traversed by the Keriya River.
Geographical components distributed across the upper, middle, and lower reaches of the Keriya River in Yutian County collectively form a quintessential arid basin ecosystem. The upstream mountainous zones serve as the primary water source, the midstream represents the principal water consumption areas, and the downstream Daliyaboyi Oasis holds substantial natural and cultural significance. The survival of Daliyaboyi Oasis predominantly hinges upon the utilization of water and soil resources from the upstream and midstream. Driven by climate fluctuations and anthropogenic activities, the socio-ecological system within the watershed has witnessed intricate material cycles and energy fluxes. Assessing trade-off and synergy relationships among ecosystem components can illuminate the intricate dynamics within the system. The Keriya River is the second largest river in the Tarim Basin; thus, studying the evolving characteristics of ESs and associated trade-off and coordination mechanisms holds paramount importance for safeguarding the ecological integrity of the Keriya River Basin and enhancing human well-being. Furthermore, the findings of this study can offer valuable insights for similar research endeavors in other arid areas. To capture detailed spatiotemporal dynamics of ESs in Yutian County along the Keriya River from 1995 to 2020 and elucidate the trade-offs and synergies among various ESs at varying scales (Zhou et al., 2020; Yue et al., 2022; Kulaixi et al., 2023), we selected five key services: food production, water yield, wind and sand prevention, carbon storage, and habitat quality. By drawing upon prior research endeavors and current conditions in the study area, we aim to provide a scientific foundation for the careful delineation of regional land use, efficient management of river basins, and realization of sustainable development goals.

2 Study area and data sources

2.1 Study area

The Keriya River Basin falls under the administrative jurisdiction of Yutian County, Hotan Prefecture, Xinjiang Uygur Autonomous Region, China (35°14′-39°29′N, 81°09′-82°51′E). In 2020, the gross domestic product (GDP) of Yutian County reached 4.062×10⁹ CNY, with primary, secondary, and tertiary industries valued at 1.014×10⁹, 5.740×10⁸, and 2.474×10⁹ CNY, respectively. In 2020, the total population was 2.9×10⁵, primarily concentrated in the plain areas of the river basin. Yutian County is the only county through which the Keriya River flows. According to the watershed division map, the Keriya River Basin covers most areas of Yutian County; therefore, many studies, including this study, equate the Keriya River Basin to Yutian County. The Keriya River is the second largest river on the southern fringe of the Tarim Basin. Originating from the northern slope of the Kunlun Mountains, it terminates at the Daliyaboyi Oasis in the Taklimakan Desert (Fig. 1). The river extends approximately 466 km from north to south and is about 30-120 km wide from east to west. Based on its natural features, the Keriya River Basin is conventionally delineated into upstream, midstream, and downstream sections, with the southern portion of Pulu Village constituting the upstream, the section from Pulu Village to the center of Yutian County categorized as midstream, and the northern section of Yutian County designated as downstream (Ni, 1993; Wang et al., 2022b; Zhang et al., 2023). The upstream area encompasses the northern Kunlun Mountains and is characterized by snow and glaciers, serving as the primary water source. The midstream constitutes the principal residential and agricultural production base, while the downstream hosts the Daliyaboyi Oasis. Terrain-wise, the Keriya River Basin exhibits a gradient from high to low, with prominent vertical zoning. The relative elevation differential exceeds 5000 m, and both eastern and western flanks are enveloped by gravel Gobi sediment with minimal horizontal differences. The climate within the Keriya River Basin is profoundly influenced by topography and landforms and presents marked north-south distinctions. The upper reaches experience a semi-humid climate, the midstream presents warm and arid climate conditions, and the lower reaches experience extremely arid climate. Meteorological data from the Yutian Meteorological Observatory (1960-2020) indicate an average temperature of 11.6°C in the Keriya River Basin, with peaking in the downstream and diminishing in the upstream. Annual average precipitation is approximately 51.5 mm, and annual average evaporation is approximately 2325.3 mm. Ice and snow meltwater serve as the primary water source for the Keriya River, while groundwater and precipitation collectively contribute approximately 30.0% of the total water supply. Runoff distribution throughout the year exhibits pronounced seasonality, typified by spring and summer floods, autumn stagnation, and winter aridity.
Fig. 1 Location of the Keriya River Basin. DEM, digital elevation model.

2.2 Data sources

The data used in this study include LULC, meteorological data (including wind speed, precipitation, temperature, and potential evapotranspiration), snow cover, digital elevation model (DEM), soil data (including the content of sand, silt, and clay, and the contents of CaCO3 and organic carbon), and normalized difference vegetation index (NDVI). The LULC data in this study were reclassified into ten categories: cultivated land, forest, high-coverage grassland, medium-coverage grassland, low-coverage grassland, waterbody, ice and snow land, construction land, rural residential land, and unused land (Zubaida et al., 2018). The utilized meteorological data during 1995-2000 were collected from eight meteorological stations (Yutian, Gaize, Shaya, Minfeng, Qiemo, Alar, Hotan, and Shiquanhe) surrounding the Keriya River. Spatial interpolation of wind speed data from meteorological stations was performed using the inverse distance interpolation method in ArcGIS 10.4 (Environmental Systems Research Institute (ESRI), Inc., RedLands, California, USA) to generate a grid layer. Information on the data sources is shown in Table 1.
Table 1 Data source of parameters for the calculation of ecosystem services (ESs) in the Keriya River Basin
Parameter Spatial resolution Data source Year
Land use/land cover (LULC) 100 m Data Center for Resource and Environmental Science, Chinese Academy of Sciences (http://www.resdc.cn) 1995, 2000, 2005, 2010, 2015, and 2020
Wind speed China Meteorological Data Network (http://data.cma.cn/) 1995-2020
Temperature China Meteorological Data Network (http://data.cma.cn/) 1995-2020
Evapotranspiration China Meteorological Data Network (http://data.cma.cn/) 1995-2020
Precipitation 5 km Google Earth Engine (GEE) platform and Climate Hazards Group InfraRed Precipitaion with Station (CHIRPS) dataset (https://earthengine.google.com/) 1995-2020
Runoff Yutian hydrologic station 1995-2020
Potential evapotranspiration 1 km National Earth System Science Data Center (http://www.geodata.cn/) 1995-2020
Snow cover 1 km GEE platform and Moderate Resolution Imaging Spectroradiometer (MODIS) Snow Cover Product Dataset (https://earthengine.google.com/) 2000-2020
Digital elevation model (DEM) 30 m Geospatial Data Cloud Network (http://www.gsclo
ud.cn/)
Soil 1 km Harmonized World Soil Database (HWSD) (http://
www.fao.org/home/en/)
Normalized difference vegetation index (NDVI) 30 m GEE platform (https://earthengine.google.com/) 1995-2020

3 Methods

3.1 Quantitative methods for ESs

3.1.1 Carbon storage

The Integrated Valuation of Ecosystem Services and Trade-offs (InVEST) model divides the carbon storage of watershed ecosystems into four basic carbon pools: aboveground, underground, soil, and dead organic carbon pools. The aboveground carbon pool primarily encompasses the carbon stored in living plants at the surface, while the underground carbon pool comprises carbon within underground plant roots. The soil carbon pool denotes organic carbon presenting in the soil, whereas the dead organic carbon pool encompasses organic carbon within deceased vegetation and debris (Zhu et al., 2021). Due to challenges in obtaining data on dead organic carbon and its relatively minor impact on overall carbon storage, this study excluded dead organic carbon pools. Finally, the carbon density table was combined with LULC to calculate the carbon storage of the watershed ecosystem. The formulas are as follows:
${{\text{C}}_{i}}={{C}_{i-\text{aboveground}}}+{{\text{C}}_{i-\text{underground}}}+{{C}_{i\text{-soil}}}+{{C}_{i\text{-dead }}}$,
${{\text{C}}_{\text{sum}}}=\sum\limits_{i=1}^{m}{{{A}_{i}}\times }{{C}_{i}}$,
where Ci is the total carbon density of land use type i (t C/hm2); Ci-aboveground is the aboveground carbon density of land use type i (t C/hm2); Ci-underground is the underground carbon density of land use type i (t C/hm2); Ci-soil is the soil carbon density of land use type i (t C/hm2); Ci-dead is the organic matter carbon density of land use type i (t C/hm2); Csum is the total carbon storage of the whole study area (t C); m is the number of land use type; and Ai is the area of land use type i (hm2).
Before using the InVEST model, the selected carbon density values were corrected. This study prioritized the locally measured data and then obtained carbon density of different land use types by referencing previous research (Xu and Zhang, 2018; Guo, 2021; Liu et al., 2021b; Han et al., 2022) (Table 2).
Table 2 Carbon density of different land use types in the Keriya River Basin
LULC Carbon density (t C/hm²)
Aboveground Underground Soil
Cultivated land 3.29 17.92 50.58
Forest land 17.05 21.48 67.19
High-coverage grassland 10.26 25.13 65.80
Medium-coverage grassland 8.25 22.68 49.95
Low-coverage grassland 8.10 15.58 24.98
Water body 0.04 0.00 0.00
Ice and snow land 0.00 0.00 0.00
Construction land 0.73 7.99 8.64
Rural residential land 0.80 8.15 12.50
Unused land 0.05 0.05 6.28

3.1.2 Water yield

The InVEST water yield module is based on the principle of water balance, which subtracts the actual evapotranspiration per unit grid from the precipitation per unit grid to obtain the water yield of an area (Wei et al., 2022). The formulas are as follows:
${{Y}_{xi}}=(1-\frac{\text{AE}{{\text{T}}_{x}}}{{{P}_{x}}})\times {{P}_{x}}$,
$\frac{\text{AE}{{\text{T}}_{x}}}{{{P}_{x}}}=\frac{1+{{\omega }_{x}}{{R}_{xi}}}{1+{{\omega }_{x}}{{R}_{xi}}+\frac{1}{{{R}_{xi}}}}$,
${{\omega }_{x}}=Z\times \frac{\text{AW}{{\text{C}}_{x}}}{{{P}_{x}}}$,
${{R}_{xi}}=\frac{({{K}_{xi}}\times \text{E}{{\text{T}}_{0x}})}{{{P}_{x}}}$,
where Yxi is the annual water yield of the land use type i in the grid x (m3); AETx is the annual actual evapotranspiration of grid x (mm); Px is the annual precipitation of grid x (mm); Rxi is the Budyko aridity index of land use type i in the gird x; ωx is an improved and nondimensional plant available water and annual expected precipitation, representing soil properties under natural climatic conditions; Z is the Zhang coefficient, determined through adjacent areas and adjusted multiple times to 1; AWCx is the plant water content of grid x (mm); Kxi is the vegetation evapotranspiration coefficient of land use type i in the grid x; and ET0x is the potential evapotranspiration in grid x.
Executing the water yield module in InVEST model necessitates annual potential evapotranspiration, annual precipitation, LULC, vegetation availability, root depth, vector boundaries, and biophysical coefficient tables. Annual potential evapotranspiration data were derived using the modified Hargreaves formula (Peng et al., 2017), which was computed by water data from the Available Water Capacity model. Other coefficients in the biophysical coefficient table were assigned values derived from studies in neighboring areas (Guo, 2021), InVEST model reference guidelines (Sharp et al., 2014), and reference values from the Food and Agriculture Organization of the United Nations (FAO) (Table 3).
Table 3 Biophysical parameters of water yield service
LULC LULC_veg Root depth (mm) KC
Cultivated land 1 700 0.8
Forest land 1 3000 0.8
High-coverage grassland 1 250 0.7
Medium-coverage grassland 1 1000 0.7
Low-coverage grassland 1 700 0.7
Water body 1 1000 1.0
Ice and snow land 1 10 0.4
Construction land 0 500 0.3
Rural residential land 0 500 0.4
Unused land 0 10 0.5

Note: LULC_veg is the code of different use types in the water yield module in the Integrated Valuation of Ecosystem Services and Trade-offs (InVEST) model, and Kc is the vegetation evapotranspiration coefficient of each land use type.

3.1.3 Food production

The growth status of food crops is closely related to the degree of vegetation coverage; therefore, NDVI values can be used to evaluate the growth status and yield of food crops (Cui et al., 2019; Du et al., 2023). In this study, we allocated grain to each grid based on the proportion of vegetation condition indices of cultivated land, forest land, and grassland in the entire study area, and calculated the grain supply based on NDVI (Kuri et al., 2014).
$\text{G}{{\text{P}}_{x}}=\text{G}{{\text{P}}_{t}}\times \frac{\text{NDV}{{\text{I}}_{x}}}{\sum\nolimits_{x=1}^{n}{\text{NDV}{{\text{I}}_{\text{sum}}}}}$,
where GPx is the grain supply of grid x (t); GPt is the total grain yield of the study area (t); NDVIx is the NDVI value of grid x; NDVIsum is the sum of the NDVI values of cultivated land, forest land, and grassland in the watershed; and n is the grid number.

3.1.4 Wind and sand prevention

This study used the Revised Wind Erosion Equation (RWEQ) model to calculate the value of wind and sand prevention service of the watershed (Li et al., 2023). This model calculates the difference between the potential and actual wind erosion amounts for wind prevention and sand fixation. Potential wind erosion refers to the amount of soil wind erosion under bare-soil conditions. In contrast, actual wind erosion refers to the amount of soil wind erosion under vegetation-covered conditions. The formulas are as follows (Li et al., 2023):
$G={{S}_{\text{LQ}}}{{S}_{L}}$,
${{Q}_{\max \_Q}}=109.8\times \text{WF}\times \text{EF}\times K\times \text{SCF}$,
${{Q}_{\max }}=109.8\times \text{WF}\times \text{EF}\times K\times \text{SCF}\times C$,
${{S}_{Q}}=150.71\times {{(\text{WF}\times \text{EF}\times K\times \text{SCF})}^{-0.3711}}$,
$S=150.71\times {{(\text{WF}\times \text{EF}\times K\times \text{SCF}\times C)}^{-0.3711}}$,
${{S}_{\text{LQ}}}=\frac{2z}{{{S}_{Q}}^{2}}{{Q}_{\max \_Q}}\times {{e}^{-{{(\frac{z}{{{S}_{Q}}})}^{2}}}}$,
${{S}_{L}}=\frac{2z}{{{S}_{Q}}^{2}}{{Q}_{\max }}\times {{e}^{-{{(\frac{z}{S})}^{2}}}}$,
where G is the amount of wind and sand fixation per unit area (kg/m2); SLQ and SL are the potential wind erosion and actual soil erosion under vegetation cover, respectively (kg/m2); Qmax_Q and Qmax are the potential wind transport capacity and the maximum wind transport capacity, respectively (kg/m); SQ and S are the length of the potential critical plots and the critical plots, respectively (m); WF is the weather factor (kg/m); EF is the soil erodibility factor; K is the surface roughness factor; SCF is the soil crust factor; C is the vegetation cover factor; z is the downwind distance (m), which is 50 m in this study; and e is the natural constant (Liu et al., 2021a).

3.1.5 Habitat quality

The habitat quality of the Keriya River Basin was calculated using the habitat quality module in InVEST model (Eq. 15). The model assumes that areas with a higher habitat quality can maintain higher species richness, whereas areas with a lower habitat quality cannot (Terrado et al., 2016). This module integrates four variables: the relative impact of different threat factors, the sensitivity and threat intensity of different land use types to threat factors, the distance between different land use types and threat sources, and the degree of legal protection of land.
${{Q}_{xi}}={{H}_{i}}\times \left[ 1(\frac{D_{xi}^{b}}{D_{xi}^{b}+{{k}^{b}}}) \right]$,
where Qxi is the habitat quality value of land use type i in grid x; Hi is the habitat suitability of land use type i; Dxi is the degree of habitat degradation of land use type i in grid x; k is the semi-saturation coefficient; and b is the inherent conversion coefficient of the system with a value of 0.5. The habitat quality value ranges between 0 and 1.
${{D}_{xi}}=\sum\nolimits_{u=1}^{R}{\sum\nolimits_{y=1}^{Y}{\left( \frac{wu}{\sum\nolimits_{u=1}^{R}{{{w}_{u}}}} \right)\times }}{{u}_{y}}\times {{i}_{uxy}}\times {{\beta }_{x}}\times {{S}_{iu}}$,
where wu is the weight of different threat factors; uy is the threat factor value of grid y; iuxy is the impact distance between habitats and threat sources in space; βx is the anti-interference level of the habitat (i.e., the degree of legal protection); Siu is the relative sensitivity of different habitats to different threat factors; R is the number of habitat threat factor; and Y is the total number of grids of threat factor u.
The data input into the model included LULC, main threat factors, threat factor weights, image distances, and sensitivity of LULC to each threat source. The InVEST model user guide manual was used as a reference (Sharp et al., 2014), and adjacent area research results were used to set the relevant parameters (Gong et al., 2019; Liu and Xu, 2020; Han, 2022; Hu et al., 2022) (Table 4).
Table 4 Habitat quality parameters of different land use types in the Keriya River Basin
LULC Habitat suitability index Sensitivity of threat factor
Cultivated land Construction land Rural residential land Unused land
Cultivated land 0.40 0.30 0.50 0.50 0.60
Forest land 1.00 0.30 1.00 0.90 0.20
High-density grassland 0.80 0.60 0.70 0.55 0.60
Mid-density grassland 0.75 0.65 0.75 0.60 0.65
Low-density grassland 0.70 0.70 0.80 0.65 0.70
Water body 0.10 0.70 0.90 0.75 0.70
Ice and snow land 0.10 0.40 0.30 0.30 0.80
Construction land 0.00 0.00 0.00 0.00 0.00
Rural residential land 0.00 0.00 0.00 0.00 0.00
Unused land 0.00 0.00 0.00 0.00 0.00

3.2 Trade-off and synergy analysis

As the Spearman coefficient remains unaffected by outliers, does not necessitate continuous variables, and accurately reflects nonlinear relationships between variables (Crawford, 2006; Kara et al., 2023; Li and Luo, 2023), Spearman correlation coefficients were employed to calculate the trade-off and synergistic relationships in this study. Correlation analysis was conducted using R software (JJ Allaire, Bosten, Massachusetts, USA). We determined the trade-offs and synergies between ESs based on the positive or negative correlation coefficients. When the partial correlation coefficient is positive, it is considered a synergistic relationship between ES pairs; when the partial correlation coefficient is negative, it is considered a trade-off relationship between ES pairs. Additionally, the significance of these trade-offs and synergies were assessed using t-test. The formulas of correlation analysis and t test are as follows (Crawford, 2006; Zhu et al., 2020).
$r=\frac{\sum{(a-\overline{a})(b-\overline{b})}}{\sqrt{\sum{{{(a-\overline{a})}^{2}}}\sum{{{(b-\overline{b})}^{2}}}}}$,
$t=\frac{r}{\sqrt{\frac{1{{r}^{2}}}{c2}}}$,
where r is the partial correlation coefficient; a and b represent each observation value in the two variables, respectively; $\overline{a}$ and $\overline{b}$ are the average value of two variables, respectively; c is the number of sample observations; and t is the t-test value.
The strength of correlation is determined by the index r, and the significance is determined by the P value. Based on Wang et al., (2019) and Zhu et al. (2022), they divided the degree of tradeoffs and synergies into six levels: high significant synergy (r>0.00, P≤0.01), significant synergy (r>0.00, 0.01<P≤0.05), synergy (r>0.00, 0.05<P<0.10), high significant trade-off (r<0.00, P≤0.01), significant trade-off (r<0.00, 0.01<P≤0.05), and trade-off (r<0.00, 0.05<P<0.10)
To further explore the spatial distribution characteristics of the trade-offs and synergies between different ESs in the basin, we mapped various ES data onto the vector map of the study area and imported them into GeoDa software (Chicago University, Chicago, Illinois, USA) for spatial analysis. Using the bivariate local Moran's I index under the spatial module of the software, we conducted a bivariate spatial autocorrelation analysis of ESs. Points in "high-high" (or "low-low") areas have high (or low) research variable values (synergistic relationship), indicating spatial positive correlation. Points falling into "high-low" and "low-high" areas exhibit spatial negative correlation. The "high-low" represents areas with higher research variable values (strong trade-off relationship), while the "low-high" represents areas with lower values (weak trade-off relationship) (Qian et al., 2018; Wang et al., 2019).

4 Results

4.1 Characteristics of spatiotemporal changes in ESs

The total carbon storage of the watershed increased by 1.22×10⁷ t from 1995 to 2020, exhibiting a 20.1% rise and revealing an initial decline followed by an upsurge in certain areas (Table 5). Spatially, areas with elevated carbon storage were primarily clustered in the middle and downstream (Fig. 2). From 1995 to 2000, carbon storage decreased in the midstream, mainly because of the conversion of low-coverage grassland to unused land. Subsequently, from 2005 to 2010, areas with high carbon storage significantly decreased in the middle and lower reaches but increased in the upper reaches. From 2010 to 2020, carbon storage increased slightly, mainly in the midstream, and was mainly related to the transfer of unused land to cultivated land.
Table 5 Values of ESs in the Keriya River Basin in 1995, 2000, 2005, 2010, 2015, and 2020
ES Year
1995 2000 2005 2010 2015 2020
Carbon storage (×107 t) 6.08 6.02 6.08 7.23 7.25 7.30
Water yield (×108 m3) 5.21 7.12 7.55 9.18 7.08 5.09
Food production (×105 t) 0.91 1.11 1.21 1.48 1.61 1.71
Wind and sand prevention (×109 kg) 0.30 0.48 0.49 0.26 0.47 0.63
Habitat quality 0.128 0.126 0.126 0.159 0.159 0.160
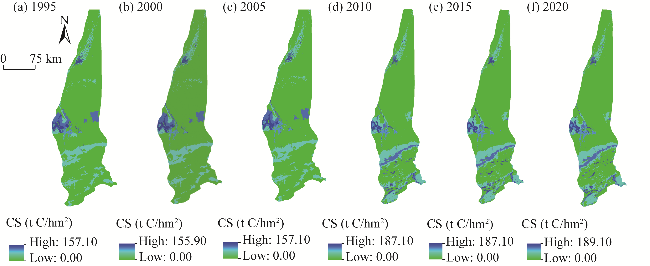
Fig. 2 Spatial distribution of carbon storage (CS) in the Keriya River Basin in 1995 (a), 2000 (b), 2005 (c), 2010 (d), 2015 (e), and 2020 (f)
The annual average water yield in the Keriya River Basin from 1995 to 2020 was approximately 6.90×10⁸ m3/a, which is closely aligned with the measured annual runoff of the Keriya River Basin hydrological station during the same period (7.20×10⁸ m3/a). These values are generally consistent, affirming the reasonableness of the simulation results. Over the study period, the sources of water in the basin exhibited a fluctuation pattern of ''increase-decrease-increase-decrease'' (Fig. 3), with an overall decreasing trend of 2.3% (Tabel 5). The high-value areas of water yield were situated in upstream, whereas the low-value areas were in the middle and downstream, with the western part exhibiting higher values than the eastern part. The spatial distribution of water yield from model calculation concurred with local rainfall patterns and glacier water distribution. Areas experiencing increased water yield service from 1995 to 2020 were primarily located in the upstream and mainly concentrated in areas with land types such as glacier and grassland (Fig. 3).
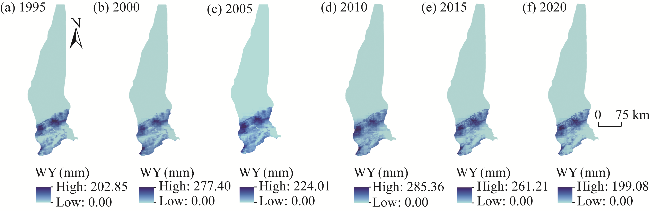
Fig. 3 Spatial distribution of water yield (WY) in the Keriya River Basin in 1995 (a), 2000 (b), 2005 (c), 2010 (d), 2015 (e), and 2020 (f)
Over the past 25 a, the food production in the Keriya River Basin has steadily increased by 87.9% (Table 5). Spatially, areas with higher food production were concentrated in the midstream (Fig. 4). High-value areas are those with a concentrated population distribution throughout the watershed and the most frequent human activities. The midstream, with favorable agricultural conditions due to terrain and soil quality, exhibited higher food production compared with the eastern part. Notably, the expansion of cultivated land tended towards the east and south, reflected in the increasing trend of food production distribution in these directions.
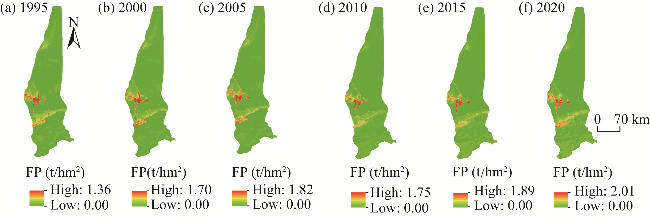
Fig. 4 Spatial distribution of food production (FP) in the Keriya River Basin in 1995 (a), 2000 (b), 2005 (c), 2010 (d), 2015 (e), and 2020 (f)
The amount of wind and sand prevention in the Keriya River Basin exhibited a fluctuating trend of "rise-fall-rise" from 1995 to 2020, increasing by 0.33×10⁹ kg (Table 5). Spatially, areas with high amount of wind and sand prevention per unit area in 1995 were predominantly located in the middle and lower reaches of the river (Fig. 5). The amount of wind and sand prevention per unit area in the lower reaches significantly decreased from 1995 to 2000. The amount of wind and sand prevention per unit area in the midstream of the basin changed significantly in 2010; however, the changes were insignificant from 2015 to 2020.
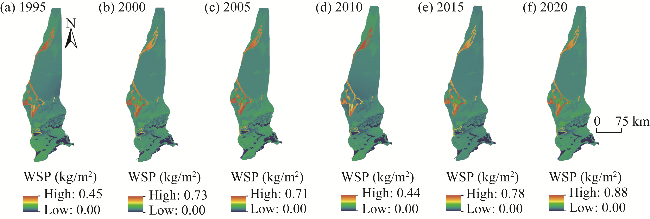
Fig. 5 Spatial distribution of wind and sand prevention (WSP) in the Keriya River Basin in 1995 (a), 2000 (b), 2005 (c), 2010 (d), 2015 (e), and 2020 (f)
The multiyear average habitat quality index of the basin from 1995 to 2020 was 0.143, demonstrating an overall upward trajectory (Table 5). Habitat quality reached its peak in 2020 and lowest point in 2000 and 2005. The most significant change in habitat quality occurred from 2005 to 2010, witnessing a 26.2% increase. Spatially, areas with higher habitat quality value from 1995 to 2020 were concentrated in the middle and lower reaches. Areas with significant increases in habitat quality in the basin from 1995 to 2020 showed high- and low-coverage grassland distributions in the upper and middle reaches, whereas areas with significant decreases in habitat quality were concentrated in the lower reaches of forest land and middle reaches of medium- and low-coverage grassland distributions (Fig. 6).
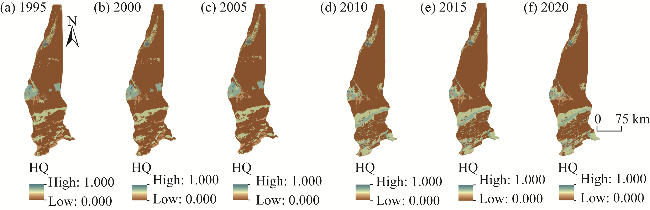
Fig. 6 Spatial distribution of habitat quality (HQ) in the Keriya River Basin in 1995 (a), 2000 (b), 2005 (c), 2010 (d), 2015 (e), and 2020 (f)

4.2 Assessment of trade-offs and synergies

The correlation coefficient between water yield and wind and sand prevention exhibited the highest magnitude. Over time, the trade-off between water yield and wind and sand prevention increased, between water yield and carbon storage declined annually, and between wind and sand prevention and habitat quality also decreased annually. Spatially, the trade-off points between water yield and wind and sand prevention were dispersed across the basin, with a significant increase in the upstream and midstream and a notable decrease in the downstream during the study period (Fig. 7). The trade-off between water yield and carbon storage primarily occurred in the upstream, with a significant decrease observed in the upstream and midstream from 1995 to 2020. Moreover, trade-off areas for water yield and habitat quality were widespread throughout the watershed, with a marked increase in the upstream and a significant decrease in the downstream from 1995 to 2020. The trade-off between food production and water yield was mainly concentrated in the middle and lower reaches of the basin, showing a significant decrease in most areas of the basin from 1995 to 2020, except for a minor increase in the middle reaches, which was attributed to cultivated land expansion.
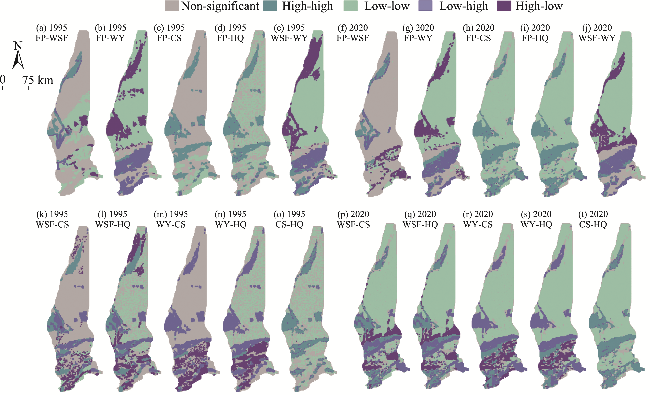
Fig. 7 Spatial distribution of trade-offs and synergies between ES pairs in the Keriya River Basin in 1995 (a, b, c, d, e, k, l, m, n, and o) and 2020 (f, g, h, i, j, p, q, r, s, and t). Non-significant represents there is no correlation between ES pairs, high-high represents strong synergy relationship and low-low represents low synergy relationship between ES pairs, while high-low represents strong trade-off relationship and low-high represents low trade-off relationship between ES pairs.
Spatially, the synergistic distribution between carbon storage and habitat quality appeared relatively dispersed, while areas of synergy between food production and wind and sand prevention were mainly situated in the middle and lower reaches. Notably, a significant decrease in the synergy area was observed between food production and wind and sand prevention from 1995 to 2020. The distribution areas of food production, carbon storage, and habitat quality exhibited relatively consistent patterns. During the same period, notable highly increases in the synergy areas of food production, carbon storage, and habitat quality were observed in the upstream, whereas a significant decrease occurred in the midstream.
A highly significant synergistic relationship existed between carbon and habitat quality in the basin during the study period, with correlation coefficient exceeding 0.80 (Fig. 8). Over time, a slight downward trend was observed in the synergistic relationship between carbon storage and habitat quality. The synergistic relationship between food production and water yield displayed an upward-downward trend, experiencing an overall increase from 0.04 in 1995 to 0.20 in 2020. Furthermore, synergies were identified between food production and wind and sand prevention, carbon storage, and habitat quality. Additionally, a synergistic relationship was observed between wind and sand prevention and other services in addition to water yield.
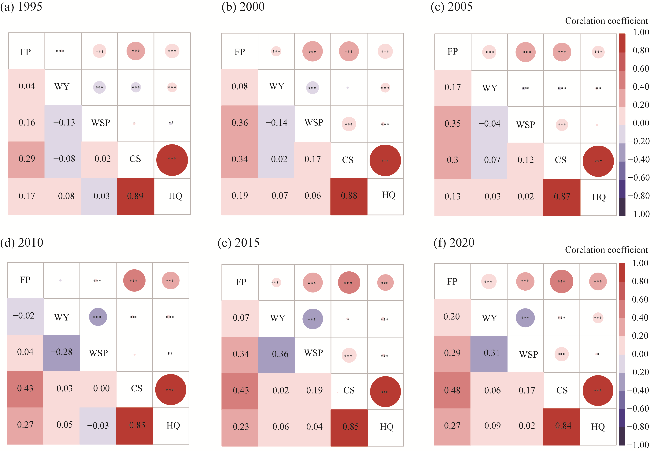
Fig. 8 Correlation analysis of ESs in the Keriya River Basin in 1995 (a), 2000 (b), 2005 (c), 2010 (d), 2015 (e), and 2020 (f). *, P<0.050 level; **, P<0.010 level; ***, P<0.001 level. Positive numbers represent synergy relationship between ES pair, while negative numbers represent trade-off relationship between ES pair. The size of circle represents the value of the correlation coefficient, i.e., the higher the correlation coefficient, the larger the circle.

5 Discussion

5.1 ES changes

This study assessed five primary ESs (carbon storage, water yield, food production, wind and sand prevention, and habitat quality) in typical watersheds of arid areas in Northwest China, evaluated their spatiotemporal changes from 1995 to 2020, and analyzed the trade-offs and synergistic relationships between them. At present, these five ESs are the most representative services provided by the study area, as determined through field research, literature reviews, and expert interviews. Over the study period, wind and sand prevention, food production, carbon storage, and habitat quality increased in the watershed while water yield decreased (Table 5). Spatially, water yield was predominant in the upstream (Fig. 3), food production was the highest in the midstream (Fig. 4), and wind and sand prevention was the strongest in the downstream (Fig. 5). Notably, from 1995 to 2020, different ESs in the Keriya River Basin exhibited varying trends in the upper, middle, and lower reaches. Wind and sand prevention, carbon storage, and habitat quality increased in the upstream but decreased in the midstream and downstream, while food production primarily served the midstream and displayed a continuous upward trend throughout the research period.
Carbon storage metric serves as an indicator of ecosystems' climate regulation functions (Ito et al., 2016). Contrary to the findings reported by Zhu et al. (2021), our data analysis revealed a consistent increase in total carbon storage from 2000 to 2020 (Table 5). However, disparities in carbon storage change trends between our watershed-scale analysis and broader studies of arid area in Northwest China highlight the influence of research scale. Notably, carbon storage varied across the upper, middle, and lower reaches of the river, with an increase in the upstream and a decline in the downstream (Fig. 2). Significant carbon storage increases were observed in areas with abundant high-coverage grasslands in the upstream, while forest and low-coverage grassland in the downstream experienced notable decreases. These changes were largely attributed to the variation of LULC, aligning with the findings of Zhu et al. (2021). Soil organic carbon, the most abundant carbon pool, underscores the importance of forest and as in enhancing watershed carbon storage. Research indicates that deforestation for agricultural expansion can lead to substantial soil organic carbon loss (Wasige et al., 2014). The carbon pool data used in this study show that the total carbon storage of forest, high-coverage grassland, and medium-coverage grassland is higher than that of cultivated land. Therefore, protecting forests and grasslands improves the carbon storage in watershed ecosystem. The quantitative carbon storage model used the empirical values of the four main carbon reservoirs. Due to limited conditions, carbon storage data were not measured in this study. Therefore, carbon pool data were collected from similar areas in China through an extensive literature review and analysis, and carbon pool data from the study area were obtained through multiple rounds of organization and analysis. In future studies, it's necessary to address this gap.
Water yield plays a crucial role in the sustainable development of arid areas. Data analysis revealed a decline in water yield across the entire watershed. While water yield significantly increased (76.2%) from 1995 to 2010, then subsequently decreased by 44.6% from 2010 to 2020. This decrease is attributed to the continuous rise in agricultural water consumption and decline in ecological water consumption in arid areas, a trend observed in other watersheds as well. Surface water resources in the Tarim Basin primarily originate from glacial meltwater (Chen et al., 2022a), although, with accelerated glacier melting and increased water consumption, the limited water resources are depleting, thereby jeopardizing the sustainable utilization of water supply service.
Observations of increased cultivated land and food production align with findings from multiple watersheds in the arid area of Northwest China, particularly in the middle reaches where human activities are concentrated (Chen et al., 2022a; Hou et al., 2022; Zhao et al., 2022). Human reliance on watershed ecosystem food production has become increasingly pronounced. However, due to constraints such as soil, terrain, and water availability in the upper and lower reaches of the basin, food production has remained relatively stable over the past two decades. Along with cultivated land, forests and grasslands also contribute to food production service, but their impact on total food production is minor due to the dominance of cultivated land in the middle reaches of the Keriya River.
Wind and sand prevention is extremely important in arid areas, especially for the oases in the Tarim Basin. Sandstorms are prevalent throughout the year, and they not only pollute the atmosphere but also cause soil nutrient loss, thereby hindering natural vegetation and reducing agricultural soil fertility (Zou et al., 2018; Joshi, 2021; Du et al., 2022). During the research period, a trend of increasing wind and sand prevention was observed in the upper reaches of the Keriya River, limited changes were observed in the middle reaches, and a decrease was observed in the lower reaches. Spatially, the wind and sand prevention of the study area was relatively high in the middle and downstream. Relevant research has shown that wind erosion in the Tarim Basin has significantly increased over the past decades, and its rate of change is the fastest in Central Asia (Li et al., 2023). According to the wind and sand prevention estimation model, meteorological factors and vegetation coverage are the main factors affecting wind and sand prevention. In recent years, the temperature in the study area has increased and the wind speed has accelerated, thereby increasing soil drought and the sensitivity of vegetation to climate. The change in vegetation coverage in the upper reaches was positively correlated with wind and sand prevention. Although grassland in the middle reaches has significantly decreased, cultivated land is increasing, and the total vegetation coverage shows little change. Therefore, the change in wind and sand prevention in the midstream was not significant. However, vegetation coverage decreased in the downstream, and the associated wind and sand prevention service weakened.
Habitat quality serves as a crucial ecological protection metric for watersheds, and it was assessed here using the InVEST model. Despite the Keriya River Basin's relatively limited vegetation diversity, habitat quality exhibited a temporal increasing trend, albeit with regional disparities. Upstream areas experienced notable habitat quality improvements, while the midstream and downstream displayed declining trends (Fig. 6). Our estimation model underscores the significant influence of LULC changes on habitat quality, which were particularly evident in the midstream, where increased construction land and grassland degradation have adversely impacted habitat quality. Given the pivotal role of vegetation in supporting habitat quality, efforts to mitigate LULC changes, such as forest degradation and urban expansion, are imperative for sustaining ecological integrity in the Keriya River Basin.

5.2 Relationships between ESs

These five ESs are not independent of the change process and are influenced by each other. This mutual influence occurs at the watershed scale and in the mutual influence and interaction processes among various services in the upstream, midstream, and downstream. This study reveals intricate trade-offs and synergies among ESs in the Keriya River Basin. The trade-off between water yield and wind and sand prevention intensified at the watershed scale, with increasing trade-off between upstream and downstream and decreasing trade-off between midstream and downstream. A trade-off between wind and sand prevention and habitat quality was evident, albeit weakening. A trade-off was observed between water yield and food production, and it was particularly pronounced in the middle reaches. This trade-off relationship increased in some areas of the middle reaches but weakened in most areas. The trade-off between water yield and food production is strengthening in the upstream. The primary water sources in the Keriya River Basin are glacial meltwater and groundwater, which are crucial for irrigation, with approximately 50.0% of irrigation water originating from glacial meltwater (Wu et al., 2022). However, accelerated glacier melting under climate change diminishes the available water for vegetation, thus impacting the water yield of the basin. The intricate relationship between water yield and food production is pivotal for watershed sustainability, requiring comprehensive research from diverse perspectives.
A synergistic relationship was observed among food production, wind and sand prevention, carbon storage, and habitat quality. However, the synergy between wind and sand prevention and food production decreased, notably in the middle and lower reaches. Increased crop planting area has played a role in preventing wind and sand prevention for a certain period. However, the long-term pursuit of increasing food production and the use of water resources have led to a decrease in ecological water consumption, which is not conducive to the growth of natural vegetation (Chen et al., 2022a) and affects the sustainable development of agriculture (Wu et al., 2022). From the perspective of land use transfer, when unused land was converted into cultivated land, the food production improved. At the same time, the carbon storage, habitat quality, and wind and sand prevention of oasis also improved after unused land was converted into ecological land such as grassland. A trade-off was also observed between food production and wind and sand prevention, carbon storage, and habitat quality in some areas. When forest and grassland were converted into cultivated land, food production was improved, but at the same time, after other land types were converted into cultivated land, soil structure and quality may undergo significant changes. Continuous cultivation diminished soil carbon storage, habitat quality, and wind and sand prevention in watersheds. Moreover, intensive cultivated land management homogenizes land use, reducing habitat quality. The declining trend in carbon storage and habitat quality in the middle and lower reaches may result from grasslands exhibiting higher carbon storage and habitat quality than unused land. Conversion of grassland to unused land diminished carbon storage and habitat quality in the basin.

5.3 Limitations and recommendations

The estimation of ESs using the InVEST model relied on data acquired from existing literature rather than personal field research. Despite extensive literature review and experimental validation, the accuracy of these data must be enhanced, possibly through on-site sampling in future studies. Moreover, the accuracy of meteorological data utilized in the research institute warrants improvement. Given the scarcity of meteorological stations in the middle and lower reaches of the study area, relevant meteorological data were derived through interpolation analysis. While this method underwent rigorous simulation, calculation, and verification processes, further enhancement is necessary to better reflect the actual conditions of the study area.
Additionally, the inclusion of cultural functions within the assessment of ecosystem service functions is imperative. Presently, cultural services have not been evaluated due to limitations, neglecting the cultural significance, particularly in the downstream area of the Daliyaboyi Oasis. This cultural dimension is crucial for comprehensively analyzing the relationship between ESs and human well-being. Furthermore, changes in LULC profoundly influence the spatiotemporal dynamics of ESs. Human activities, predominantly in the middle and lower reaches of rivers, are the primary drivers of LULC change, while climate change predominantly impacts the upstream area. Future research should undertake more quantitative investigations to provide a more comprehensive understanding of driving forces behind changes in ESs.
Moreover, a consensus has not been reached on how to delineate the Keriya River Basin. The classification into upstream, midstream, and downstream areas in this study is based on previous literature (Ni, 1993; Wang et al., 2022b; Zhang et al., 2023); however, a more scientifically rigorous division method warrants further exploration in subsequent stages. Furthermore, since the Keriya River falls under the jurisdiction of Yutian County administratively, this study primarily focused on analyzing Yutian County within the Keriya River Basin. Nevertheless, areas beyond Yutian County necessitate inclusion in future research endeavors.

6 Conclusions

Over the past 25 a, the Keriya River Basin has witnessed a notable increase in food production, carbon storage, habitat quality, and wind and sand prevention but a fluctuating trend in water yield with an overall decline. Spatially, the ES distribution demonstrates higher concentrations in the upper basin for water yield, carbon storage, and habitat quality, peaks for food production in the middle reaches, and high values for wind and sand prevention in the lower stretches.
The interplay of ESs within the basin reveals significant trade-offs, which are particularly evident in the pronounced trade-off between water yield and wind and sand prevention. Moreover, a noteworthy synergistic relationship between carbon storage and habitat quality was observed across the watershed, along with synergy between food production and carbon storage. Additionally, food production demonstrated synergistic relationships with wind and sand prevention, water yield, and habitat quality. Spatially, the synergy between carbon storage and habitat quality increased in the upstream but decreased in the downstream, primarily due to diminishing forest land and grassland cover in the downstream. The synergy and trade-off dynamics among ESs in the Keriya River Basin varied across different scales based on the influence of both natural factors and human activities. Water resources played a pivotal role in the basin's sustainable development, thus emphasizing the complex trade-offs and synergies with water yield, especially in relation to food production, which warrants further study.
An examination of the relationships among ESs revealed that the middle reaches of the river exhibited more pronounced trade-offs compared to other sections, which is attributed to the diverse land use types and complex interrelations under human influence. However, as land use types become more homogeneous, the trade-offs between ESs in the midstream gradually diminish. At the watershed level, the intricate trade-off and synergy between water yield and food production require further attention. While the short-term benefits of increased glacier meltwater due to climate change may favor agricultural development, the long-term implications could jeopardize oasis sustainability. Despite a synergistic relationship between food production and wind and sand prevention in the midstream, this synergy diminished in the midstream and downstream, underscoring the importance of rational land planning, improved water resource utilization efficiency, downstream vegetation protection, and wind and sand prevention enhancement for the basin's sustainable socio-ecological system.

Conflict of interest

The author declare that she has no known competing financial interests or personal relationships that could have appeared to influence the work reported in this paper.

Acknowledgements

This study was financially supported by the Natural Science Foundation of Xinjiang Uygur Autonomous Region (2022D01C77) and the PhD Programs Foundation of Xinjiang University (BS202105). The author appreciates the anonymous reviewers for their constructive comments and suggestions, which have significantly improved the content and quality of this manuscript.

Author contributions

Conceptualization, writing - original draft preparation, writing - review and editing, data curation, supervision, software, and visualization: ZUBAIDA Muyibul. The author approved the manuscript.
[1]
Bennett E M, Balvanera P. 2007. The future of production systems in a globalized world. Frontiers in Ecology and the Environment, 5(4): 191-198.

[2]
Bennett E M, Peterson G B, Gordon L J. 2009. Understanding relationships among multiple ecosystem services. Ecology Letters, 12(12): 1394-1404.

[3]
Butler J R, Wong G Y, Metcalfe D J, et al. 2013. An analysis of trade-offs between multiple ecosystem services and stakeholders linked to land use and water quality management in the Great Barrier Reef, Australia. Agriculture, Ecosystems & Environment, 180: 176-191.

[4]
Chen B M, Jing X, Liu S S, et al. 2022a. Intermediate human activities maximize dryland ecosystem services in the long-term land-use change: Evidence from the Sangong River watershed, northwest China. Journal of Environmental Management, 319: 115708, doi: 10.1016/j.jenvman.2022.115708.

[5]
Chen H, Fleskens L, Schild J, et al. 2022b. Impacts of large-scale landscape restoration on spatiotemporal dynamics of ecosystem services in the Chinese Loess Plateau. Landscape Ecology, 37: 329-346.

[6]
Crawford S L. 2006. Correlation and regression. Circulation, 114 (19): 2083-2088.

[7]
Cui F Q, Tang H P, Zhang Q, et al. 2019. Integrating ecosystem services supply and demand into optimized management at different scales: A case study in Hulunbuir, China. Ecosystem Services, 39: 100984, doi: 10.1016/j.ecoser.2019.100984.

[8]
Du H Q, Liu X F, Jia X P, et al. 2022. Assessment of the effects of ecological restoration projects on soil wind erosion in northern China in the past two decades. Catena, 215: 106360, doi: 10.1016/j.catena.2022.106360.

[9]
Du K X, Zhang F P, Feng Q. et al. 2023. Topographic gradient effect and ecological zoning of ecosystem services in Heihe River Basin. Journal of Desert Research, 43(2): 139-149. (in Chinese)

[10]
Gong J, Xie Y C, Cao E J, et al. 2019. Integration of InVEST-habitat quality model with landscape pattern indexes to assess mountain plant biodiversity change: A case study of Bailongjiang watershed in Gansu Province. Journal of Geographical Sciences, 29(7): 1193-1210. (in Chinese)

[11]
Guo L J. 2021. The study on trade-offs of ecosystem services in Kashgar region, Xinjiang base on land use. MSc Thesis. Shihezi: Shihezi University. (in Chinese)

[12]
Han M, Xu C C, Long Y X, et al. 2022. Simulation and prediction of changes in carbon storage and carbon source/sink under different land use scenarios in arid region of Northwest China. Bulletin of Soil and Water Conservation, 42(3): 335-344. (in Chinese)

[13]
Hou Y F, Chen Y N, Ding J L, et al. 2022. Ecological impacts of land use change in the arid Tarim River Basin of China. Remote Sensing, 14(8): 1894, doi: 10.3390/rs14081894.

[14]
Hu F, Zhang Y, Guo Y, et al. 2022. Spatial and temporal changes in land use and habitat quality in the Weihe River Basin based on the PLUS and InVEST models and predictions. Arid Land Geography, 45(4): 1125-1136. (in Chinese)

[15]
Ito A, Nishina K, Noda H M. 2016. Impacts of future climate change on the carbon budget of northern high-latitude terrestrial ecosystems: an analysis using ISI-MIP data. Polar Science, 10(3): 346-355.

[16]
Joshi J R. 2021. Quantifying the impact of cropland wind erosion on air quality: A high-resolution modeling case study of an Arizona dust storm. Atmospheric Environment, 263: 118658, doi: 10.1016/j.atmosenv.2021.118658.

[17]
Kulaixi Z, Chen Y N, Wang C, et al. 2023. Spatial differentiation of ecosystem service value in an arid region: A case study of the Tarim River Basin, Xinjiang. Ecological Indicators, 151: 110249, doi: 10.1016/j.ecolind.2023.110249.

[18]
Kuri F, Murwira A, Murwira K S, et al. 2014. Predicting maize yield in Zimbabwe using dry dekads derived from remotely sensed Vegetation Condition Index. International Journal of Applied Earth Observation & Geoinformation, 33: 39-46.

[19]
Li J H, Bai Y, Alatalo J M. 2020. Impacts of rural tourism-driven land use change on ecosystems services provision in Erhai Lake Basin, China. Ecosystem Services, 42: 101081, doi: 10.1016/j.ecoser.2020.101081.

[20]
Li J X, Yuan X L, Su Y, et al. 2023. Trade-offs and synergistic relationships in wind erosion in Central Asia over the last 40 years: A Bayesian Network analysis. Geoderma, 437: 116597, doi: 10.1016/j.geoderma.2023.116597.

[21]
Li Y, Luo H F. 2023. Trade-off/synergistic changes in ecosystem services and geographical detection of its driving factors in typical karst areas in southern China. Ecological Indicators, 154: 110811, doi: 10.1016/j.ecolind.2023.110811.

[22]
Li Z H, Deng X Z, Jin G, et al. 2020. Tradeoffs between agricultural production and ecosystem services: A case study in Zhangye, Northwest China. Science of the Total Environment, 707: 136032, doi: 10.1016/j.scitotenv.2019.136032.

[23]
Li Z H, Xia J, Deng X Z, et al. 2021. Multilevel modelling of impacts of human and natural factors on ecosystem services change in an oasis, Northwest China. Resources, Conservation and Recycling, 169: 105474, doi: 10.1016/j.resconrec.2021.105474.

[24]
Ling H B, Yan J J, Xu H L, et al. 2019. Estimates of shifts in ecosystem service values due to changes in key factors in the Manas River basin, northwest China. Science of the Total Environment, 659: 177-187.

[25]
Liu F T, Xu E Q. 2020. Comparison of spatial-temporal evolution of habitat quality between Xinjiang crops and non-crops region based on land use. Chinese Journal of Applied Ecology, 31(7): 2341-2351. (in Chinese)

[26]
Liu J M, Pei X T, Zhu W Y, et al. 2023. Scenario modeling of ecosystem service trade-offs and bundles in a semi-arid valley basin. Science of the Total Environment, 896: 166413, doi: 10.1016/j.scitotenv.2023.166413.

[27]
Liu L M, Wang T T, Li X F, et al. 2021a. Spatiotemporal variations of wind prevention and sand fixation function in the sand-prevention belt in Inner Mongolia in recent 15 years. Chinese Journal of Ecology, 40(11): 3436-3447. (in Chinese)

[28]
Liu Y, Zhang J, Zhou D M, et al. 2021b. Temporal and spatial variation of carbon storage in the Shule River Basin based on InVEST model. Acta Ecologica Sinica, 41(10): 4052-4065. (in Chinese)

[29]
Maimaiti B, Chen S S, Kasimu A, et al. 2021. Urban spatial expansion and its impacts on ecosystem service value of typical oasis cities around Tarim Basin, northwest China. International Journal of Earth Observations and Geoinformation, 104: 102554, doi: 10.1016/j.jag.2021.102554.

[30]
Muhtar P, Xia J X, Muyibul Z, et al. 2021. Evaluating the evolution of oasis water metabolism using ecological network analysis: A synthesis of structural and functional properties. Journal of Cleaner Production, 280: 124422, doi: 10.1016/j.jclepro.2020.124422.

[31]
Nagendra H, Mairota P, Marangi C, et al. 2015. Satellite Earth observation data to identify anthropogenic pressures in selected protected areas. International Journal of Applied Earth Observation and Geoinformation, 37: 124-132.

[32]
Ni P R. 1993. Hisdery, present situation and evolution prospect of Daliyaboyi Oasis. Arid Zone Research, 4: 12-18. (in Chinese)

[33]
Pan N H, Guan Q Y, Wang Q Z, et al. 2021. Spatial differentiation and driving mechanisms in ecosystem service value of arid region: A case study in the middle and lower reaches of Shule River Basin, NW China. Journal of Cleaner Production, 319: 128718, doi: 10.1016/j.jclepro.2021.128718.

[34]
Pellowe K E, Meacham M, Peterson G D, et al. 2023. Global analysis of reef ecosystem services reveals synergies, trade-offs and bundles. Ecosystem Services, 63: 101545, doi: 10.1016/j.ecoser.2023.101545.

[35]
Peng S Z, Ding Y X, Wen Z M, et al. 2017. Spatiotemporal change and trend analysis of potential evapotranspiration over the Loess Plateau of China during 2011-2100. Agricultural and Forest Meteorology, 233: 183-194.

[36]
Power A G. 2010. Ecosystem services and agriculture: tradeoffs and synergies. Philosophical Transactions of the Royal Society B-Biological Sciences, 365(1554): 2959-2971.

[37]
Qian C, Gong J, Zhang J. et al. 2018. Change and tradeoffs-synergies analysis on watershed ecosystem services: A case study of Bailongjiang Watershed, Gansu. Acta Geographica Sinica, 753(5): 868-879. (in Chinese)

[38]
Raudsepp H C, Peterson G D, Bennett E M. 2010. Ecosystem service bundles for analyzing tradeoffs in diverse landscapes. Proceedings of National Academy of Sciences of the United States of America, 107(11): 5242-5247.

[39]
Sanon S, Hein T, Douven W, et al. 2012. Quantifying ecosystem service trade-offs: The case of an urban floodplain in Vienna, Austria. Journal of Environmental Management, 111: 159-172.

[40]
Sharp R, Tallis H T, Ricketts T, et al. 2014. InVEST 3.2.0 User's Guide. San Francisco: The Natural Capital Project, Stanford University, University of Minnesota, The nature Conservancy, World Wildlife Fund, 25-144.

[41]
Tengberg A, Radstake F, Zhang K B, et al. 2016. Scaling up of sustainable land management in the Western People's Republic of China: Evaluation of a 10-year partnership. Land Degradation & Development, 27(2): 134-144.

[42]
Terrado M, Sabater S, Chaplin-Kramer B, et al. 2016. Model development for the assessment of terrestrial and aquatic habitat quality in conservation planning. Science of the Total Environment, 540: 63-70.

[43]
Wang B, Li X, Ma C F, et al. 2022a. Uncertainty analysis of ecosystem services and implications for environmental management-An experiment in the Heihe River Basin, China. Science of the Total Environment, 821: 153481, doi: 10.1016/j.scitotenv.2022.153481.

[44]
Wang C, Liu C F, Wu Y H et al. 2019. Spatial pattern, tradeoffs and synergies of ecosystem services in loess hilly region: A case study in Yuzhong County. Chinese Journal of Ecology, 38(2): 521-531. (in Chinese)

[45]
Wang J H, Zhang F, Luo G M, et al. 2022b. Influence of natural and anthropogenic controls on runoff in the Keriya River, central Tarim Basin, China. PLoS ONE, 17(5): e0269132, doi: 10.1371/journal.pone.0269132.

[46]
Wang Y C, Zhao J, Fu J W, et al. 2019. Effects of the Grain for Green Program on the water ecosystem services in an arid area of China-Using the Shiyang River Basin as an example. Ecological Indicators, 104: 659-668.

[47]
Wasige J E, Groen T A, Rwamukwaya B N, et al. 2014. Contemporary land use/land cover types determine soil organic carbon stocks in south-west Rwanda. Nutrient Cycling in Agroecosystems, 100(1): 1-15.

[48]
Wei P J, Wu M H, Jia Y L, et al. 2022. Spatiotemporal variation of water yield in the upstream regions of the Shule River Basin using the InVEST model. Acta Ecologia Sinica, 42(15): 6418-6429. (in Chinese)

[49]
Wu H, Xu M, Peng Z Y, et al. 2022. Quantifying the potential impacts of meltwater on cotton yields in the Tarim River Basin, Central Asia. Agricultural Water Management, 269: 107639, doi: 10.1016/j.agwat.2022.107639.

[50]
Xu Z H, Wei H J, Fan W Q, et al. 2019. Relationships between ecosystem services and human well-being changes based on carbon flow-A case study of the Manas River Basin, Xinjiang, China. Ecosystem Services, 37: 100934, doi: 10.1016/j.ecoser.2019.100934.

[51]
Xu Z W, Zhang Z J. 2018. Spatiotemporal variation of carbon storage in Yuli County during 2010-2016. Research of Environmental Sciences, 31(11): 1909-1917. (in Chinese)

[52]
Yue D X, Zhou Y Y, Guo J J, et al. 2022. Ecosystem service evaluation and optimisation in the Shule River Basin, China. Catena, 215: 106320, doi: 10.1016/j.catena.2022.106320.

[53]
Zhang F, Wang J, Ma L, et al. 2023. OSL chronology reveals Late Pleistocene floods and their impact on landform evolution in the lower reaches of the Keriya River in the Taklimakan Desert. Journal of Geographical Sciences, 33(5): 945-960.

[54]
Zhao J, Shao Z, Xia C Y, et al. 2022. Ecosystem services assessment based on land use simulation: A case study in the Heihe River Basin, China. Ecological Indicators, 143: 109402, doi: 10.1016/j.ecolind.2022.109402.

[55]
Zhao W Y, Wu S Y, Chen X, et al. 2023. How would ecological restoration affect multiple ecosystem service supplies and tradeoffs? A study of mine tailings restoration in China. Ecological Indicators, 153: 110451, doi: 10.1016/j.ecolind.2023.110451.

[56]
Zheng Z M, Fu B J, Hu H T, et al. 2014. A method to identify the variable ecosystem services relationship across time: A case study on Yanhe Basin, China. Landscape Ecology, 29: 1689-1696.

[57]
Zhou J J, Zhao Y R, Huang P, et al. 2020. Impacts of ecological restoration projects on the ecosystem carbon storage of inland river basin in arid area, China. Ecological Indicators, 118: 106803, doi: 10.1016/j.ecolind.2020.106803.

[58]
Zhu G F, Qiu D D, Zhang Z X, et al. 2021. Land-use changes lead to a decrease in carbon storage in arid region, China. Ecological Indicators, 127: 107770, doi: 10.1016/j.ecolind.2021.107770.

[59]
Zhu H S, Zhai J, Hou P, et al. 2022. The protection characteristics of key ecological functional zones from the perspective of ecosystem service trade-off and synergy. Acta Geographica Sinica, 77(5): 1275-1288. (in Chinese)

[60]
Zhu P, Liu X, Zheng Y H, et al. 2020. Tradeoffs and synergies of ecosystem services in key ecological function zones in northern China. Acta Ecologica Sinica, 40(23): 8694-8706. (in Chinese)

[61]
Zou X Y, Li J F, Cheng H, et al. 2018. Spatial variation of topsoil features in soil wind erosion areas of northern China. Catena, 167: 429-439.

[62]
Zubaida M, Xia J X, Polat M, et al. 2018. Spatiotemporal changes of land use/cover from 1995 to 2015 in an oasis in the middle reaches of the Keriya River, southern Tarim Basin, Northwest China. Catena, 171: 416-425.

Outlines

/