Research article

Effects of gravel on the water absorption characteristics and hydraulic parameters of stony soil

  • MA Yan 1, 2 ,
  • WANG Youqi 1, 3 ,
  • MA Chengfeng 1, 3 ,
  • YUAN Cheng 1, 3 ,
  • BAI Yiru , 1, 2, *
Expand
  • 1Breeding Base for State Key Laboratory of Land Degradation and Ecological Restoration in Northwest China, Ningxia University, Yinchuan 750021, China
  • 2School of Geography and Planning, Ningxia University, Yinchuan 750021, China
  • 3School of Ecology and Environment, Ningxia University, Yinchuan 750021, China
* BAI Yiru (Email: )

Received date: 2024-03-14

  Revised date: 2024-05-08

  Accepted date: 2024-05-10

  Online published: 2025-08-14

Abstract

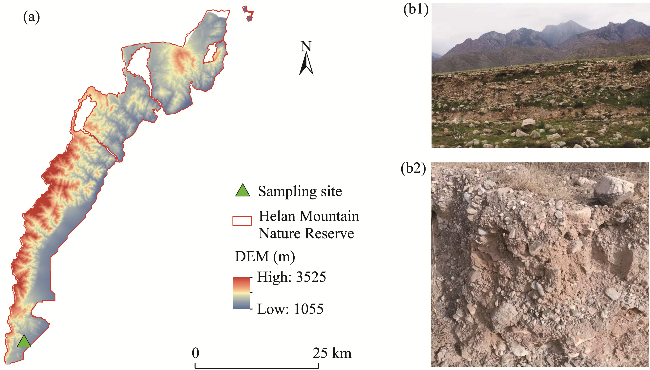
The eastern foothills of the Helan Mountains in China are a typical mountainous region of soil and gravel, where gravel could affect the water movement process in the soil. This study focused on the effects of different gravel contents on the water absorption characteristics and hydraulic parameters of stony soil. The stony soil samples were collected from the eastern foothills of the Helan Mountains in April 2023 and used as the experimental materials to conduct a one-dimensional horizontal soil column absorption experiment. Six experimental groups with gravel contents of 0%, 10%, 20%, 30%, 40%, and 50% were established to determine the saturated hydraulic conductivity (Ks), saturated water content (θs), initial water content (θi), and retention water content (θr), and explore the changes in the wetting front depth and cumulative absorption volume during the absorption experiment. The Philip model was used to fit the soil absorption process and determine the soil water absorption rate. Then the length of the characteristic wetting front depth, shape coefficient, empirical parameter, inverse intake suction and soil water suction were derived from the van Genuchten model. Finally, the hydraulic parameters mentioned above were used to fit the soil water characteristic curves, unsaturated hydraulic conductivity (Kθ) and specific water capacity (C(h)). The results showed that the wetting front depth and cumulative absorption volume of each treatment gradually decreased with increasing gravel content. Compared with control check treatment with gravel content of 0%, soil water absorption rates in the treatments with gravel contents of 10%, 20%, 30%, 40%, and 50% decreased by 11.47%, 17.97%, 25.24%, 29.83%, and 42.45%, respectively. As the gravel content increased, inverse intake suction gradually increased, and shape coefficient, Ks, θs, and θr gradually decreased. For the same soil water content, soil water suction and Kθ gradually decreased with increasing gravel content. At the same soil water suction, C(h) decreased with increasing gravel content, and the water use efficiency worsened. Overall, the water holding capacity, hydraulic conductivity, and water use efficiency of stony soil in the eastern foothills of the Helan Mountains decreased with increasing gravel content. This study could provide data support for improving soil water use efficiency in the eastern foothills of the Helan Mountains and other similar rocky mountainous areas.

Cite this article

MA Yan , WANG Youqi , MA Chengfeng , YUAN Cheng , BAI Yiru . Effects of gravel on the water absorption characteristics and hydraulic parameters of stony soil[J]. Journal of Arid Land, 2024 , 16(7) : 895 -909 . DOI: 10.1007/s40333-024-0079-y

1 Introduction

Soil hydraulic parameters are the basic indicators for studying the process of soil water infiltration, evaluating water use efficiency, and reflecting soil water holding capacity and hydraulic conductivity (Wang et al., 2024b). They are important parameters for clarifying the process of soil water movement and improving the water use efficiency, which mainly include the saturated hydraulic conductivity (Ks), unsaturated hydraulic conductivity (Kθ), saturated water content (θs), and specific water capacity (C(h)). Moreover, soil hydraulic parameters are influenced not only by the physical and chemical properties of soil itself, such as soil texture (Ju et al., 2024), bulk density (Wang et al., 2024a), structure (Basset et al., 2023), and porosity (Leal et al., 2023), but also by external environmental factors, such as land use, fertilization, and other human activities (Gubiani et al., 2023).
The eastern foothills of the Helan Mountains in Ningxia Hui Autonomous Region are a famous production base for high-quality grapes and wine in China (Liu et al., 2021; Tao et al., 2023; Wei et al., 2023). The planting of grapes in this area is primarily concentrated in the piedmont alluvial fans and floodplains, where the soil surface and profile are interspersed with a large amount of gravel (Yang et al., 2019; Chen et al., 2021). Gravel not only increasingly affects the water movement channels and water cross sections, resulting in a more complex soil water infiltration process than that of homogeneous soil, but also affects water use efficiency and crop growth (Hou et al., 2023; Leal et al., 2023). Therefore, it is necessary to investigate the soil water absorption characteristics and hydraulic parameters under different gravel contents, which could improve the water use efficiency and promote the ecological construction and agricultural development of the regions in Helan Mountains.
In general, the saturated fluxes in the soil water movement process could be expressed by Ks and θs that are relatively easy to detect, but in fact the soil water is unsaturated for a long time (Ruan et al., 2022). Soil unsaturated fluxes are important for ecology and agriculture, but they are difficult to detect directly. Therefore, the use of soil hydraulic parameters to derive unsaturated fluxes has become a popular research topic (Shao et al., 2023). At present, there are direct and indirect methods for the measurement of soil hydraulic parameters. Direct methods include field and laboratory determination approaches. The field determination method could reflect the actual situation of soil infiltration. However, it also has the disadvantages of complicated operation, a large workload, a long test period, and high cost (Cueff et al., 2021; Fu et al., 2021). In comparison, the laboratory determination method is more convenient, but it could not accurately simulate the field conditions, thus it is difficult to obtain accurate results (Bai et al., 2022). Indirect methods estimate soil hydraulic parameters by measuring other easily available soil properties (such as Ks and θs) and combining them with a model (Ma et al., 2010). Therefore, indirect methods have become fast, feasible, and inexpensive (Sheng et al., 2019; Sheikhbaglou et al., 2021; Amorim et al., 2022).
Many studies have used the van Genuchten model (Tian et al., 2019; Bai et al., 2022; Wang et al., 2024b) and Brooks-Corey model (Dong et al., 2022; Su et al., 2022) to indirectly derive soil hydraulic parameters. For example, Ma et al. (2016) used a one-dimensional horizontal soil column absorption experiment to determine that different soil types had different effects on hydraulic parameters. Villarreal et al. (2019) used the method of horizontal infiltration to obtain the soil water diffusivity and soil water absorption rate in the van Genuchten model, and both results were in good agreement with the predicted values. Bai et al. (2022) used the van Genuchten model to describe the soil water retention curves. Sun et al. (2022) investigated the effects of three types of biological crusts on dryland moisture by using horizontal absorption experiments, and found that biological crusts were able to reduce water diffusion and adsorption rates, and increase soil water content. Wang et al. (2024b) found that the van Genuchten model could better fit the soil water retention curves on the Qinghai-Tibetan Plateau, China.
In summary, one-dimensional horizontal soil column absorption experiments could provide important information for the indirect derivation of soil hydraulic parameters (Sun et al., 2022), which could be used to obtain soil hydraulic parameters more accurately. The water infiltration process could vary due to differences in soil texture and environment, and studies in some regions cannot be applied to other areas (Wang et al., 2024b). Fewer studies have been carried out on the hydraulic parameters of stony soil in the eastern foothills of the Helan Mountains, especially the research using the one-dimensional horizontal soil column absorption experimental data to indirectly deduce soil hydraulic parameters. Thus, the main purpose of this research was to: (1) explore the effects of different gravel contents on the water absorption process of stony soil and obtain the values of Ks, θs, retention water content (θr), and initial water content (θi); (2) determine the soil water absorption rate, length of the characteristic wetting front depth, shape coefficient, empirical parameter, inverse intake suction, and soil water suction; and (3) derive soil hydraulic parameters such as soil water characteristic curves, Kθ, and C(h). The results of this study could clarify the hydraulic characteristics of soil with different gravel contents and provide data for improving the water holding capacity, hydraulic conductivity and water use efficiency of stony soil in rocky mountainous areas.

2 Materials and methods

2.1 Materials

In April 2023, the test soil and gravel samples were taken from the eastern foothills of the Helan Mountains in the Helan Mountain Nature Reserve, Ningxia Hui Autonomous Region, China (Fig. 1). The area has a temperate continental climate. The average annual temperature is 10.1°C, and the average annual precipitation is 179.3 mm. The main peak of the sampling site has an elevation of 1770 m, and the slope of the sampling site ranges from 0.00° to 72.37°. The sampling site is bare ground, and the soil is hyperochric according to the World Reference Base for Soil Resources (Gong et al., 2003). The soil physical and chemical properties are shown in Table 1.
Fig. 1 Overview of the Helan Mountain Nature Reserve based on digital elevation model (DEM) (a) and photos of the sampling sites (b1 and b2)
Table 1 Soil physical and chemical properties in the sampling site
Soil property Clay (%) Silt (%) Sand (%) pH SOM (g/kg)
Value 4.20±0.45 54.00±1.65 41.40±1.52 8.23±0.04 1.62±0.06
Soil property TN (g/kg) TP (g/kg) EC (μs/cm) SWC (%) BD (g/cm3)
Value 0.42±0.02 0.33±0.02 635.00±87.23 3.49±0.39 1.50±0.02

Note: Mean±SD. SOM, soil organic matter; TN, total nitrogen; TP, total phosphorus; EC, electrical conductivity; SWC, soil water content; BD, soil bulk density.

The sampling site is a typical mountainous region of soil and gravel in Helan Mountains with uneven terrain, so the "s" shaped sampling method was used in the study. Five samples were collected from the soil surface (0.0-40.0 cm) using a soil auger and shovel. Then, the samples were homogeneously mixed, the plant stems, dead leaves, and plastics in the soil were removed, and the gravel particles in the soil were picked out as gravel samples. Next, the soil samples were naturally air-dried and separated through a 2.0-mm sieve, and the gravel samples were washed and air-dried, and passed through a stainless-steel sieve with a diameter of 2.5-3.0 cm. Finally, the soil and gravel samples were homogeneously mixed at mass ratios of 0%, 10%, 20%, 30%, 40%, and 50% for use in the soil columns in the one-dimensional horizontal soil column absorption experiment.

2.2 Methods

The water absorption experiment was carried out by the one-dimensional horizontal soil column constant head method (Sun et al., 2022) (Fig. 2). Cylindrical Plexiglas columns and Mahalanobis bottles (both 50.0 cm in height, 10.0 cm in diameter, 0.5 cm in wall thickness, and 1.0 cm in bottom thickness) were used as the absorption experiment equipment. Cylindrical Plexiglas columns were used to fill the soil and gravel samples, and Mahalanobis bottles were used to supply water. At the front end of the soil column, there was a 3.0 cm long water chamber, and at the back end, there was a 47.0 cm long soil chamber. The water chamber had a water inlet valve connected to the Mahalanobis bottle at the front end and an exhaust port with an outer diameter of 1.0 cm at the upper end. The water chamber was connected to the soil chamber by microporous flanges with evenly distributed 2.0 mm holes. When the water was supplied horizontally, the water head was controlled at the same height as the exhaust port at the upper end of the water chamber.
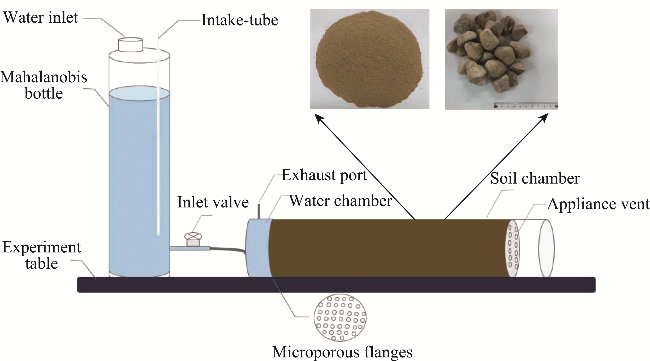
Fig. 2 Diagram of the one-dimensional horizontal soil column absorption experiment equipment
To study the water absorption process in stony soil with different gravel contents, we weighed and mixed soil and gravel samples homogeneously in layers (5.0 cm per layer and 8 layers in total) and then placed in the Cylindrical Plexiglas columns. Each treatment was repeated 3 times, and a total of 18 treatments were established. The bulk densities of control treatment (CK) with gravel content of 0%, and treatments with gravel contents of 10% (R1), 20% (R2), 30% (R3), 40% (R4), and 50% (R5) after filling were 1.50, 1.62, 1.73, 1.84, 1.94, and 2.04 g/cm3, respectively. The soil was fluffed between the layers to avoid soil stratification. A layer of filter paper was used to fill the bottom of the soil column before filling, and a layer of filter paper was used to cover the surface of the soil column after filling. Water was supplied in a Mahalanobis bottle with a head control of approximately 3.0 cm.
During the experiment, the height (cm) of the water surface in the Mahalanobis bottle and the change in the wetting front depth (cm) were recorded at different time points. The heights were the averages of 4 scale readings taken from the front, back, left, and right sides of the Mahalanobis bottle. For the first 5 min, the data were recorded every 10 s. For the period 5-10 min, the observations were made every 30 s. From 10 to 20 min, the data were recorded every minute. Observations were made every 5 min from 20 to 30 min. For the 30-60 min period, the data were recorded for 10 min, and after 60 min, the data were recorded every 30 min. As soon as the wetting front depth reached the bottom of the soil column, the water supply from the Mahalanobis bottle was immediately stopped. The water was quickly drained, and the final data of the Mahalanobis bottle were recorded.

2.3 Absorption model

In this paper, the Philip model (Philip, 1957) was adopted to fit the soil water absorption process, and determine the soil water absorption rate and obtain the values of coefficient of determination (R2). The formula is as follows:
$I=S{{t}^{\frac{1}{2}}},$
where I is the cumulative absorption volume from the one-dimensional horizontal soil column absorption experiment (cm); S is the soil water absorption rate (cm/min0.5); and t is time (min).

2.4 Derivation of soil hydraulic parameters in the van Genuchten model

To study the effects of gravel on the water movement of stony soil more clearly, we substituted the soil hydraulic parameters (length of the characteristic wetting front depth, shape coefficient, empirical parameter, and inverse intake suction) into the relevant expressions, to obtain the soil water characteristic curves and unsaturated hydraulic conductivity curves of stony soil under different gravel contents. The equations of the van Genuchten model (van Genuchten, 1980) and Mualem's relative hydraulic conductivity model (Mualem, 1976) are as follows:
$\frac{\left( \theta -{{\theta }_{r}} \right)}{\left( {{\theta }_{s}}-{{\theta }_{r}} \right)}={{\left[ 1+{{\left( ah \right)}^{n}} \right]}^{-m}}$,
${{K}_{\theta }}={{K}_{s}}{{S}_{e}}^{\frac{1}{2}}{{\left[ 1-{{\left( 1-{{S}_{e}}^{\frac{1}{m}} \right)}^{m}} \right]}^{2}},$
${{S}_{e}}=\left\{ \begin{matrix} \frac{\theta -{{\theta }_{r}}}{{{\theta }_{s}}-{{\theta }_{r}}} & h<0 \\ 1 & h\ge 0 \\ \end{matrix} \right.,$
where θ is the volumetric water content (cm3/cm3), ranging from 0.00 to 0.28 cm3/cm3; θr is the retention water content (cm3/cm3); θs is the saturated water content (cm3/cm3); a is the inverse intake suction (1/cm); h is the soil water suction (cm); n is the shape coefficient of the characteristic curve of the soil water content; m is the empirical parameter, with m=(1-1/n); Kθ is the unsaturated hydraulic conductivity (cm/h); Ks is the saturated hydraulic conductivity (cm/min); and Se is the effective water saturation degree (dimensionless). The values of θr, θs and Ks were measured using the one-dimensional horizontal soil column absorption experiment.
This study used the horizontal absorption experiment to approximate the solution of the partial differential equation by an integral method, which was based on the unsaturated soil water flow in Richards (Shao et al., 2000a, b). Inverse intake suction and shape coefficient were deduced by Equations 5 and 6.
$a=\frac{2{{K}_{s}}}{Sd}{{\left[ \frac{1}{m}\left( \frac{{{\theta }_{s}}-{{\theta }_{i}}}{{{\theta }_{s}}-{{\theta }_{r}}} \right) \right]}^{\frac{1}{n}}},$
$n=\frac{S}{\left[ d\left( {{\theta }_{s}}-{{\theta }_{i}} \right)-S \right]},$
$d={{\lambda }_{\max }},$
$\lambda =x{{t}^{-\frac{1}{2}}},$
where θi is the initial water content from the one-dimensional horizontal soil column absorption experiment (cm3/cm3); d is the length of the characteristic wetting front depth (cm/min0.5), which is the maximum value of the Boltzmann variable (λ) (cm/min0.5); and x is the wetting front depth (cm).
C(h) is the change in the soil water content caused by the change in the unit matrix potential. It is also the reciprocal of the slope of the soil water characteristic curve, which is an important parameter for analyzing soil water movement and retention. The formula is as follows (Chen et al., 2018):
$C\left( h \right)=-\frac{\text{d}\theta }{\text{d}\left| h \right|}=\frac{\left( {{\theta }_{s}}-{{\theta }_{r}} \right)mn{{\left| ah \right|}^{n-1}}}{{{\left[ 1+{{\left| ah \right|}^{n}} \right]}^{m+1}}},$
where C(h) is the specific water capacity (cm3/cm4).

2.5 Statistical analysis

Excel 2010 and Origin 2022 were used for graphing and data fitting. IBM SPSS Statistics v.27.0 software was used for data analysis. Analysis of variance (ANOVA) and the least significant difference (LSD) method for multiple testing were used to analyze the differences in the infiltration process among different treatments at a significance level of 0.05.

3 Results

3.1 Effects of different gravel contents on the wetting front depth of stony soil

Variations in the wetting front depth under different gravel contents are shown in Figure 3a. As the absorption time increased, the wetting front depth of all treatments tended to increase faster and then decreased. At the beginning of the absorption process, the differences among all treatments were not significant (P>0.05). As the absorption process proceeded, the differences among all treatments became increasingly obvious. With the increase of gravel content, the wetting front depth decreased.
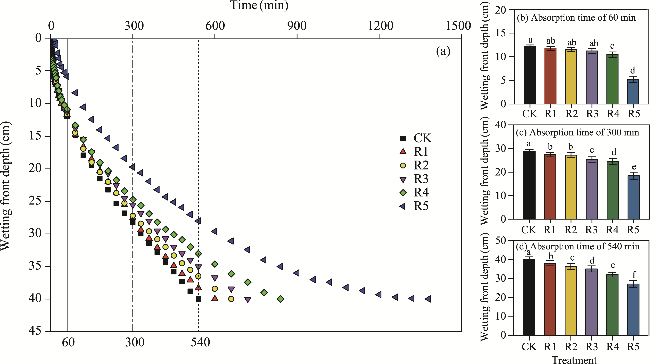
Fig. 3 Variations of the wetting front depth in the whole soil water absorption process (a), at absorption time of 60 min (b), at absorption time of 300 min (c), and at absorption time of 540 min (d) among different treatments. CK, R1, R2, R3, R4, and R5 indicated the treatments with gravel contents of 0%, 10%, 20%, 30%, 40%, and 50%, respectively. Different lowercase letters indicated that a statistically significant difference in the wetting front depth was observed among different treatments at the P<0.05 level. Bars mean standard deviations.
Three time points (60, 300, and 540 min) dividing the early stage, middle stage, and late stage were selected for significant difference analysis of the wetting front depth. As shown in Figure 3b-d, when the absorption time was 60 min, significant differences of the wetting front depth were found among all treatments except for R1, R2, and R3. The wetting front depths of R1, R2, R3, R4, and R5 were 3.31%, 4.96%, 7.44%, 14.05%, and 57.02% lower than that of CK, respectively. As the absorption process proceeded, the differences among the treatments the gradually became more obvious. When the absorption time was 300 min, significant differences of the wetting front depth were found among all treatments except for R1 and R2. The wetting front depths of R1, R2, R3, R4, and R5 were 4.53%, 5.23%, 11.85%, 14.63%, and 35.89% lower than that of CK, respectively. At absorption time of 540 min, the wetting front depths of R1, R2, R3, R4, and R5 were 5.00%, 9.50%, 12.50%, 20.00%, and 32.50% lower than that of CK, respectively (P<0.05).
The wetting front depth slowed down with increasing gravel content, indicating that gravel hindered the water absorption process. When the wetting front depth reached 40.0 cm, the absorption times of CK, R1, R2, R3, R4, and R5 were 540, 600, 660, 720, 840, and 1380 min, respectively. The absorption times of R1, R2, R3, R4, and R5 were 11.10%, 22.21%, 33.34%, 55.56%, and 155.56% longer than that of CK, respectively.

3.2 Effects of different gravel contents on the cumulative absorption volume of stony soil

The process of calculating the cumulative absorption volume was also divided into three stages, similar to the wetting front depth. Figure 4a showed the change in the cumulative absorption volume of stony soil with different gravel contents. At the beginning of the absorption process, the differences among all treatments were small. As the absorption process progressed, the differences among all treatments became obvious.
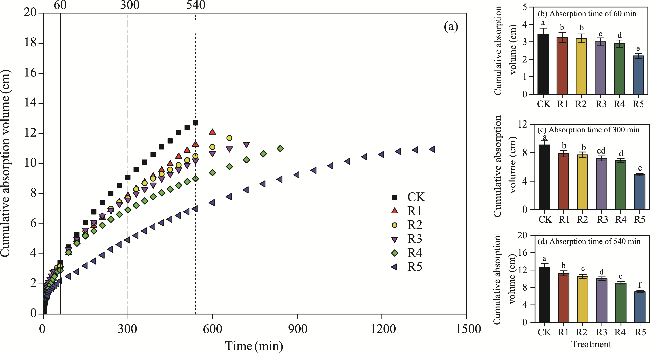
Fig. 4 Variations of cumulative absorption volume in the whole soil water absorption process (a), at absorption time of 60 min (b), at absorption time of 300 min (c), and at absorption time of 540 min (d) among different treatments. Different lowercase letters indicated that a statistically significance in the cumulative absorption volume was observed among the different experimental treatments at the P<0.05 level. Bars mean standard deviations.
As shown in Figure 4b-d, as the absorption process proceeded, significant differences of the cumulative absorption volume were found among all treatments at 60 min except for R1 and R2. The cumulative absorption volumes of R1, R2, R3, R4, and R5 were 4.66%, 6.71%, 12.54%, 15.45%, and 35.86% lower than that of CK, respectively. At absorption time of 300 min, there was a significant difference of the cumulative absorption volume between CK and the other treatments (P<0.05). The cumulative absorption volumes of R1, R2, R3, R4, and R5 were 13.53%, 15.29%, 20.79%, 23.87%, and 45.87% lower than that of CK, respectively. At absorption time of 540 min, the cumulative absorption volumes of R1, R2, R3, R4, and R5 were 11.34%, 17.32%, 21.26%, 29.13%, and 44.88% lower than that of CK, respectively (P<0.05).
The cumulative absorption volume decreased progressively with increasing gravel content. At the end of the absorption process, the cumulative absorption volumes of CK, R1, R2, R3, R4, and R5 were 12.70, 12.06, 11.70, 11.29, 11.00, and 10.94 cm, respectively. The cumulative absorption volumes of R1, R2, R3, R4 and R5 were 5.04%, 7.87%, 11.02%, 13.39%, and 13.78% lower than that of CK, respectively (P<0.05).

3.3 Soil water absorption rate of stony soil with different gravel contents based on the Philip model

Soil water absorption rate refers to the ability of soil to absorb or release solutions by relying on capillary tubes, and it is an important indicator of the soil absorption capacity. Soil water absorption rate in the Philip model was deduced using the cumulative absorption volume and time. Table 2 shows that soil water absorption rate decreased with increasing gravel content, indicating that the presence of gravel can lead to a decrease in soil porosity and water flow curvature, which results in a decrease in soil water absorption rate and worse structure of stony soil. The soil water absorption rates of R1, R2, R3, R4, and R5 were 11.47%, 17.97%, 25.24%, 29.83%, and 42.45% lower than that of CK, respectively. At the same time, R2 values of all treatments after the Philip model fitting were greater than 0.993, which indicated that the simulation effects are better. Therefore, the Philip model could be used to analyze the change in soil water absorption rate of stony soil with different gravel contents.
Table 2 Soil water absorption rate (S) based on the Philip model under different treatments
Treatment Philip model
S (cm/min0.5) R2
CK 0.523 0.993
R1 0.463 0.996
R2 0.429 0.997
R3 0.391 0.998
R4 0.367 0.998
R5 0.301 0.997

Note: CK, R1, R2, R3, R4, and R5 indicated the treatments with gravel contents of 0%, 10%, 20%, 30%, 40%, and 50%, respectively.

3.4 Effects of different gravel contents on Ks and θs of stony soil

Ks is a vital index reflecting the soil hydraulic conductivity, and is important for simulating soil water movement and studying the groundwater environment. θs is an important index which could reflect the soil water holding capacity. Figure 5a showed that Ks decreased with increasing gravel content. The Ks values of R1, R2, R3, R4, and R5 were 17.26%, 22.62%, 30.36%, 37.50%, and 55.36% lower than that of CK, respectively. As shown in Figure 5b, θs decreased with increasing gravel content. The θs values of R1, R2, R3, R4, and R5 treatments were 2.19%, 4.69%, 8.13%, 10.00%, and 11.88% lower than that of CK, respectively. The presence of gravel slowed the soil water absorption process and reduced the soil water holding and hydraulic conductivity.
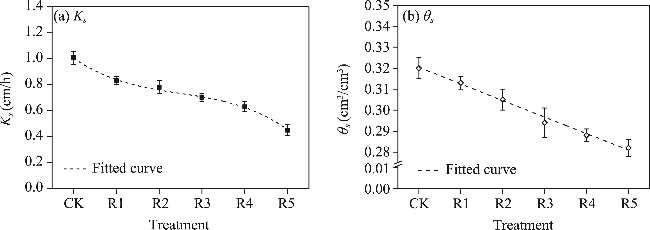
Fig. 5 Variations in saturated hydraulic conductivity (Ks; a) and saturated water content (θs; b) of stony soil among different treatments. Bars mean standard deviations.

3.5 Effects of different gravel contents of stony soil on the parameters of the van Genuchten model

As shown in Table 3, the length of the characteristic wetting front depth, shape coefficient, and empirical parameter in the van Genuchten model decreased with increasing gravel content for all treatments. Inverse intake suction increased with increasing gravel content. The length of the characteristic wetting front depth, shape coefficient, and empirical parameter of R5 were 32.12%, 14.82%, and 10.91% lower than those of CK, respectively, while inverse intake suction of R5 was 20.00% greater than that of CK. The length of the characteristic wetting front depth decreased with increasing gravel content, and its trend showed that the higher the gravel content was, the smaller the wetting front depth and the slower the absorption rate were, which was consistent with the actual situation. The shape coefficient decreased with increasing gravel content, and the soil water absorption capacity decreased. Soil intake suction (which is the critical suction value when the soil starts to drain) corresponds to inverse of the inverse intake suction. Soil intake suction decreased with increasing gravel content. The parameters θs and θr also decreased with increasing gravel content. The results indicated that the higher the gravel content was, the less water the stony soil could hold.
Table 3 Variations in parameters of the van Genuchten model under different treatments
Treatment S
(cm/min0.5)
d
(cm/min0.5)
n m a
(1/cm)
Ks
(cm/h)
θs
(cm3/cm3)
θi
(cm3/cm3)
θr
(cm3/cm3)
CK 0.523 2.301 2.591 0.614 0.035 1.02 0.320 0.005 0.031
R1 0.463 2.085 2.554 0.608 0.036 0.84 0.313 0.004 0.027
R2 0.429 1.987 2.537 0.606 0.038 0.78 0.305 0.004 0.022
R3 0.391 1.912 2.364 0.577 0.040 0.72 0.294 0.003 0.016
R4 0.367 1.854 2.248 0.555 0.041 0.66 0.288 0.002 0.010
R5 0.301 1.562 2.207 0.547 0.042 0.48 0.282 0.002 0.007

Note: d, length of the characteristic wetting front depth; n, shape coefficient; m, empirical parameter; a, inverse intake suction; Ks, saturated hydraulic conductivity; θs, saturated water content; θi, initial water content; θr, retention water content.

3.6 Effects of different gravel contents on the soil water characteristic curves and Kθ of stony soil

As shown in Figure 6, soil water suction decreased rapidly with increasing soil water content. The higher the gravel content was, the slower the soil water characteristic curve decreased. At the same soil water content, soil water suction decreased with increasing gravel content, and the soil water holding capacity decreased. At lower soil water contents, the curves were more dispersed, and the difference in soil water suction was more obvious. As shown in Figure 7, Kθ increased with increasing soil water content. At the same water content, Kθ decreased with increasing gravel content. Kθ was greater at higher water contents than at lower water contents. Kθ of all treatments showed a high degree of overlap with each other when the soil water content was lower than 0.20 cm3/cm3, and the difference was not obvious.
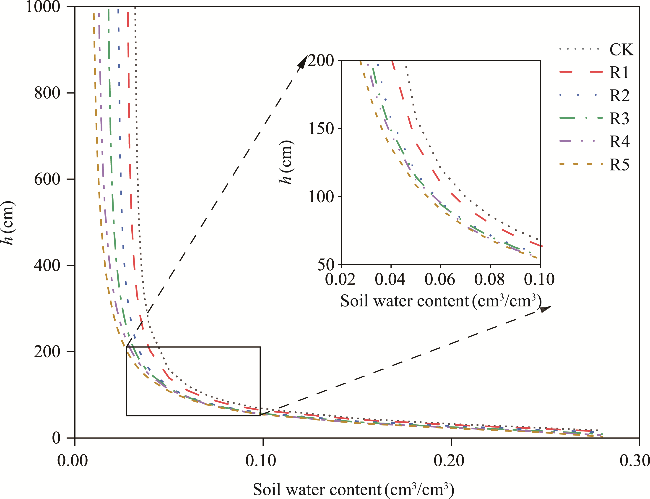
Fig. 6 Variations in soil water characteristic curves under different treatments. h, soil water suction.
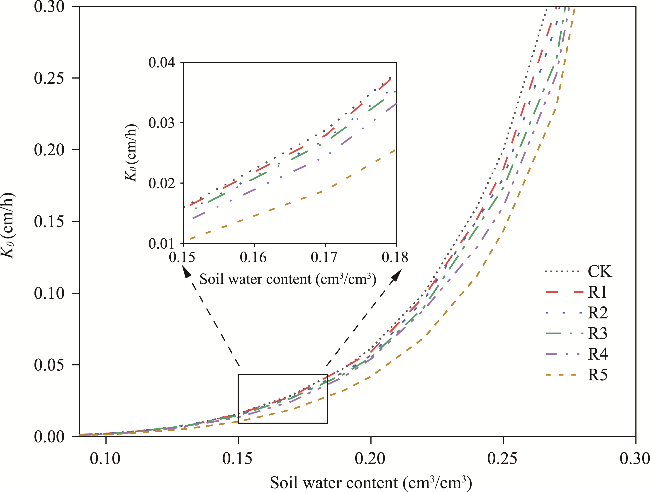
Fig. 7 Variations in unsaturated hydraulic conductivity (Kθ) under different treatments

3.7 Effects of different gravel contents on C(h) of stony soil

C(h) reflects the soil water supply capacity. As shown in Table 4, when soil water suction was in the 100-1000 cm stage, C(h) of each treatment decreased with increasing soil water suction. C(h) decreased faster in the low suction stage (100-400 cm) and decreased more slowly in the medium-high suction stage (400-1000 cm). C(h) of stony soil decreased with increasing gravel content. For the same soil water suction, the lower the C(h) was, the weaker the water supply capacity was, which indicated that the presence of gravel reduced the soil water use efficiency.
Table 4 Specific water capacity (C(h)) in the soil water suction (h) stage of (100-1000 cm) under different treatments
h (cm) C(h) under each treatment (cm3/cm4)
CK R1 R2 R3 R4 R5
100 1.7×10⁻² 1.6×10⁻² 1.4×10⁻² 1.3×10⁻² 1.3×10⁻² 1.2×10⁻²
200 3.0×10⁻³ 2.8×10⁻³ 2.5×10⁻³ 2.4×10⁻³ 2.4×10⁻³ 2.3×10⁻³
400 5.0×10⁻⁴ 4.9×10⁻⁴ 4.5×10⁻⁴ 4.2×10⁻⁴ 4.1×10⁻⁴ 4.0×10⁻⁴
800 10.0×10⁻⁵ 8.0×10⁻⁵ 7.0×10⁻⁵ 6.0×10⁻⁵ 5.0×10⁻⁵ 3.8×10⁻⁵
1000 4.6×10⁻⁵ 4.5×10⁻⁵ 4.2×10⁻⁵ 4.0×10⁻⁵ 3.5×10⁻⁵ 3.3×10⁻⁵

4 Discussion

4.1 Effects of different gravel contents of stony soil on the water absorption process

In this study, the effects of different gravel contents on the soil water absorption process were investigated. The presence of gravel impeded the soil water absorption process, which is consistent with the results of previous studies (Gargiulo et al., 2015; Ilek et al., 2019; Wu et al., 2021; Dong et al., 2022). At the beginning of the soil water absorption process, the wetting front depth and cumulative absorption volume of all treatments were steep and overlapped, and the differences were small. First, in the early stage, soil dryness, a high water potential gradient, and matrix potential were the main factors affecting the wetting front depth and cumulative absorption volume. Second, gravel allowed the formation of dynamic gaps in the soil, and the preferential flow played a major role (Hou et al., 2023; Wang et al., 2024a).
As the soil water absorption process proceeded, the wetting front depth and cumulative absorption volume stabilized, and the differences among all treatments became more obvious. With increasing gravel content, the wetting front depth and cumulative absorption volume decreased. Total soil porosity, bulk density, and water movement channels are the main factors affecting the absorption process (Wang et al., 2024a). First, the presence of gravel reduced the contact area between fine soil particles, leading to a reduction in total soil porosity (Leal et al., 2023). Second, the soil structure became more compact and solid with increasing gravel content, resulting in the obstruction of the absorption process (Lv et al., 2019; Cao et al., 2020; Zheng et al., 2021). Finally, the contact area between the gravel and water increased with increasing gravel content. As a result, the water movement channels became narrower, and the soil water absorption process slowed.
To clearly understand the soil water absorption process, we used the Philip model to simulate the effects of gravel on the soil water absorption rate. With increasing gravel content, soil water absorption rate gradually decreased, and the water diffusion rate decreased. The reason might be that the high gravel content in the eastern foothills of Helan Mountains led to high flow curvature, which limited the water diffusion rate (Yang et al., 2013).

4.2 Effects of different gravel contents of stony soil on the parameters in the van Genuchten model

With increasing gravel content, inverse intake suction in the van Genuchten model gradually increased, whereas Ks, θs, θr, shape coefficient, and empirical parameter gradually decreased. This is similar to the findings of Khetdan et al. (2017).
The decrease in Ks first might be explained by the fact that gravel altered the water movement path and reduced the over water cross-sectional area, leading to a decrease in the amount of water passing through the unit area (Novák and Kňava, 2012; Dong et al., 2022). Second, loose gravel clogged the soil pores (Jiang et al., 2023), resulting in a decrease in the total soil porosity (Ma and Shao, 2008; Sekucia et al., 2020; Huang et al., 2023). Finally, gravel increased the soil compaction and bulk density (Lv et al., 2019; Cao et al., 2020; Zheng et al., 2021), and the water absorption process was impeded. The above analysis indicated that the soil hydraulic conductivity decreased gradually with increasing gravel content.
The increase in inverse intake suction and the decrease in θs and θr first might be because the backwater phenomenon usually occured on the upstream surface of gravel (Hlaváčiková et al., 2016), which led to a decrease in the soil water content within a certain volume. Second, the topography of the eastern foothills of Helan Mountains is relatively gentle, and gravel accumulates as a result of weathering and erosion. Gravel is a low porosity medium that could hinder the accumulation of the soil matrix (Wang et al., 2021), thus resulting in a decrease in total porosity and water storage space (Zhu et al., 2023). Finally, the amount of the soil fine particles decreased with increasing gravel content (Sekucia et al., 2020). Thus, soil water holding capacity decreased gradually with increasing gravel content (Cousin et al., 2003).
The decrease in shape coefficient indicated that the pore size distribution became narrow. The effects of gravel on pore size were first due to the addition of gravel, which resulted in a greater particle size class. Second, the addition of gravel made the soil pores become clogged and the pore size become narrower (Jiang et al., 2023). There was a positive correlation between empirical parameter and shape coefficient, and the effects of gravel on both parameters should be similar.

4.3 Effects of different gravel contents of stony soil on the soil water characteristic curves and Kθ

The effects of gravel on the soil water characteristic curves mainly occurred in the low and medium-high suction stages, which is similar to the findings of Ma et al. (2010), who studied the effects of rock fragments on soil hydraulic characteristics. In the low suction stage, the soil water content rapidly decreased. With increasing suction, the soil water content slowly decreased. This was because in the low suction stage, the soil was influenced by the own large pores and the soil water content decreased rapidly. In the middle-high suction stage, the soil in the micropores had a strong adsorption capacity for soil water, and the soil water content decreased slowly. At the same soil water suction, the higher the gravel content was, the lower the soil water content was, which indicated that the soil water holding capacity decreased. This was because, at the same soil water suction, the higher gravel content led to a decrease in the soil porosity and cross-sectional area of the water flow (Ma and Shao, 2008). The presence of gravel decreased the soil water holding capacity (Gargiulo et al., 2015; Lai et al., 2022).
At lower soil water contents, Kθ of different treatments increased slowly, and the differences among all treatments were not obvious. With increasing soil water content, Kθ increased rapidly, and the differences among all treatments gradually became more obvious. This was mainly because under a low soil water content, soil water mainly existed in the adsorptive micropores, resulting in poor water connectivity in the soil pores. At higher soil water contents, all the soil pores were filled with water, and the water connectivity was high (Sun et al., 2022). At the same soil water content, the higher the gravel content was, the smaller the Kθ was. This indicated that the soil hydraulic conductivity decreased with increasing gravel content. The reason might be that the soil surface of the eastern foothills of Helan Mountains is sandy and porous. The higher the gravel content was, the more compacted the soil was under the same water content, which resulted in an increase in bulk density and hindered water movement (Qiu et al., 2020). The presence of gravel reduced the soil hydraulic conductivity (Hlaváčiková et al., 2016).

5 Conclusions

In this study, we studied and analyzed the effects of different gravel contents on the water absorption characteristics and hydraulic parameters of stony soil. The soil water absorption experiment indicated that the higher the gravel content was, the slower the absorption process was. The Philip model could better simulate the soil water adsorption process under different gravel contents. With increasing gravel content, the length of the characteristic wetting front depth, shape coefficient, empirical parameter, Ks, and θs in the van Genuchten model decreased, while inverse intake suction increased. This indicated that the presence of gravel would reduce the soil water holding and retention capacities. At the same soil water content, soil water suction and Kθ decreased with increasing gravel content. At the same soil water suction, C(h) decreased with increasing gravel content. The presence of gravel reduced the soil water supply capacity. Therefore, the results suggested that excessive gravel should be removed from the soil by a combination of manual and agro-mechanical equipment to improve the soil water use efficiency in the eastern foothills of Helan Mountains and other similar rocky mountainous areas.

Conflict of interest

The authors declare that they have no known competing financial interests or personal relationships that could have appeared to influence the work reported in this paper.

Acknowledgements

This work was funded by the National Natural Science Foundation of China (32360321), the Natural Science Foundation of Ningxia Hui Autonomous Region, China (2023AAC03046, 2023AAC02018), and the Ningxia Key Research and Development Project (2021BEG02011).

Author contributions

Conceptualization: MA Yan, WANG Youqi; Data curation: MA Yan, BAI Yiru; Formal analysis: MA Chengfeng; Funding acquisition: WANG Youqi, BAI Yiru; Investigation: MA Chengfeng; Methodology: MA Yan; Project administration: WANG Youqi; Resources: BAI Yiru; Software: MA Yan; Supervision: WANG Youqi, BAI Yiru; Validation: YUAN Cheng; Visualization: YUAN Cheng; Writing - original draft preparation: MA Yan; Writing - review and editing: BAI Yiru. All authors approved the manuscript.
[1]
Amorim R S S, Albuquerque J A, Couto E G, et al. 2022. Water retention and availability in Brazilian Cerrado (neotropical savanna) soils under agricultural use: Pedotransfer functions and decision trees. Soil and Tillage Research, 224: 105485, doi: 10.1016/j.still.2022.105485.

[2]
Bai X, Shao M A, Jia X X, et al. 2022. Prediction of the van Genuchten model soil hydraulic parameters for the 5-m soil profile in China's Loess Plateau. Catena, 210: 105889, doi: 10.1016/j.catena.2021.105889.

[3]
Basset C, Najm M A, Ghezzehei T, et al. 2023. How does soil structure affect water infiltration? A meta-data systematic review. Soil and Tillage Research, 226: 105577, doi: 10.1016/j.still.2022.105577.

[4]
Cao J H, Chen P P, Li Y P, et al. 2020. Effect of plastic film residue on vertical infiltration under different initial soil moisture contents and dry bulk densities. Water, 12(5): 1346, doi: 10.3390/w12051346.

[5]
Chen J Y, Cai H Y, Gillerman L, et al. 2018. Impact of treated waste water quality on repellent and wettable soil water characteristic curve. Transactions of the Chinese Society of Agricultural Engineering, 34(11): 121-127. (in Chinese)

[6]
Chen Y Y, Li J P, Li X, et al. 2021. Spatio-temporal distribution of the rainstorm in the east side of the Helan Mountain and the possible causes of its variability. Atmospheric Research, 252: 105469, doi: 10.1016/j.atmosres.2021.105469.

[7]
Cousin I, Nicoullaud B, Coutadeur C. 2003. Influence of rock fragments on the water retention and water percolation in a calcareous soil. Catena, 53(2): 97-114.

[8]
Cueff S, Coquet Y, Aubertot J N, et al. 2021. Estimation of soil water retention in conservation agriculture using published and new pedotransfer functions. Soil and Tillage Research, 209: 104967, doi: 10.1016/j.still.2021.104967.

[9]
Dong X Y, Qin F C, Li L, et al. 2022. Study on water vertical infiltration characteristics and water content simulation of sandstone overlying loess. Water, 14(22): 3716, doi: 10.3390/w14223716.

[10]
Fu Y W, Horton R, Heitman J. 2021. Estimation of soil water retention curves from soil bulk electrical conductivity and water content measurements. Soil and Tillage Research, 209: 104948, doi: 10.1016/j.still.2021.104948.

[11]
Gargiulo L, Mele G, Terribile F. 2015. The role of rock fragments in crack and soil structure development: A laboratory experiment with a Vertisol. European Journal of Soil Science, 66(4): 757-766.

[12]
Gong Z T, Chen Z C, Zhang G L. 2003. World reference base for soil resources (WRB): Establishment and development. Soils, 35(4): 271-278. (in Chinese)

[13]
Gubiani P I, Fachi S M, de Jong van Lier Q, et al. 2023. Inverse estimation of hydraulic parameters of soils with rock fragments. Geoderma, 429: 116240, doi: 10.1016/j.geoderma.2022.116240.

[14]
Hlaváčiková H, Novák V, Šimůnek J. 2016. The effects of rock fragment shapes and positions on modeled hydraulic conductivities of stony soils. Geoderma, 281: 39-48.

[15]
Hou F, Cheng J H, Guan N. 2023. Influence of rock fragments on preferential flow in stony soils of karst graben basin, southwest China. Catena, 220: 106684, doi: 10.1016/j.catena.2022.106684.

[16]
Huang L, Bao W K, Hu H, et al. 2023. Rock fragment content alters spatiotemporal patterns of soil water content and temperature: Evidence from a field experiment. Geoderma, 438: 116613, doi: 10.1016/j.geoderma.2023.116613.

[17]
Ilek A, Kucza J, Witek W. 2019. Using undisturbed soil samples to study how rock fragments and soil macropores affect the hydraulic conductivity of forest stony soils: Some methodological aspects. Journal of Hydrology, 570: 132-140.

[18]
Jiang J, Liu D D, Fei Y H, et al. 2023. Combined effects of moss colonization and rock fragment coverage on sediment losses, flow hydraulics and surface microtopography of carbonate-derived laterite from karst mountainous lands. Catena, 229: 107202, doi: 10.1016/j.catena.2023.107202.

[19]
Ju X N, Gao L, She D L, et al. 2024. Impacts of the soil pore structure on infiltration characteristics at the profile scale in the red soil region. Soil and Tillage Research, 236: 105922, doi: 10.1016/j.still.2023.105922.

[20]
Khetdan C, Chittamart N, Tawornpruek S, et al. 2017. Influence of rock fragments on hydraulic properties of Ultisols in Ratchaburi Province, Thailand. Geoderma Regional, 10: 21-28.

[21]
Lai X M, Zhu Q, Castellano M J, et al. 2022. Soil rock fragments: Unquantified players in terrestrial carbon and nitrogen cycles. Geoderma, 406: 115530, doi: 10.1016/j.geoderma.2021.115530.

[22]
Leal J, Avila E A, Darghan A E, et al. 2023. Spatial modeling of infiltration and its relationship with surface coverage of rock fragments and porosity in soils of an andean micro-watershed in Tolima (Colombia). Geoderma Regional, 33: e00637, doi: 10.1016/j.geodrs.2023.e00637.

[23]
Liu W, Zhang X D, He F, et al. 2021. Open-air grape classification and its application in parcel-level risk assessment of late frost in the eastern Helan Mountains. ISPRS Journal of Photogrammetry and Remote Sensing, 174: 132-150.

[24]
Lv W C, Qiu Y, Xie Z K, et al. 2019. Gravel mulching effects on soil physicochemical properties and microbial community composition in the Loess Plateau, northwestern China. European Journal of Soil Biology, 94: 103115, doi: 10.1016/j.ejsobi.2019.103115.

[25]
Ma D H, Shao M A. 2008. Simulating infiltration into stony soils with a dual-porosity model. European Journal of Soil Science, 59(5): 950-959.

[26]
Ma D H, Shao M A, Zhang J B, et al. 2010. Validation of an analytical method for determining soil hydraulic properties of stony soils using experimental data. Geoderma, 159(3-4): 262-269.

[27]
Ma D H, Zhang J B, Lai J B, et al. 2016. An improved method for determining Brooks-Corey model parameters from horizontal absorption. Geoderma, 263: 122-131.

[28]
Mualem Y. 1976. A new model for predicting the hydraulic conductivity of unsaturated porous media. Water Resources Research, 12(3): 513-522.

[29]
Novák V, Kňava K. 2012. The influence of stoniness and canopy properties on soil water content distribution: Simulation of water movement in forest stony soil. European Journal of Forest Research, 131(6): 1727-1735.

[30]
Philip J R. 1957. The theory of infiltration: 1. The infiltration equation and its solution. Soil Science, 83(5): 345-358.

[31]
Qiu Y, Lv W C, Wang X P, et al. 2020. Long-term effects of gravel mulching and straw mulching on soil physicochemical properties and bacterial and fungal community composition in the Loess Plateau of China. European Journal of Soil Biology, 98: 103188, doi: 10.1016/j.ejsobi.2020.103188.

[32]
Ruan X H, Bai Y R, Wang Y Q, et al. 2022. Soil moisture absorption characteristics and hydraulic parameters of gravel-sand mulched fields with different planting years. Journal of Northwest A&F University (Natural Science Edition), 50(5): 146-154. (in Chinese)

[33]
Sekucia F, Dlapa P, Kollár J, et al. 2020. Land-use impact on porosity and water retention of soils rich in rock fragments. Catena, 195: 104807, doi: 10.1016/j.catena.2020.104807.

[34]
Shao M A, Wang Q J, Horton R. 2000a. A simple infiltration method for estimating soil hydraulic properties of unsaturated soils I. Theoretical analysis. Acta Pedologica Sinica, 37(1): 1-8. (in Chinese)

[35]
Shao M A, Wang Q J, Horton R. 2000b. A simple infiltration method for estimating soil hydraulic properties of unsaturated soils Ⅱ. Experimental Results. Acta Pedologica Sinica, 37(2): 217-224. (in Chinese)

[36]
Shao W, Chen S J, Su Y, et al. 2023. Reduce uncertainty in soil hydrological modeling: A comparison of soil hydraulic parameters generated by random sampling and pedotransfer function. Journal of Hydrology, 623: 129740, doi: 10.1016/j.jhydrol.2023.129740.

[37]
Sheikhbaglou A, Khodaverdiloo H, Zeinalzadeh K, et al. 2021. Fitting process-dependence performance of the van Genuchten soil water retention model to simulate the soil water flow. Soil and Tillage Research, 209: 104952, doi: 10.1016/j.still.2021.104952.

[38]
Sheng J L, Huang T, Ye Z Y, et al. 2019. Evaluation of van Genuchten-Mualem model on the relative permeability for unsaturated flow in aperture-based fractures. Journal of Hydrology, 576: 315-324.

[39]
Su L J, Liu F L, Zhou B B, et al. 2022. Approximate analytical solutions for one-dimensional soil water movement equation with arbitrary initial conditions. Soil and Tillage Research, 218: 105314, doi: 10.1016/j.still.2021.105314.

[40]
Sun F H, Xiao B, Kidron G J. 2022. Towards the influences of three types of biocrusts on soil water in drylands: Insights from horizontal infiltration and soil water retention. Geoderma, 428: 116136, doi: 10.1016/j.geoderma.2022.116136.

[41]
Tao S Y, Zhang X, Feng R, et al. 2023. Retrieving soil moisture from grape growing areas using multi-feature and stacking-based ensemble learning modeling. Computers and Electronics in Agriculture, 204: 107537, doi: 10.1016/j.compag.2022.107537.

[42]
Tian Z C, Kool D, Ren T S, et al. 2019. Approaches for estimating unsaturated soil hydraulic conductivities at various bulk densities with the extended Mualem-van Genuchten model. Journal of Hydrology, 572: 719-731.

[43]
Villarreal R, Lozano L A, Melani E M, et al. 2019. Diffusivity and sorptivity determination at different soil water contents from horizontal infiltration. Geoderma, 338: 88-96.

[44]
Wang D, Niu J Z, Yang T, et al. 2024a. Soil water infiltration characteristics of reforested areas in the paleo-periglacial eastern Liaoning mountainous regions, China. Catena, 234: 107613, doi: 10.1016/j.catena.2023.107613.

[45]
Wang D J, Zhao W Z, Zhou H, et al. 2021. Mosaic desert pavement influences water infiltration and vegetation distribution on fluvial fan surfaces. Hydrological Processes, 35(9): e14373, doi: 10.1002/hyp.14373.

[46]
Wang Z W, Huang L M, Shao M A. 2024b. Development of pedotransfer functions for predicting hydraulic parameters of van Genuchten model by incorporating environmental variables on the Qinghai-Tibet Plateau. Soil and Tillage Research, 236: 105952, doi: 10.1016/j.still.2023.105952.

[47]
Wei C F, Liu S T, Li Q, et al. 2023. Diversity analysis of vineyards soil bacterial community in different planting years at eastern foot of Helan Mountain, Ningxia. Rhizosphere, 25: 100650, doi: 10.1016/j.rhisph.2022.100650.

[48]
Wu X L, Meng Z J, Dang X H, et al. 2021. Effects of rock fragments on the water infiltration and hydraulic conductivity in the soils of the desert steppes of Inner Mongolia, China. Soil and Water Research, 16(3): 151-163.

[49]
Yang J, Lyons T W, Zeng Z X, et al. 2019. Geochemical constraints on the origin of Neoproterozoic cap carbonate in the Helan Mountains, North China: Implications for mid-late Ediacaran glaciation? Precambrian Research, 331: 105361, doi: 10.1016/j.precamres.2019.105361.

[50]
Yang Y F, Wang Q J, Zhuang J. 2013. Estimating hydraulic parameters of stony soils on the basis of one-dimensional water absorption properties. Acta Agriculturae Scandinavica, Section B—Soil & Plant Science, 63(4): 304-313.

[51]
Zheng K, Cheng J, Xia J F, et al. 2021. Effects of soil bulk density and moisture content on the physico-mechanical properties of paddy soil in plough layer. Water, 13(16): 2290, doi: 10.3390/w13162290.

[52]
Zhu P Z, Zhang G H, Yang Y, et al. 2023. Infiltration properties affected by slope position on cropped hillslopes. Geoderma, 432: 116379, doi: 10.1016/j.geoderma.2023.116379.

Outlines

/