
Spatiotemporal patterns and drivers of cultivated land conversion in Inner Mongolia Autonomous Region, northern China
Received date: 2024-03-26
Revised date: 2024-07-24
Accepted date: 2024-08-10
Online published: 2025-08-13
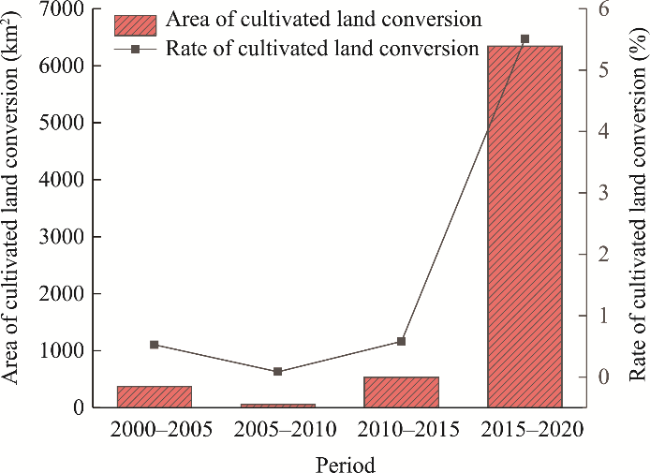
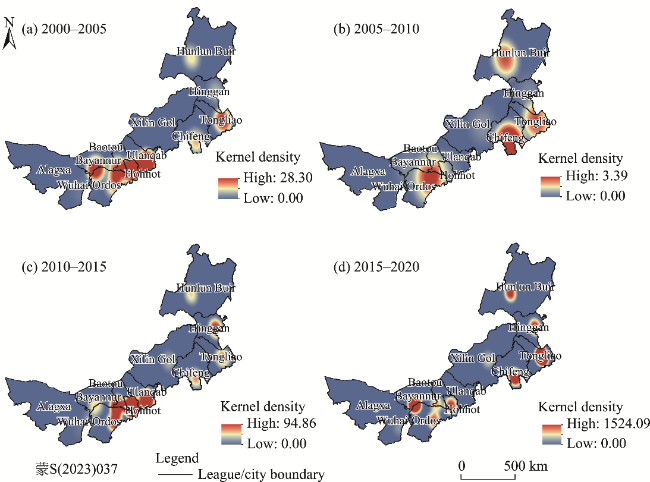
Protection and optimization of cultivated land resources are of great significance to national food security. Cultivated land conversion in northern China has increased in recent years due to the industrialization and urbanization of society. However, the assessment of cultivated land conversion in this area is insufficient, posing a potential risk to cultivated land resources. This study evaluated the evolution and spatiotemporal patterns of cultivated land conversion in Inner Mongolia Autonomous Region, China, and the driving factors to improve rational utilization and to protect cultivated land resources. The spatiotemporal patterns of cultivated land conversion in Inner Mongolia were analyzed using the cultivated land conversion index, kernel density analysis, a standard deviation ellipse model, and a geographic detector. Results showed that from 2000 to 2020, the trends in cultivated land conversion area and rate in Inner Mongolia exhibited fluctuating growth, with the total area of cultivated land conversion reaching 7307.59 km2 at a rate of 6.69%. Spatial distribution of cultivated land conversion was primarily concentrated in the Hetao Plain, Nengjiang Plain, Liaohe Plain, and the Hohhot-Baotou-Ordos urban agglomeration. Moreover, the standard deviational ellipse of cultivated land conversion in Inner Mongolia exhibited a directional southwest-northeast-southwest-northeast distribution, with the northeast-southwest direction identified as the main driving force of spatial change in cultivated land conversion. Meanwhile, cultivated land conversion exhibited an increase-decrease-increase change process, indicating that spatial distribution of cultivated land conversion in Inner Mongolia became gradually apparent within the study period. The geographic detector results further revealed that the main driving factors of cultivated land conversion in Inner Mongolia were the share of secondary and tertiary industries and per-unit area yield of grain, with explanatory rates of 57.00%, 55.00%, and 51.00%, respectively. Additionally, improved agricultural production efficiency and the coordinated development of population urbanization and industry resulted in cultivated land conversion. Collectively, the findings of this study indicated that, from 2000 to 2020, the cultivated land conversion in Inner Mongolia was significant and fluctuated in time, and had strong spatial heterogeneity. The primary drivers of these events included the effects of agriculture, population, and social economy.
Xijiri , ZHOU Ruiping , BAO Baorong , Burenjirigala . Spatiotemporal patterns and drivers of cultivated land conversion in Inner Mongolia Autonomous Region, northern China[J]. Journal of Arid Land, 2024 , 16(9) : 1197 -1213 . DOI: 10.1007/s40333-024-0026-y
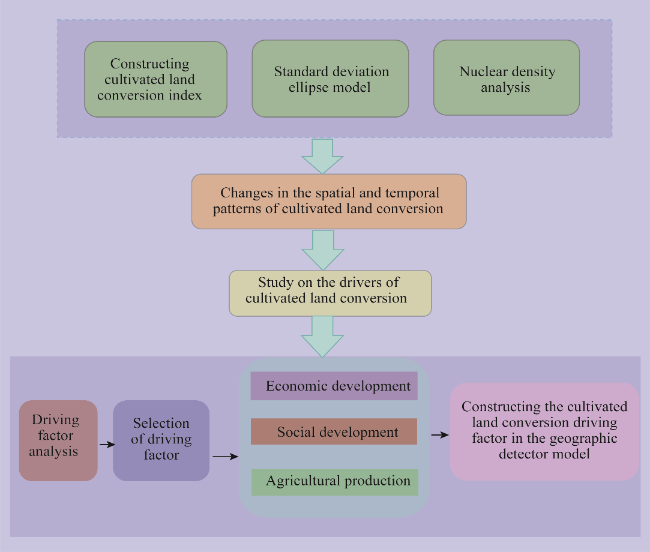
Fig. 1 Research framework of the study |
Fig. 2 Area and rate of cultivated land conversion during different periods in Inner Mongolia |
Table 1 Area of cultivated land conversion during different periods |
| Region | League/City | 2000-2005 | 2005-2010 | 2010-2015 | 2015-2020 | Total |
|---|---|---|---|---|---|---|
| Area (km2) | ||||||
| Hulun Buir | 21.39 | 9.84 | 30.32 | 554.50 | 616.05 | |
| Eastern region | Hinggan | 12.07 | 1.52 | 62.04 | 574.65 | 650.28 |
| Tongliao | 46.45 | 10.32 | 44.49 | 1746.42 | 1847.68 | |
| Xilin Gol | 0.00 | 2.00 | 16.70 | 190.17 | 208.87 | |
| Central region | Chifeng | 25.44 | 18.70 | 37.46 | 788.89 | 870.49 |
| Ulanqab | 67.82 | 0.00 | 0.00 | 0.00 | 67.82 | |
| Hohhot-Baotou-Ordos urban agglomeration | Hohhot | 68.56 | 2.10 | 145.40 | 517.30 | 733.36 |
| Baotou | 40.07 | 6.61 | 86.72 | 317.11 | 450.51 | |
| Ordos | 31.07 | 7.05 | 66.02 | 456.26 | 560.40 | |
| Bayannur | 53.98 | 1.91 | 30.12 | 1083.35 | 1169.36 | |
| Western region | Wuhai | 2.52 | 0.00 | 9.76 | 16.93 | 29.21 |
| Alagxa | 3.60 | 0.00 | 3.71 | 96.25 | 103.56 | |
| Total | 372.97 | 60.05 | 532.74 | 6341.83 | 7307.59 |
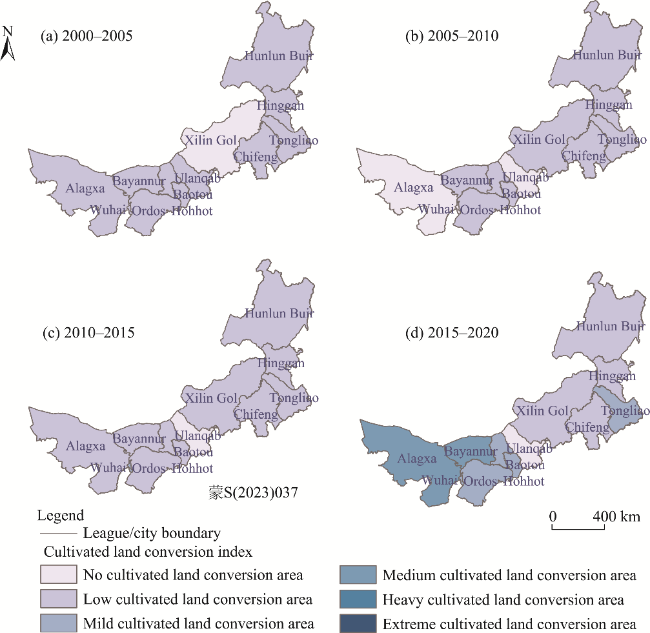
Fig. 3 Spatiotemporal variation of cultivated land conversion index in Inner Mongolia during 2000-2020. (a), 2000-2005; (b), 2005-2010; (c), 2010-2015; (d), 2015-2020. Note that the figures are based on the standard map (蒙 S(2023)037) of the Inner Mongolia Autonomous Region Department of Natural Resources (https://zrzy.nmg. gov.cn/bsfw/bzdt/nmgzzqbzdt/), and the standard map has not been modified. |
Fig. 4 Kernel density of cultivated land conversion in Inner Mongolia during 2000-2020. (a), 2000-2005; (b), 2005-2010; (c), 2010-2015; (d), 2015-2020. |
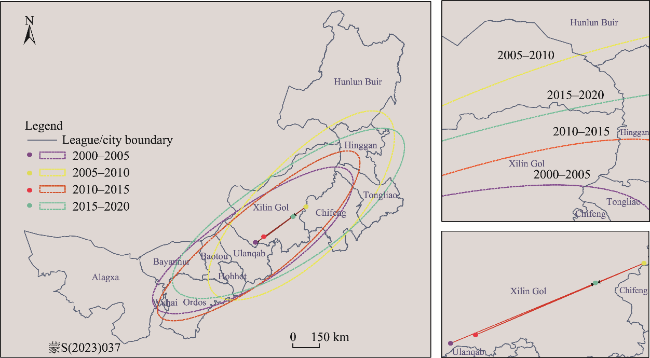
Fig. 5 Standard deviational ellipses and center of gravity migration trajectories of cultivated land conversion in Inner Mongolia from 2000 to 2020. The center of gravity migration arrows begin from 2005 to 2010 and shift from a northeastern to northwestern direction from 2005 to 2010, a northwestern to northeastern direction from 2010 to 2015, and a northwestern direction from 2015 to 2020. |
Table 2 Changes in elliptical parameters of standard deviation for cultivated land conversion from 2000 to 2020 |
| Period | X center | Y center | X-SD | Y-SD | Rotation (°) | Area (×106 km2) |
|---|---|---|---|---|---|---|
| 2000-2005 | 113°14′E | 42°11′N | 12,614.22 | 5199.70 | 68.89 | 43.18 |
| 2005-2010 | 116°54′E | 43°42′N | 13,023.46 | 5438.18 | 62.71 | 58.00 |
| 2010-2015 | 113°45′E | 42°22′N | 12,673.63 | 5229.40 | 64.81 | 42.76 |
| 2015-2020 | 115°57′E | 43°19′N | 12,919.34 | 5374.45 | 70.67 | 60.72 |
Note: SD means standard distance. |
Table 3 Factor detector results of cultivated land conversion |
| No. | Factor | q-value |
|---|---|---|
| X1 | GDP per capita | 0.07 |
| X2 | Share of the secondary sector in GDP | 0.57 |
| X3 | Share of the tertiary sector in GDP | 0.55 |
| X4 | Per capita income of farmers | 0.40 |
| X5 | General public budget revenue | 0.23 |
| X6 | Total output value of agriculture, forestry, animal, husbandry, and fishery | 0.43 |
| X7 | Arable land area | 0.36 |
| X8 | Yield of grain per unit area | 0.51 |
| X9 | Total grain yield | 0.15 |
| X10 | Level of urbanization | 0.21 |
| X11 | Population | 0.05 |
Note: GDP, global gross domestic product. |
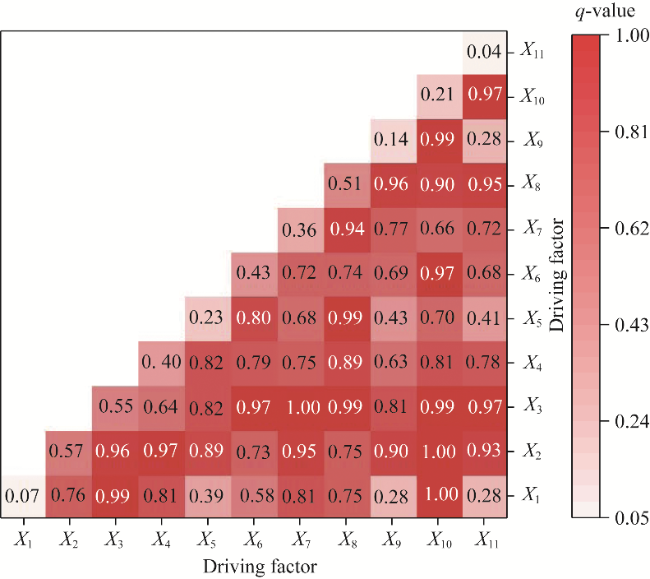
Fig. 6 Interactive detection of influencing factors of cultivated land conversion. The explanation of driving factors is shown in Table 3. |
| [1] |
Aodenggaowa. 2008. Study on the change process of cultivated land resources and food production security in Inner Mongolia. Chinese Journal of Eco-Agriculture, 16(4): 1000-1004. (in Chinese)
|
| [2] |
|
| [3] |
|
| [4] |
|
| [5] |
|
| [6] |
|
| [7] |
|
| [8] |
Gegentana,
|
| [9] |
|
| [10] |
|
| [11] |
|
| [12] |
|
| [13] |
|
| [14] |
|
| [15] |
|
| [16] |
|
| [17] |
|
| [18] |
|
| [19] |
|
| [20] |
|
| [21] |
|
| [22] |
|
| [23] |
|
| [24] |
|
| [25] |
|
| [26] |
|
| [27] |
|
| [28] |
|
| [29] |
|
| [30] |
|
| [31] |
|
| [32] |
|
| [33] |
|
| [34] |
|
| [35] |
|
| [36] |
|
| [37] |
|
| [38] |
|
| [39] |
|
| [40] |
|
| [41] |
|
| [42] |
|
| [43] |
|
| [44] |
|
| [45] |
|
| [46] |
|
| [47] |
|
| [48] |
|
| [49] |
|
| [50] |
|
| [51] |
|
| [52] |
|
| [53] |
|
/
| 〈 |
|
〉 |