Research article

Impact of climate change and human activities on the spatiotemporal dynamics of surface water area in Gansu Province, China

  • LU Haitian 1 ,
  • ZHAO Ruifeng , 1, 2, * ,
  • ZHAO Liu 3 ,
  • LIU Jiaxin 4 ,
  • LYU Binyang 5 ,
  • YANG Xinyue 6
Expand
  • 1College of Geography and Environmental Science, Northwest Normal University, Lanzhou 730070, China
  • 2Key Laboratory of Resource Environment and Sustainable Development of Oasis, Gansu Province, Lanzhou 730070, China
  • 3School of Geography, Planning and Spatial Sciences, University of Tasmania, Hobart TAS 7005, Australia
  • 4School of Chinese Language and Literature, Xi'an International Studies University, Xi'an 710128, China
  • 5Department of Mechanics and Aerospace Engineering, Southern University of Science and Technology, Shenzhen 518055, China
  • 6School of Design and Built Environment, Curtin University, Perth 6102, Australia
*ZHAO Ruifeng (E-mail: )

Received date: 2024-03-01

  Revised date: 2024-05-09

  Accepted date: 2024-05-11

  Online published: 2025-08-13

Abstract

Understanding the dynamics of surface water area and their drivers is crucial for human survival and ecosystem stability in inland arid and semi-arid areas. This study took Gansu Province, China, a typical area with complex terrain and variable climate, as the research subject. Based on Google Earth Engine, we used Landsat data and the Open-surface Water Detection Method with Enhanced Impurity Control method to monitor the spatiotemporal dynamics of surface water area in Gansu Province from 1985 to 2022, and quantitatively analyzed the main causes of regional differences in surface water area. The findings revealed that surface water area in Gansu Province expanded by 406.88 km2 from 1985 to 2022. Seasonal surface water area exhibited significant fluctuations, while permanent surface water area showed a steady increase. Notably, terrestrial water storage exhibited a trend of first decreasing and then increasing, correlated with the dynamics of surface water area. Climate change and human activities jointly affected surface hydrological processes, with the impact of climate change being slightly higher than that of human activities. Spatially, climate change affected the 'source' of surface water to a greater extent, while human activities tended to affect the 'destination' of surface water. Challenges of surface water resources faced by inland arid and semi-arid areas like Gansu Province are multifaceted. Therefore, we summarized the surface hydrology patterns typical in inland arid and semi-arid areas and tailored surface water 'supply-demand' balance strategies. The study not only sheds light on the dynamics of surface water area in Gansu Province, but also offers valuable insights for ecological protection and surface water resource management in inland arid and semi-arid areas facing water scarcity.

Cite this article

LU Haitian , ZHAO Ruifeng , ZHAO Liu , LIU Jiaxin , LYU Binyang , YANG Xinyue . Impact of climate change and human activities on the spatiotemporal dynamics of surface water area in Gansu Province, China[J]. Journal of Arid Land, 2024 , 16(6) : 798 -815 . DOI: 10.1007/s40333-024-0078-z

1 Introduction

Water resources are integral to the global water cycle, encompassing surface water, groundwater, and others (Getirana et al., 2017). Surface water resources are easily accessible and crucial for the survival of both natural environments and human societies (Rodell et al., 2018; Yao et al., 2023), and are fundamental for socio-economic development, including agriculture and industry, as well as for maintaining ecosystem functions on various scales (Hall et al., 2014). In inland arid and semi-arid areas with scarce water resources, the importance of surface water resources has become increasingly prominent, and surface water resources are also a critical constraint on development and ecological stability (Shan et al., 2022). In the context of global warming, large-scale reduction in surface water has become an increasingly common phenomenon. The inherent water cycle balance has been severely disturbed and destroyed in inland arid and semi-arid areas (Wang et al., 2018a), leading to regional water shortages, ecological degradation, and extreme disaster occurrences, and ultimately posing constant threats to ecosystems and human societies (Palmer et al., 2015). Therefore, understanding the surface water dynamics and their driving factors is vital for environmental protection, climate change response, water resource management, and socio-economic development in these areas (Chung et al., 2021).
Currently, researchers have assessed the dynamics of surface water area (SWA) by monitoring water pixels through hydrological remote sensing (Wang et al., 2020; Gu et al., 2021). Various remote sensing satellites have been utilized for surface water monitoring (Gleason and Durand, 2020), but there are differences between remote sensing images. Some images have insufficient detail to identify small surface water bodies due to their low spatial resolution of hundreds of meters. Another part of the images with high spatial resolution is inadequate for long-term change research due to its short duration and limited temporal coverage (DeVries et al., 2020; Filippucci et al., 2022). Consequently, Landsat data with fine spatial resolution (30 m) and extensive service history (since 1985) have emerged as the most suitable for hydrological remote sensing technology. For example, the widely recognized and used global surface water dataset by the academic community is derived from Landsat imagery (Pekel et al., 2016). Modern techniques in remote sensing, cloud computing, and geographical big data have become predominant in monitoring regional water resource dynamics (Gorelick et al., 2017). Additionally, studies on the dynamics of terrestrial water storage (TWS) using the Gravity Recovery and Climate Experiment (GRACE) satellites play a vital role in understanding global water cycle dynamics, representing the most important tool for gaining insights into TWS (Scanlon et al., 2016).
Arid and semi-arid areas are widely distributed in the world and play a pivotal role in the global terrestrial water cycle and the evolution of freshwater (Yu et al., 2019). If no measures are taken, global arid, and semi-arid areas are increasingly at risk of desertification due to climate warming, drought intensification, and population growth, facing escalating threats of land degradation and regional poverty (Huang et al., 2016; Guo et al., 2022; Shan et al., 2022). Gansu Province is located in the core area of arid and semi-arid areas of Northwest China and at the eastern edge of the Tibetan Plateau (Li et al., 2015). The complex climate conditions make it one of the most sensitive regions to climate change in China, and this area is the cornerstone of the national ecological security barrier known as the 'two screens and three belts' (Kou et al., 2023; Song and Song, 2023). Historically, Gansu Province has been a cradle of Chinese civilization and a vital part of the ancient Silk Road (Li et al., 2016; Ren et al., 2021). In recent years, Gansu Province has developed into a strategic hub for China's "One Belt, One Road" initiative, which highlighted its significant geographic and cultural importance (Zhang et al., 2019). However, the increasing frequencies and duration of droughts globally pose serious challenges to water availability in Gansu Province, threatening ecological security and stability of Northwest China (Tao et al., 2020). Surface water dynamics in complex regions like Gansu Province are expected to be multifaceted, and they are likely to vary significantly across subareas due to diverse environmental, climatic, and human factors. Research on surface water with long-term monitoring exceeding 30 a in Gansu Province remains limited. Moreover, current studies primarily focus on the change trends of SWA at different scales in China (Wang et al., 2020; Gu et al., 2021), and do not address the regional differences in typical areas with complex geography like Gansu Province.
Given this context, this study aims to: (1) analyze the spatiotemporal dynamics of SWA in Gansu Province from 1985 to 2022; (2) reveal the impact of climate change and human activities on SWA dynamics and analyze the differences and interactions between different factors that affect SWA dynamics; and (3) discuss the relationship between SWA and TWS and summarize the laws of regional surface hydrological processes. The findings can provide important information for regional surface water resource management and enhance our understanding of the impact of climate change and human activities on surface water in inland arid and semi-arid areas.

2 Materials and methods

2.1 Study area

Gansu Province is located in Northwest China, with a geographical extent between 32°59′- 42°76′N and 92°34′-108°71′E, covering an area of approximately 4.36×10⁵ km2 (Fig. 1). Its terrain descends from southwest to northeast, with elevations ranging from 587 to 5478 m, resembling a long, narrow 'dumbbell' shape. It is one of the provinces with the most comprehensive landform types in China (Song and Song, 2023). The landform types include mountains, hills, plateaus, plains, river valleys, deserts, and the Gobi. Gansu Province experiences a variety of climate types from subtropical and temperate monsoons to continental and plateau alpine climate, yet it has a predominantly dry climate, with over 75% of the region being arid and semi-arid areas (Kou et al., 2023). In 2020, the per capita water resource in Gansu Province was only 1642 m3, below the national average, highlighting its ecological fragility and challenges to sustainable development (An et al., 2020).
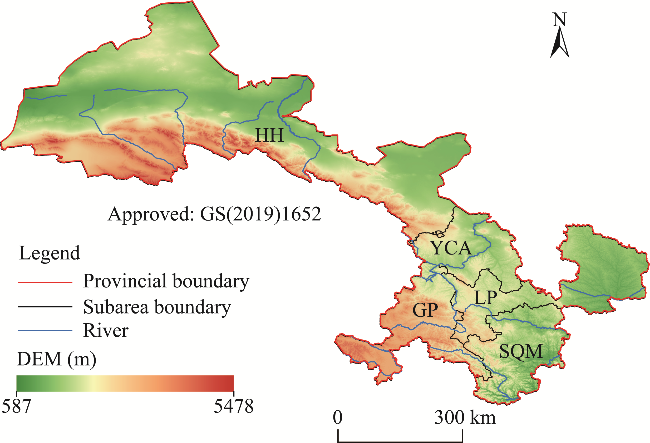
Fig. 1 Overview of the Gansu Province and its five ecological functional subareas based on digital elevation model (DEM) data. DEM data were obtained from National Aeronautics and Space Administration (NASA) Shuttle Radar Topography Mission (SRTM) (https://cmr.earthdata.nasa.gov/search/). GP, Gannan Plateau; HH, Hexi Hinterland; YCA, Yellow River Central Area; SQM, southern Qinba Mountains; LP, Loess Plateau. Note that this map is based on the standard map (GS(2019)1652) of the Map Service System (http://bzdt.ch.mnr. gov.cn/) marked by the Ministry of Natural Resources of the People's Republic of China, and the base map has not been modified.
This study categorized Gansu Province into five ecological functional subareas (Fig. 1) according to the Gansu Province Development Strategic Positioning and Main Functional Area Planning (http://www.gansu.gov.cn). The Gannan Plateau (GP) is a key pastoral area at the intersection of the Tibetan Plateau and Loess Plateau. The Hexi Hinterland (HH) has developed extensive agricultural irrigation systems, fostering efficient oasis farming. The Yellow River Central Area (YCA) forms the province's economic heartland, concentrating industry and population. Forestry and agriculture dominate in the southern Qinba Mountains (SQM). Lastly, the Loess Plateau (LP) is renowned for its dry farming and water conservation practices.

2.2 Data

2.2.1 Landsat data

In this study, we utilized Landsat 5 TM (20,739 images), Landsat 7 ETM+ (18,245 images), and Landsat 8 OLI (10,578 images) Tier 1 surface reflectance data obtained from Google Earth Engine to monitor SWA dynamics in Gansu Province. This dataset spans from 1 January 1985 to 31 December 2022. Quality variations in each Landsat image, as well as the presence of clouds and cloud shadows, can introduce significant errors in the inversion process (Cook et al., 2014). This study filtered out images with more than 5% of cloud cover to reduce interference. After atmospheric and radiation corrections, we obtained 14,232 high-quality images for further analysis. The spatial distribution and frequency of Landsat tiles varied considerably, and the number of observations ranged from as few as 70 times to as many as 1201 times for individual pixels, which is sufficient to ensure that image differences will not affect the research results (Foga et al., 2017).

2.2.2 TWS data

To better understand the SWA dynamics in Gansu Province, we examined the relationship between change trends of SWA and TWS. We used terrestrial water storage anomaly (TWSA) data from GRACE satellites to focus on the change trends of regional TWS from 2002 to 2022. GRACE data have gained wide acceptance and use in various hydrological studies (Zou et al., 2018; Huang et al., 2021b). This study used TWSA data in the GRCTellus JPL-Mascons RL06M.MSCNv02 dataset (https://grace.jpl.nasa.gov/), with a spatial resolution of 0.25°×0.25° (Scanlon et al., 2016). Before analyzing the data, we performed necessary corrections and adjustments, which helped minimize errors common in hydrological applications (Wiese et al., 2016).

2.2.3 Environmental and socio-economic data

This study investigated the impact of climate change and human activities on SWA dynamics using environmental and socio-economic factors, respectively. Environmental factors included precipitation (mm), land surface temperature (LST; °C), evapotranspiration (kg/(m2•8 d)), and fractional vegetation cover (FVC; %). Among them, FVC was calculated using the normalized difference vegetation index (NDVI) data in the MYD13Q1.006 Aqua Vegetation Indices 16-Day Global 250m dataset. Socio-economic factors included population (persons/100 m2), cropland (km2), impervious surface (km2), and gross domestic product (GDP; 106 USD). Table 1 and Figure S1 show the detailed description about these factors and their spatial distribution in Gansu Province, respectively.
Table 1 Detailed description of environmental and socio-economic factors used in this study
Factor Resolution Time span Dataset Reference
Precipitation 0.05° 1990-2022 Climate Hazards Group InfraRed Precipitation with Station data Funk et al. (2015);
Huang et al. (2021b)
LST 1 km 2000-2022 MOD11A2.061 Terra Land Surface Temperature and Emissivity 8-Day Global 1km Sulla-Menashe et al. (2019)
Evapotranspiration 500 m 2001-2022 MOD16A2 Version 6.1 Evapotranspiration/ Latent Heat Flux product Huete et al. (1997)
FVC 250 m 2003-2022 The MYD13Q1.006 Aqua Vegetation Indices 16-Day Global 250m Huete et al. (1997)
Population 100 m 2000-2020 WorldPop Global Project Population Data Gaughan et al. (2013)
Cropland 30 m 1990-2020 CLCD Yang and Huang (2021)
Impervious surface 30 m 1990-2019 Tsinghua FROM-GLC Year of Change to Impervious Surface dataset Gong et al. (2020)
GDP 1 km 1992-2019 GRIDDED_EC-GDP Chen et al. (2022)

Note: LST, land surface temperature; FVC, fractional vegetation cover; GDP, gross domestic product; CLCD, Landsat-derived annual China land cover dataset; FROM-GLC, Finer Resolution Observation and Monitoring-Global Land Cover; GRIDDED_EC-GDP, global 1 km×1 km gridded revised real GPD and electricity consumption during 1992-2019 based on calibrated nighttime light data.

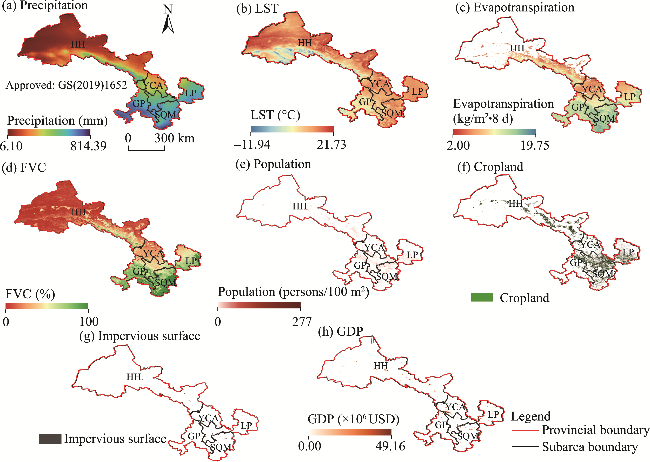
Fig. S1 Spatial distribution of each driving factor in Gansu Province during 1985-2022. (a), precipitation; (b), land surface temperature (LST); (c), evapotranspiration; (d), fractional vegetation cover (FVC); (e), population; (f), cropland; (g), impervious surface; (h), GDP. GP, Gannan Plateau; HH, Hexi Hinterland; YCA, Yellow River Central Area; SQM, southern Qinba Mountains; LP, Loess Plateau. Note that the maps are based on the standard map (GS(2019)1652) of the Map Service System (http://bzdt.ch.mnr.gov.cn/) marked by the Ministry of Natural Resources of the People's Republic of China, and the base map has not been modified.

2.3 Methods

2.3.1 Trend analysis

We initially employed a linear regression model to analyze the change trends of SWA from 1985 to 2022 (Wang et al., 2020). To ensure precision in our analysis, we calculated error intervals for SWA using the area estimation adjustment error method (Olofsson et al., 2014). The confidence interval can reflect the credibility of SWA estimates using the error intervals. Furthermore, we applied the Mann-Kendall mutation test method (Güçlü, 2020) and the Sen's slope trend analysis method (Zou et al., 2018) to provide a comprehensive analysis on the change trends of SWA.

2.3.2 Geographical detector

The basic premise of geographical detector is the spatial correlation between an independent variable and the dependent variable, indicating a causal impact (Wang et al., 2016). In our study, factor detector and interaction detector were used to quantitatively evaluate the impact of environmental and socio-economic factors as well as their interactions on SWA dynamics. For robustness, we discretized and classified all the data based on q-value maximization principles (Wang et al., 2010), and generated 2,155,482 grid cells for analysis.

2.3.3 Surface water detection rules

In this study, we utilized the Open-surface Water Detection Method with Enhanced Impurity Control (OWDM-EIC) method to monitor SWA (Lu et al., 2023). The flow chart is shown in Figure 2. The OWDM-EIC is suitable not only for high-altitude mountainous areas with complex terrain but also for vast and desolate arid and semi-arid areas, such as the diverse terrains in Gansu Province. This method is an enhancement of the water detection rules proposed by Zou et al. (2018), emphasizing the control of same-wave heterogeneous noise points. In this method, normalized difference water index (NDWI), modified normalized difference water index (mNDWI), NDVI, and enhanced vegetation index (EVI) were used to determine whether a pixel is a water pixel. A pixel qualifies as a water pixel if it meets the following criteria: NDWI> −0.1, mNDWI>0.1, EVI<0.1, and mNDWI>NDVI (or mNDWI>EVI). The combined use of water and vegetable indices and thresholds effectively reduces the error caused by mixed pixels and eliminates shadows from mountains and buildings (McFeeters, 1996; Santoro et al., 2015; Wang et al., 2023b). At the same time, OWDM-EIC also integrates digital elevation model (DEM) data (https://cmr.earthdata.nasa.gov/search/), impervious surface data (https://data-starcloud.pcl.ac.cn/), land use data (https://zenodo.org/records/4417810), etc., to ensure that impurity noise points that are easily ignored by the traditional exponential threshold method can be further eliminated. The index calculation formulas included in the OWDM-EIC are as follows:
NDVI = ρ NIR ρ red ρ NIR ρ red
EVI = 2.5 × ρ NIR ρ red 1 + ρ NIR + 6 × ρ red 7.5 × ρ blue
NDWI = ρ green ρ NIR ρ green + ρ NIR
mNDWI = ρ green ρ SWIR ρ green + ρ SWIR
where ρred, ρNIR, ρblue, ρgreen, and ρSWIR are the surface reflectance values of red, near infrared, blue, green, and short-wave infrared bands, respectively.
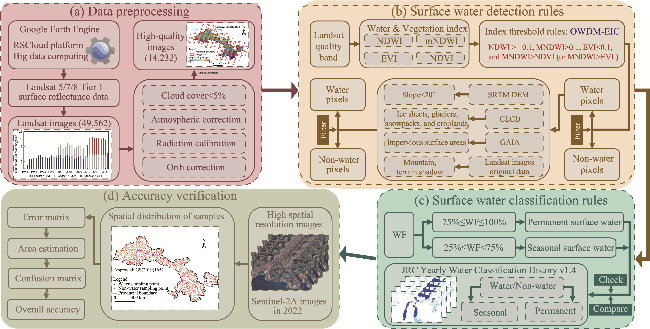
Fig. 2 Schematic diagram of Open-surface Water Detection Method with Enhanced Impurity Control (OWDM-EIC) method. (a), data preprocessing; (b), surface water detection rules; (c), surface water classification rules; (d), accuracy verification. NDWI, normalized difference water index; mNDWI, modified normalized difference water index; NDVI, normalized difference vegetation index; EVI, enhanced vegetation index; GAIA, annual maps of global artificial impervious area; CLCD, Landsat-derived annual China land cover dataset; WF, water frequency; JRC, Joint Research Centre.
To calculate the water frequency (WF) of each pixel, we counted the number of pixel observations based on Landsat data in Gansu Province from 1985 to 2022, and utilized the surface water detection result of each pixel by OWDM-EIC. The calculation formula of WF is as follows (Zou et al., 2018):
F ( y ) = 1 N y i N y ω y , i × 100 %
where F(y) is the WF of the pixel in the specified year y (%); Ny is the total number of pixel observations of the pixel in the specified year y; and ωy,i is the result of a certain observation i of the pixel. We set 4 thresholds of WF (0%, 25%, 75%, and 100%) to distinguish surface water types. Water pixels with WF of 75%-100% were considered permanent surface water, and water pixels with WF of 25%-75% were defined as seasonal surface water (Rokni et al., 2015). Classifying water pixels with WF≥75% as permanent surface water can solve the problem of missed judgments caused by factors such as uneven distribution of Landsat data and cloud cover, which makes the identification of permanent surface water based on OWDM-EIC method more accurate. At the same time, excluding pixels with WF<25% can effectively reduce impurity noise that is difficult to remove, further improving the accuracy of seasonal surface water determination. Figure S2 shows the spatial distribution of WF in Gansu Province in 2022. Permanent surface water bodies, exemplified by the Liujiaxia Reservoir, displayed consistent water presence (with WF values close to 100%) over 38 a (Fig. S2d). Seasonal surface water bodies, including parts of the Yellow River, indicated frequent fluctuations and channel migrations (Fig. S2e).
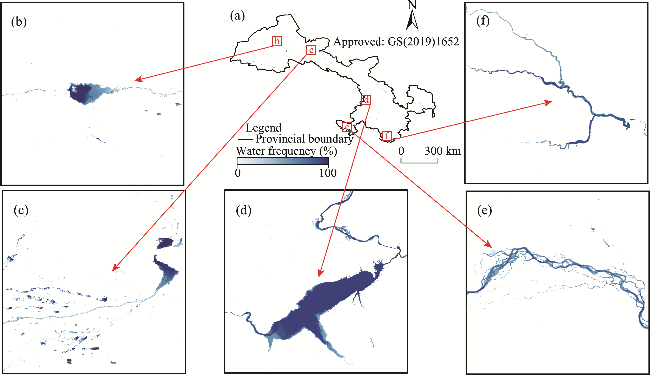
Fig. S2 Spatial distribution of water frequency in the whole (a) and partial areas (b-f) of Gansu Province in 2022. Note that this map is based on the standard map (GS(2019)1652) of the Map Service System (http://bzdt.ch. mnr.gov.cn/) marked by the Ministry of Natural Resources of the People's Republic of China, and the base map has not been modified.
This study used Sentinel-2A images in 2022 and the Joint Research Centre (JRC) Yearly Water Classification History v1.4 dataset (Pekel et al., 2016) to comprehensively evaluate the surface water detection accuracy of OWDM-EIC in 2022. We selected 2000 water samples from the Sentinel-2A images, and randomly generated 15,000 non-water samples using manual visualization and stratified random sampling. In addition, we optimized sample quality according to the method of Olofsson et al. (2014). Finally, we determined 15,000 valid samples (1940 water samples and 13,060 non-water samples). Samples and JRC dataset in 2022 were used to verify the surface water detection results in Gansu Province in 2022 by OWDM-EIC. The results showed that the overall accuracy of OWDM-EIC evaluated with samples from the Sentinel-2A images reached 99.27% (Table 2), and the overall accuracy compared with the JRC dataset reached 99.09% (Table 3), confirming that the surface water identified from the Landsat data had high reliability and can be used for further analysis. Therefore, we used OWDM-EIC method to successfully identify the annual surface water in Gansu Province from 1985 to 2022.
Table 2 Confusion matrix for accuracy assessment of OWDM-EIC using samples from the Sentinel-2A images in 2022
Sample type Number of ground reference samples Overall accuracy (%)
Water Non-water Total
Water 1855 85 1940 99.27
Non-water 94 12,966 13,060

Note: OWDM-EIC, Open-surface Water Detection Method with Enhanced Impurity Control.

Table 3 Confusion matrix for accuracy assessment of OWDM-EIC using the JRC dataset in 2022
Sample type Number of ground reference samples Overall accuracy (%)
Water Non-water
Water 1,367,428 949,331 99.09
Non-water 1,276,405 2,301,846,362

Note: JRC, Joint Research Centre.

3 Results

3.1 Spatiotemporal dynamics of SWA and TWS

From 1985 to 2022, SWA in Gansu Province grew steadily, from 1076.99 to 1483.87 km2, averaging an annual increase of 10.71 km2 (Fig. 3). Notable spatial variations of SWA were identified in Gansu Province. SWA in HH was largest, constituting 50.69%-58.70% of the total SWA in Gansu Province from 1985 to 2022. Annually, 62.90% of the seasonal surface water and 43.89% of the permanent surface water in Gansu Province were distributed in HH. The GP followed, contributing approximately 23.72%-28.61% of the total SWA. LP had the least SWA (slightly less than SQM), accounting for only 2.51%-5.74% of the total SWA, with its seasonal surface water area (SSWA) and permanent surface water area (PSWA) constituting 4.40% and 3.13% of the total SWA in Gansu Province, respectively. Although HH had a wide distribution of surface water, its SWA constituted only 0.21%-0.34% of the total area of HH, lower than those of GP (0.64%-0.87%) and YCA (0.28%-0.47%). Conversely, LP displayed the sparsest surface water, comprising only 0.05%-0.11% of the total area of LP.
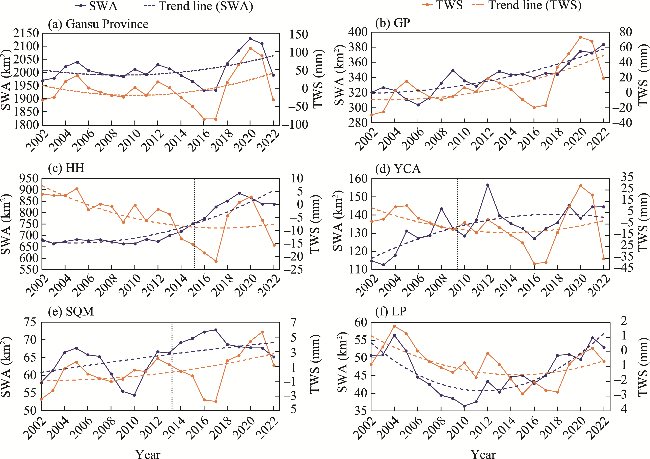
Fig. 3 Trends in surface water area (SWA) and terrestrial water storage (TWS) in Gansu Province and its five ecological functional subareas from 1985 to 2022. (a), Gansu Province; (b), GP; (c), HH; (d), YCA; (e), SQM; (f), LP. The black dashed line represents the time when the mutation occurs.
From 2002 to 2022, TWS in Gansu Province showed a trend of first fluctuating downward, and then fluctuating upward (Fig. 3). The amplitude of its fluctuation ranged from -35 to 110 mm, and TWS hit its lowest point between 2016 and 2017. The dynamics of TWS in each subarea had obvious spatial differences. TWS showed a volatile downward trend in HH, YCA, and LP, while it exhibited a volatile upward trend in GP and SQM. GP was the subarea with the largest change amplitude in TWS, which fluctuated between -30 and 75 mm. TWS in GP generally showed an upward trend of fluctuation, with the rate of change first slowing down and then getting fast. TWS in SQM showed a similar change trend, and its amplitude fluctuated between -4 and 6 mm. The change of TWS in SQM was smaller, only higher than that in LP. The changes of TWS in HH and YCA were similar, which showed a relatively stable downward trend between 2002 and 2017, and rebounded rapidly after 2017; therefore, although TWS showed a downward trend, its rate of change gradually decreased and even rebounded. LP was the subarea with the smallest change in TWS, and its amplitude fluctuated between -3 and 2 mm, showing a sustained and stable downward trend similar to HH and YCA between 2004 and 2018.

3.2 Spatiotemporal dynamics of SSWA and PSWA

The average annual SSWA (703.49 km2) and PSWA (528.38 km2), constituting 57.11% and 42.89% of the total SWA in Gansu Province, respectively (Fig. 4). SSWA exhibited a significant increase trend, from 490.51 to 876.75 km2 (P<0.01; error interval=±124.20 km2), while PSWA showed a relatively stable trend, declining from 586.48 km2 in 1985 to 415.25 km2 in 1990, with a declining rate of 28.54 km2/a (P<0.01), then increasing to 607.13 km2 in 2022 (error interval=±73.76 km2) (Fig. 4a).
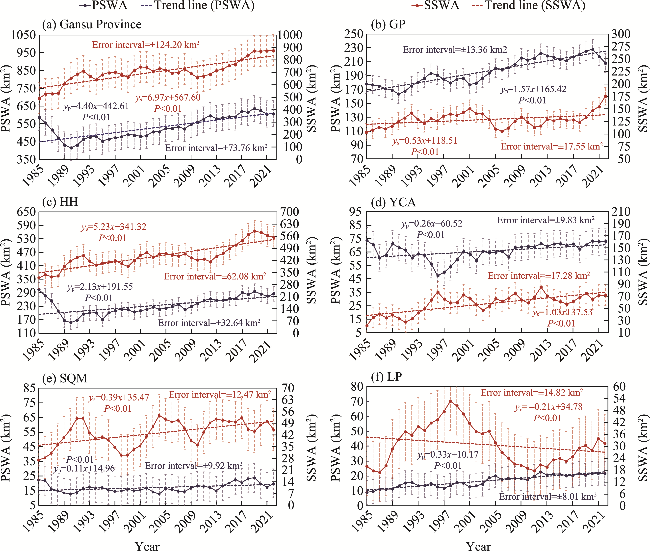
Fig. 4 Trends in seasonal surface water area (SSWA) and permanent surface water area (PSWA) in Gansu Province and its five ecological functional subareas from 1985 to 2022. (a), Gansu Province; (b), GP; (c), HH; (d), YCA; (e), SQM; (f), LP.
The temporal dynamics in SSWA and PSWA varied across the five subareas in Gansu Province (Fig. 4b-f). In GP and YCA, PSWA exceeded SSWA, opposite to the trend in HH, SQM, and LP where SSWA surpassed PSWA. This indicated different influences of surface water types on SWA changes in each subarea. GP and HH, contributing over 80.00% to the total SWA in Gansu Province, showed divergent trends: PSWA of GP increased from 1985 to 2022 (Fig. 4b), while HH experienced significant increase in SSWA (Fig. 4c). YCA and SQM, with similar SWA sizes, exhibited distinct trends. YCA saw increase in SSWA and PSWA, whereas in SQM, stable PSWA contrasted with sharply increasing SSWA (Fig. 4d and e). Notably, LP was unique, with its SSWA decreasing while PSWA growing steadily, rising from 9.03 km2 in 1985 to 21.63 km2 in 2022 (error interval=±8.01 km2) (Fig. 4f).
In 2022, all subareas of Gansu Province saw varying increases in SWA compared to the multi-year averages. HH experienced the largest increase of 161.29 km2, followed by GP (increase of 58.76 km2) and YCA (increase of 21.35 km2), while LP and SQM had the smallest increases of 5.56 and 5.04 km2, respectively (Fig. 3). Despite these overall significant changes (P<0.01), the rates of change differed considerably between surface water types (Fig. 4). In HH with the highest rate of change in SWA, SSWA increased faster than PSWA. In contrast, LP and SQM exhibited the slowest rates of change for SSWA and PSWA, respectively, showing distinct regional SWA dynamics.

3.3 Attribution analyses of SWA dynamics

3.3.1 Influence of each factor on SWA dynamics

This study utilized the factor detector in the geographical detector model to assess the impact of climate change and human activities on SWA dynamics, as depicted in Figure 5. We observed varying influences of environmental and socio-economic factors across different subareas. The impact of driving factors was particularly pronounced in HH and GP, followed by YCA and SQM. Precipitation in GP had a significant influence (q-value of 0.88), surpassing its impact in other subareas. In contrast, impervious surface had minimal effects on SWA dynamics in GP and SQM, with q-values of 0.29 and 0.30, respectively. Further analysis revealed that SWA dynamics were predominantly affected by environmental factors rather than socio-economic factors in GP and SQM (Fig. 5a and d). FVC was notably the most influential in SQM (q-value of 0.52),indicating its primary role in SWA dynamics. Conversely, in HH, YCA, and LP, SWA dynamics were more influenced by socio-economic factors, with cropland and population showing higher q-values in HH and LP, and impervious surface showing higher q-values in HH and YCA (Fig. 5b-e).
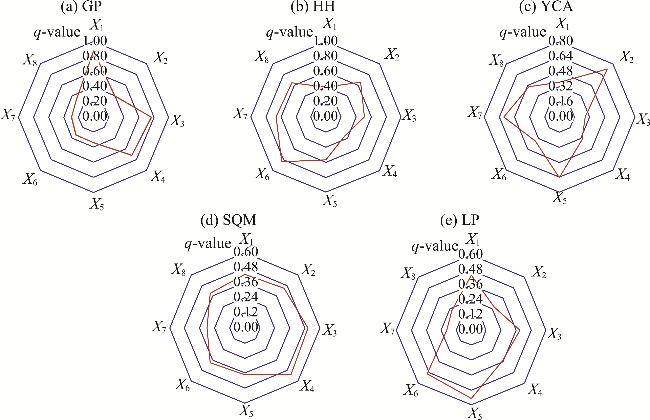
Fig. 5 Factor detector results (indicated by q-values) for various driving factors in each subarea. (a), GP; (b), HH; (c), YCA; (d), SQM; (e), LP. X1-X8 indicate precipitation, land surface temperature, evapotranspiration, fractional vegetation cover, population, cropland, impervious surface, and gross domestic product (GDP), respectively.

3.3.2 Influence of interactions between driving factors on SWA dynamics

We employed the interaction detector to assess how different driving factors jointly influenced the SWA dynamics. The findings showed varied interaction patterns across subareas (Fig. 6). In HH, interactions between factors were notable, with GP close behind. Key interactions in HH were found between cropland and GDP (q-value of 0.91) as well as between population and cropland (q-value of 0.90), highlighting the significant role of cropland on SWA dynamics in HH. In GP, the strongest interaction was observed between precipitation and evapotranspiration (q-value of 0.94), followed by precipitation and FVC (q-value of 0.93), and evapotranspiration and FVC (q-value of 0.92). In contrast, LP showed weaker interactions among driving factors, particularly for environmental factors, due to its limited surface water, with q-values of 0.29 and 0.30, respectively (Fig. 6e).
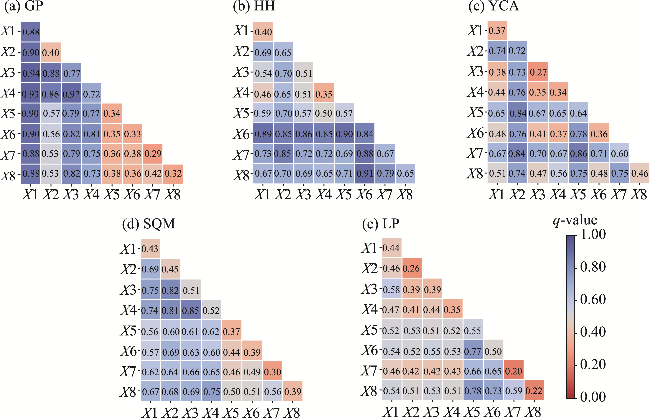
Fig. 6 Interaction detection results (indicated by q-values) for various driving factors in each subarea. (a), GP; (b), HH; (c), YCA; (d), SQM; (e), LP.
Overall, in central and northern subareas like HH, YCA, and LP, socio-economic factors had a stronger impact than environmental factors. Conversely, in southern subareas such as GP and LP, environmental factors were more influential. In GP, environmental factors contributed 68.15% to SWA dynamics. In LP, the influence was more evenly split between environmental factors (49.90%) and socio-economic factors (50.10%).

4 Discussion

4.1 Spatiotemporal dynamics of SWA and TWS as well as their correlations

Surface water is one of the main components of TWS (Tao et al., 2020), and SWA dynamics have an important impact on regional TWS and even water resources (Zou et al., 2018). By investigating the spatiotemporal dynamics of SWA and TWS in five subareas of Gansu Province, we found that SWA and TWS in GP and LP showed a marked alignment, with the fluctuations of TWS lagging behind SWA (Fig. 3b and f), while HH, YCA, and SQM displayed inconsistent trends (Fig. 3c-e). In Gansu Province, GP and LP represented the extremes insurface water distribution, with GP being the richest and LP the poorest in SWA. Both subareas showed parallel SWA and TWS changes, but for different reasons. GP had rich surface water and precipitation, and the correlation between SWA and TWS was mainly driven by environmental factors, particularly climate change. However, after 2014, human activities seemed to influence this trend (Fig. 3b). Conversely, LP, with its lower precipitation, higher LST, and significant human impact, displayed minimal SWA and TWS variations due to its severe water scarcity. The consistency in their variations was evident despite a general decline of TWS in LP, likely linked to groundwater overexploitation (Li and Chen, 2020). HH and YCA experienced similar impact of climate change and human activities on their SWA dynamics, reflected in the correlations between SWA and TWS (Fig. 3c and d). HH saw a significant shift in SWA dynamics in 2015, with a general decline of TWS from 2002 to 2022, likely due to increased water use in agriculture (Cardinale et al., 2012). Despite increasing SWA in HH, surface water resource management remains challenging (Li et al., 2020). In contrast, the highly urbanized and economically vibrant YCA showed that TWS fluctuations were mainly due to urban and industrial demands. A notable increase in SWA since 2009 suggested effective management and strategies in place (Wang et al., 2018b; Al-Jawad et al., 2019).

4.2 Comprehensive impact of climate change and human activities on SWA dynamics

Our detailed analysis elucidated the intertwined effect of climate change and human activities on SWA in Gansu Province. Precipitation, a key factor in surface water replenishment, exhibited a notable increase in volatility between 2000 and 2022, mirroring the trend in SWA (Fig. 7a). In the context of global warming, LST in Gansu Province experienced a slight but consistent fluctuation increase, with an average increase of approximately 0.22°C/a over the past 23 a (Fig. 7b). This increase in temperature influenced regional ecosystems and surface water resources by accelerating snowmelt and glacier melt, contributing to surface water replenishment (Wang et al., 2023a). To assess potential challenges in socio-economic development due to water shortage, we examined human society's water consumption in Gansu Province through data from the Gansu Provincial Department of Water Resources (https://slt.gansu.gov.cn/). Human society's water consumption in Gansu Province exhibited a declining trend from 2005 to 2020, decreasing from 1.21×10¹⁰ m3 in 2005 to 1.10×10¹⁰ m3 in 2020, at a rate of 6.74×10⁷ m3/a. This substantial reduction in consumption contributed to the stable increase in SWA (Fig. 7c) and positively impacted the recovery of TWS (Chen et al., 2015; Fig. 7d). Moreover, effective water resource management, including water-saving measures, water conservancy projects, and recycling, plays a crucial role in ensuring regional water security (Wang et al., 2018b; Huang et al., 2021b). Generally speaking, climate change primarily influenced the 'source' of surface water through alterations in precipitation and temperature, while human activities predominantly impacted the 'destination' of surface water through effective management of water consumption in production and daily life.
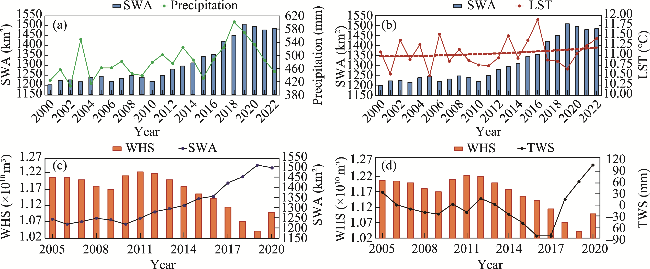
Fig. 7 Relationships between SWA and precipitation (a), SWA and LST (b), SWA and human society's water consumption (WHS) (c), and TWS and WHS (d)

4.3 Regional surface hydrological processes in Gansu Province

The focus of this study is on surface hydrological processes involving human activities, and the risks faced by regional surface water under the joint influence of climate change and human activities. In inland arid and semi-arid areas like Gansu Province, surface water resources are crucial, especially facing the pressure of urbanization and agricultural growth (Liang et al., 2023). The mismanagement of water resources impedes the development of scientific water use (Chen et al., 2018), highlighting the need for optimized water allocation in these areas. Surface water in Gansu Province originates mainly from its southwestern mountains, undergoing hydrological processes like evaporation, precipitation, snowmelt, and runoff (Fig. 8a). Limited human activities in these areas mean that environmental factors will be the primary drivers of SWA dynamics. Global warming contributes to increased surface and soil water through glacier and permafrost melt (Wang et al., 2018c; Wang et al., 2023a), which can explain the recent increase in SWA. Mountain water feeds rivers, creating oases in lower areas and transforming arid landscapes into habitable spaces (Xue et al., 2019). These oases are crucial for ecological balance, agriculture, and animal husbandry. While water-saving technologies and upstream recharge can mitigate surface water scarcity, challenges such as groundwater depletion and pollution from agricultural and urban water persist, impacting water quality and ecosystem health (Wang and Yang, 2016; Yin et al., 2022).
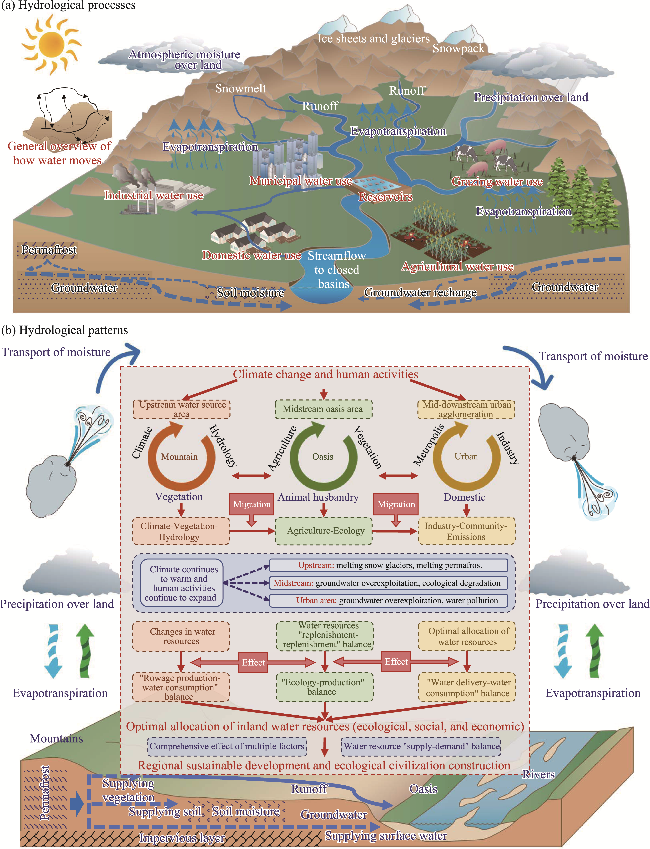
Fig. 8 Surface hydrological processes (a) and hydrological patterns (b) in inland arid and semi-arid areas
Surface hydrological patterns in each subarea of Gansu Province are different. We identified three primary hydrological patterns, each with unique challenges (Fig. 8b). The 'mountain' pattern in upstream areas like GP and SQM is largely influenced by environmental factors with minimal human impact, which constitutes an ecological pattern of 'climate-vegetation-hydrology' on a local scale. Global warming affects the water balance and breaks the balance of water production and consumption, which increases runoff to lower areas and impacts the overall surface water. The 'oasis' pattern in midstream areas like HH focuses on agriculture and ecological balance, which is not only an important place for human agricultural production, butalso an important barrier to ensure ecological security and stability in arid areas (Brottrager et al., 2023). However, emerging challenges, including groundwater overuse and ecological risks, stem from population and agricultural expansion (Amundson et al., 2015; Brottrager et al., 2023). Furthermore, this pattern highlights the importance of managing the balance between water supply and consumption, as evidenced by the effects of the Longyangxia Hydropower Station (Chang et al., 2017). This hydropower station was put into operation in the late 1980s. Its interception and storage of water caused PSWA to decline rapidly in HH during this period (Fig. 4c). In the 'urban' model, areas like YCA face water demand for industrial and urban needs, necessitating optimized water allocation for sustainable development (Amundson et al., 2015). LP, at the downstream end, experiences balanced effect of climate change and human activities, facing potential risks in water shortages despite some positive trends (Li et al., 2017).

4.4 Limitations and prospects

This study utilized remote sensing, particularly Landsat data, as the primary data for monitoring the SWA in Gansu Province. However, our study faces limitations, primarily associated with data sources. Issues such as uneven revisit times of Landsat tiles and potential cloud occlusion may affect the accuracy of surface water detection (Zou et al., 2018). Landsat satellite's 16-d revisit cycle may overlook transient surface water events, like flash floods and heavy rains (Wu et al., 2019). The medium spatial resolution (30 m) of Landsat data restricts detailed analysis of small surface water bodies and precise changes at water-land boundaries (Huang et al., 2021a). Moreover, known deficiencies in Landsat 7 sensor contribute to these limitations (Foga et al., 2017). To address these issues, future research plans should involve using radar data unrestricted by weather or time and optical data with higher spatial resolution to keep track of the state of surface water in inland arid and semi-arid areas.

5 Conclusions

This research analyzed the spatiotemporal dynamics of SWA and TWS in Gansu Province for the past 38 a, and identified the primary driving factors considering both climate change and human activities. From 1985 to 2022, SWA in Gansu Province expanded by 406.88 km2, attributed to fluctuations in SSWA and the stable growth of PSWA. Subarea analysis highlighted significant variations, with HH experiencing the largest increase of SWA and SQM showing a narrower increase of SWA. TWS first decreased then increased, mirroring trends in SWA. Socio-economic factors mainly drived the SWA dynamics in HH, YCA, and LP, while environmental factors predominated in GP and SQM. Climate change impacted the surface water 'source', while human activities affected its 'destination'. The surface hydrological processes in subareas can be summarized into three patterns: mountain, oasis, and urban. Among them, climate change controls the SWA dynamics in the 'mountain' pattern, while human activities mainly participate in the 'oasis' pattern and 'urban' pattern. Recommendations focus on targeted water resource allocation according to regional patterns, emphasizing comprehensive water resource management for ecological and societal needs. Our research provides essential data for assessing the current surface water status and addressing supply-demand discrepancies in Gansu Province, and offers fresh insights into the SWA dynamics and their drivers in inland arid and semi-arid areas. The findings have significant implications for sustainable development and water resource management, particularly in areas facing water scarcity.

Conflict of interest

The authors declare that they have no known competing financial interests or personal relationships that could have appeared to influence the work reported in this paper.

Acknowledgements

This research was supported by the Third Xinjiang Scientific Expedition Program (2021xjkk010102), the National Natural Science Foundation of China (41261047, 41761043), the Science and Technology Plan of Gansu Province, China (20YF3FA042), and the Youth Teacher Scientific Capability Promoting Project of Northwest Normal University, Gansu Province, China (NWNU-LKQN-17-7). We thank all the people related to this study.

Author contributions

Conceptualization: ZHAO Ruifeng; Methodology: LU Haitian; Formal analysis: LU Haitian; Software: LU Haitian, ZHAO Liu; Writing - original draft: LU Haitian; Writing - review and editing: ZHAO Liu, LYU Binyang, LIU Jiaxin, YANG Xinyue; Visualization: LU Haitian, LYU Binyang; Funding acquisition: ZHAO Ruifeng; Resources: ZHAO Ruifeng, LU Haitian; Supervision: ZHAO Ruifeng. All authors approved the manuscript.
[1]
Al-Jawad J Y, Alsaffar H M, Bertram D, et al. 2019. A comprehensive optimum integrated water resources management approach for multidisciplinary water resources management problems. Journal of Environmental Management, 239: 211-224.

[2]
Amundson R, Berhe A A, Hopmans J W, et al. 2015. Soil and human security in the 21st century. Science, 348 (6235): 1261071, doi: 10.1126/science.1261071.

[3]
An D, Du Y H, Berndtsson R, et al. 2020. Evidence of climate shift for temperature and precipitation extremes across Gansu Province in China. Theoretical and Applied Climatology, 139(3-4): 1137-1149.

[4]
Brottrager M, Crespo Cuaresma J, Kniveton D, et al. 2023. Natural resources modulate the nexus between environmental shocks and human mobility. Nature Communications, 14: 1393, doi: 10.1038/s41467-023-37074-y.

[5]
Cardinale B J, Duffy J E, Gonzalez A, et al. 2012. Biodiversity loss and its impact on humanity. Nature, 486(7401): 59-67.

[6]
Chang J X, Li Y Y, Yuan M, et al. 2017. Efficiency evaluation of hydropower station operation: A case study of Longyangxia station in the Yellow River, China. Energy, 135: 23-31.

[7]
Chen J D, Gao M, Cheng S L, et al. 2022. Global 1 km×1 km gridded revised real gross domestic product and electricity consumption during 1992-2019 based on calibrated nighttime light data. Scientific Data, 9: 202, doi:10.1038/s41597-022-01322-5.

[8]
Chen Y N, Li Z, Fan Y T, et al. 2015. Progress and prospects of climate change impacts on hydrology in the arid region of Northwest China. Environmental Research, 139: 11-19.

[9]
Chen Y N, Li Z, Fang G H, et al. 2018. Large hydrological processes changes in the transboundary rivers of Central Asia. Journal of Geophysical Research: Atmospheres, 123(10): 5059-5069.

[10]
Chung M G, Frank K A, Pokhrel Y, et al. 2021. Natural infrastructure in sustaining global urban freshwater ecosystem services. Nature Sustainability, 4(12): 1068-1075.

[11]
Cook M, Schott J R, Mandel J, et al. 2014. Development of an operational calibration methodology for the Landsat thermal data archive and initial testing of the atmospheric compensation component of a land surface temperature (LST) product from the archive. Remote Sensing, 6(11): 11244-11266.

[12]
DeVries B, Huang C Q, Armston J, et al. 2020. Rapid and robust monitoring of flood events using Sentinel-1 and Landsat data on the Google Earth Engine. Remote Sensing of Environment, 240: 111664, doi: 10.1016/j.rse.2020.111664.

[13]
Filippucci P, Brocca L, Bonafoni S, et al. 2022. Sentinel-2 high-resolution data for river discharge monitoring. Remote Sensing of Environment, 281: 113255, doi: 10.1016/j.rse.2022.113255.

[14]
Foga S, Scaramuzza P L, Guo S, et al. 2017. Cloud detection algorithm comparison and validation for operational Landsat data products. Remote Sensing of Environment, 194: 379-390.

[15]
Funk C, Peterson P, Landsfeld M, et al. 2015. The climate hazards infrared precipitation with stations—a new environmental record for monitoring extremes. Scientific Data, 2: 150066, doi: 10.1038/sdata.2015.66.

[16]
Gaughan A E, Stevens F R, Linard C, et al. 2013. High resolution population distribution maps for Southeast Asia in 2010 and 2015. PLoS ONE, 8(2): e55882, doi: 10.1371/journal.pone.0055882.

[17]
Getirana A, Kumar S, Girotto M, et al. 2017. Rivers and floodplains as key components of global terrestrial water storage variability. Geophysical Research Letters, 44(20): 10359-10368.

[18]
Gleason C J, Durand M T. 2020. Remote sensing of river discharge: A review and a framing for the discipline. Remote Sensing, 12(7): 1107, doi: 10.3390/rs12071107.

[19]
Gong P, Li X C, Wang J, et al. 2020. Annual maps of global artificial impervious area (GAIA) between 1985 and 2018. Remote Sensing of Environment, 236: 111510, doi: 10.1016/j.rse.2019.111510.

[20]
Gorelick N, Hancher M, Dixon M, et al. 2017. Google Earth Engine: Planetary-scale geospatial analysis for everyone. Remote Sensing of Environment, 202: 18-27.

[21]
Gu Z K, Zhang Y, Fan H. 2021. Mapping inter- and intra-annual dynamics in water surface area of the Tonle Sap Lake with Landsat time-series and water level data. Journal of Hydrology, 601: 126644, doi: 10.1016/j.jhydrol.2021.126644.

[22]
Güçlü Y S. 2020. Improved visualization for trend analysis by comparing with classical Mann-Kendall test and ITA. Journal of Hydrology, 584: 124674, doi: 10.1016/j.jhydrol.2020.124674.

[23]
Guo Y H, Guan W X, Lei C X, et al. 2022. Scalable super hygroscopic polymer films for sustainable moisture harvesting in arid environments. Nature Communications, 13: 2761, doi: 10.1038/s41467-022-30505-2.

[24]
Hall J W, Grey D, Garrick D, et al. 2014. Coping with the curse of freshwater variability. Science, 346(6208): 429-430.

[25]
Huang J P, Yu H P, Guan X D, et al. 2016. Accelerated dryland expansion under climate change. Nature Climate Change, 6(2): 166-171.

[26]
Huang W J, Duan W L, Chen Y N, et al. 2021a. Rapidly declining surface and terrestrial water resources in Central Asia driven by socio-economic and climatic changes. Science of the Total Environment, 784: 147193, doi: 10.1016/j.scitotenv.2021.147193.

[27]
Huang W J, Duan W L, Nover D, et al. 2021b. An integrated assessment of surface water dynamics in the Irtysh River Basin during 1990-2019 and exploratory factor analyses. Journal of Hydrology, 593: 125905, doi: 10.1016/j.jhydrol.2020.125905.

[28]
Huete A R, Liu H Q, Batchily K, et al. 1997. A comparison of vegetation indices over a global set of TM images for EOS-MODIS. Remote Sensing of Environment, 59(3): 440-451, doi: 10.1016/S0034-4257(96)00112-5.

[29]
Kou J W, Li C Y, Ma W J. 2023. The coupling of agricultural water footprint and socioeconomic development in ecological functional zones: A case study of Gansu Province, China. Anthropocene, 43: 100391, doi: 10.1016/j.ancene.2023.100391.

[30]
Li H W, Chen Y N. 2020. Assessing potential land suitable for surface irrigation using groundwater data and multi-criteria evaluation in Xinjiang inland river basin. Computers and Electronics in Agriculture, 168: 105079, doi: 10.1016/j.compag.2019.105079.

[31]
Li Z, Chen Y N, Li W H, et al. 2015. Potential impacts of climate change on vegetation dynamics in Central Asia. Journal of Geophysical Research: Atmospheres, 120(24): 12345-12356.

[32]
Li Z, Chen Y N, Wang Y, et al. 2016. Drought promoted the disappearance of civilizations along the ancient Silk Road. Environmental Earth Sciences, 75: 1116, doi: 10.1007/s12665-016-5925-6.

[33]
Li Z, Lin X Q, Coles A E, et al. 2017. Catchment-scale surface water-groundwater connectivity on China's Loess Plateau. Catena, 152: 268-276.

[34]
Li Z, Fang G H, Chen Y N, et al. 2020. Agricultural water demands in Central Asia under 1.5°C and 2.0°C global warming. Agricultural Water Management, 231: 106020, doi: 10.1016/j.agwat.2020.106020.

[35]
Liang X D, Li J C, Guo G X, et al. 2023. Urban water resource utilization efficiency based on SBM-undesirable-Gini coefficient-kernel density in Gansu Province, China. Environment, Development and Sustainability, 25(11): 13015-13034.

[36]
Lu H T, Zhao R F, Zhao L, et al. 2023. A contrarian growth: The spatiotemporal dynamics of open-surface water bodies on the northern slope of Kunlun Mountains. Ecological Indicators, 157: 111249, doi: 10.1016/j.ecolind.2023.111249.

[37]
McFeeters S K. 1996. The use of the Normalized Difference Water Index (NDWI) in the delineation of open water features. International Journal of Remote Sensing, 17(7): 1425-1432.

[38]
Olofsson P, Foody G M, Herold M, et al. 2014. Good practices for estimating area and assessing accuracy of land change. Remote Sensing of Environment, 148: 42-57.

[39]
Palmer S C J, Kutser T, Hunter P D. 2015. Remote sensing of inland waters: Challenges, progress and future directions. Remote Sensing of Environment, 157: 1-8.

[40]
Pekel J F, Cottam A, Gorelick N, et al. 2016. High-resolution mapping of global surface water and its long-term changes. Nature, 540(7633): 418-422.

[41]
Ren L L, Yang Y, Wang Q Q, et al. 2021. The transformation of cropping patterns from Late Neolithic to Early Iron Age (5900-2100 BP) in the Gansu-Qinghai region of Northwest China. The Holocene, 31(2): 183-193.

[42]
Rodell M, Famiglietti J S, Wiese D N, et al. 2018. Emerging trends in global freshwater availability. Nature, 557(7707): 651-659.

[43]
Rokni K, Ahmad A, Solaimani K, et al. 2015. A new approach for surface water change detection: Integration of pixel level image fusion and image classification techniques. International Journal of Applied Earth Observation and Geoinformation, 34: 226-234.

[44]
Santoro M, Wegmüller U, Lamarche C, et al. 2015. Strengths and weaknesses of multi-year Envisat ASAR backscatter measurements to map permanent open water bodies at global scale. Remote Sensing of Environment, 171: 185-201.

[45]
Scanlon B R, Zhang Z Z, Save H, et al. 2016. Global evaluation of new GRACE mascon products for hydrologic applications. Water Resources Research, 52(12): 9412-9429.

[46]
Shan H, Li C F, Chen Z H, et al. 2022. Exceptional water production yield enabled by batch-processed portable water harvester in semi-arid climate. Nature Communications, 13: 5406, doi: 10.1038/s41467-022-33062-w.

[47]
Song W, Song W. 2023. Cropland fallow reduces agricultural water consumption by 303 million tons annually in Gansu Province, China. Science of the Total Environment, 879: 163013, doi: 10.1016/j.scitotenv.2023.163013.

[48]
Sulla-Menashe D, Gray J M, Abercrombie S P, et al. 2019. Hierarchical mapping of annual global land cover 2001 to present: The MODIS Collection 6 Land Cover product. Remote Sensing of Environment, 222: 183-194.

[49]
Tao S L, Zhang H, Feng Y H, et al. 2020. Changes in China's water resources in the early 21st century. Frontiers in Ecology and the Environment, 18(4): 188-193.

[50]
Wang J D, Song C Q, Reager J T, et al. 2018a. Recent global decline in endorheic basin water storages. Nature Geoscience, 11: 926-932.

[51]
Wang J F, Li X H, Christakos G, et al. 2010. Geographical detectors-based health risk assessment and its application in the neural tube defects study of the Heshun Region, China. International Journal of Geographical Information Science, 24(1): 107-127.

[52]
Wang J F, Zhang T L, Fu B J. 2016. A measure of spatial stratified heterogeneity. Ecological Indicators, 67: 250-256.

[53]
Wang L X, Zhao L, Zhou H Y, et al. 2023a. Quantification of water released by thawing permafrost in the source region of the Yangtze River on the Tibetan Plateau by InSAR monitoring. Water Resources Research, 59(12): e2023WR034451, doi: 10.1029/2023WR034451.

[54]
Wang Q, Yang Z M. 2016. Industrial water pollution, water environment treatment, and health risks in China. Environmental Pollution, 218: 358-365.

[55]
Wang W, Teng H F, Zhao L, et al. 2023b. Long-term changes in water body area dynamic and driving factors in the middle-lower Yangtze Plain based on multi-source remote sensing data. Remote Sensing, 15(7): 1816, doi: 10.3390/rs15071816.

[56]
Wang X J, Zhang J Y, Gao J, et al. 2018b. The new concept of water resources management in China: ensuring water security in changing environment. Environment, Development and Sustainability, 20(2): 897-909.

[57]
Wang X X, Xiao X M, Zou Z H, et al. 2020. Gainers and losers of surface and terrestrial water resources in China during 1989-2016. Nature Communications, 11(1): 3471, doi: 10.1038/s41467-020-17103-w.

[58]
Wang Y, Hou S, Huai B, et al. 2018c. Glacier anomaly over the western Kunlun Mountains, northwestern Tibetan Plateau, since the 1970s. Journal of Glaciology, 64(246): 624-636.

[59]
Wiese D N, Landerer F W, Watkins M M. 2016. Quantifying and reducing leakage errors in the JPL RL05M GRACE mascon solution. Water Resources Research, 52(9): 7490-7502.

[60]
Wu Q S, Lane C R, Li X C, et al. 2019. Integrating LiDAR data and multi-temporal aerial imagery to map wetland inundation dynamics using Google Earth Engine. Remote Sensing of Environment, 228: 1-13.

[61]
Xue J, Gui D W, Lei J Q, et al. 2019. Oasis microclimate effects under different weather events in arid or hyper arid regions: a case analysis in southern Taklimakan desert and implication for maintaining oasis sustainability. Theoretical and Applied Climatology, 137(1-2): 89-101.

[62]
Yang J, Huang X. 2021. The 30 m annual land cover dataset and its dynamics in China from 1990 to 2019. Earth System Science Data, 13(8): 3907-3925.

[63]
Yao F F, Livneh B, Rajagopalan B, et al. 2023. Satellites reveal widespread decline in global lake water storage. Science, 380(6646): 743-749.

[64]
Yin X W, Feng Q, Li Y, et al. 2022. An interplay of soil salinization and groundwater degradation threatening coexistence of oasis-desert ecosystems. Science of the Total Environment, 806: 150599, doi: 10.1016/j.scitotenv.2021.150599.

[65]
Yu Y, Pi Y Y, Yu X, et al. 2019. Climate change, water resources and sustainable development in the arid and semi-arid lands of Central Asia in the past 30 years. Journal of Arid Land, 11(1): 1-14.

[66]
Zhang Z, He W, An M, et al. 2019. Water security assessment of China's One Belt and One Road Region. Water, 11: 607, doi: 10.3390/w11030607.

[67]
Zhou H W, Liu S X, Hu S, et al. 2021. Retrieving dynamics of the surface water extent in the upper reach of Yellow River. Science of the Total Environment, 800: 149348, doi: 10.1016/j.scitotenv.2021.149348.

[68]
Zou Z H, Xiao X M, Dong J W, et al. 2018. Divergent trends of open-surface water body area in the contiguous United States from 1984 to 2016. Proceedings of the National Academy of Sciences, 115(15): 3810-3815.

Outlines

/