Research article

Comparison of isotope-based linear and Bayesian mixing models in determining moisture recycling ratio

  • XIAO Yanqiong 1 ,
  • WANG Liwei 2 ,
  • WANG Shengjie , 1, * ,
  • Kei YOSHIMURA 3 ,
  • SHI Yudong 1 ,
  • LI Xiaofei 4 ,
  • Athanassios A ARGIRIOU 5 ,
  • ZHANG Mingjun 1
Expand
  • 1Key Laboratory of Resource Environment and Sustainable Development of Oasis of Gansu Province, College of Geography and Environmental Science, Northwest Normal University, Lanzhou 730070, China
  • 2Northwest Institute of Eco-Environment and Resources, Chinese Academy of Sciences, Lanzhou 730000, China
  • 3Atmosphere and Ocean Research Institute, University of Tokyo, Kashiwa 277-8568, Japan
  • 4School of Environmental Science and Engineering, Shaanxi University of Science and Technology, Xi'an 710021, China
  • 5Laboratory of Atmospheric Physics, Department of Physics, University of Patras, Patras GR-26500, Greece
*WANG Shengjie (E-mail: )

Received date: 2023-12-30

  Revised date: 2024-04-16

  Accepted date: 2024-05-11

  Online published: 2025-08-13

Abstract

Stable water isotopes are natural tracers quantifying the contribution of moisture recycling to local precipitation, i.e., the moisture recycling ratio, but various isotope-based models usually lead to different results, which affects the accuracy of local moisture recycling. In this study, a total of 18 stations from four typical areas in China were selected to compare the performance of isotope-based linear and Bayesian mixing models and to determine local moisture recycling ratio. Among the three vapor sources including advection, transpiration, and surface evaporation, the advection vapor usually played a dominant role, and the contribution of surface evaporation was less than that of transpiration. When the abnormal values were ignored, the arithmetic averages of differences between isotope-based linear and the Bayesian mixing models were 0.9% for transpiration, 0.2% for surface evaporation, and -1.1% for advection, respectively, and the medians were 0.5%, 0.2%, and -0.8%, respectively. The importance of transpiration was slightly less for most cases when the Bayesian mixing model was applied, and the contribution of advection was relatively larger. The Bayesian mixing model was found to perform better in determining an efficient solution since linear model sometimes resulted in negative contribution ratios. Sensitivity test with two isotope scenarios indicated that the Bayesian model had a relatively low sensitivity to the changes in isotope input, and it was important to accurately estimate the isotopes in precipitation vapor. Generally, the Bayesian mixing model should be recommended instead of a linear model. The findings are useful for understanding the performance of isotope-based linear and Bayesian mixing models under various climate backgrounds.

Cite this article

XIAO Yanqiong , WANG Liwei , WANG Shengjie , Kei YOSHIMURA , SHI Yudong , LI Xiaofei , Athanassios A ARGIRIOU , ZHANG Mingjun . Comparison of isotope-based linear and Bayesian mixing models in determining moisture recycling ratio[J]. Journal of Arid Land, 2024 , 16(6) : 739 -751 . DOI: 10.1007/s40333-024-0016-0

1 Introduction

The recycled moisture, including the moisture from local surface evaporation and transpiration, relative to advected moisture, plays a vital role in terrestrial hydrological circulation (Trenberth, 1999; van der Ent et al., 2010; Theeuwen et al., 2023; Xiao et al., 2023). The fractional contribution of recycled moisture in local precipitation is a spatially varying parameter, reflecting the climate conditions and the underlying surface (Xiao et al., 2018; Tuinenburg et al., 2020; Dominguez et al., 2022; Harrington et al., 2023). Under changing climate, the moisture recycling ratio reflects both natural and human processes at various scales, and provides information on water resource management (Keune and Miralles, 2019; Li and Wang, 2020; te Wierik et al., 2021).
Stable isotope tracers of hydrogen (δ2H) and oxygen (δ18O) have been widely considered in hydrology (Gimeno et al., 2012; Bowen et al., 2019). When stable isotope compositions of each end member of potential water sources of local precipitation are available, moisture recycling ratio can be determined using an isotope mixing model. From a mathematical perspective, we expect to find the unique solution to linear equations, no matter whether three (advection, surface evaporation, and transpiration as sources of local precipitation) or two (advection and surface evaporation as sources of local precipitation) contributions are assumed (Kong et al., 2013; Zhang and Wang, 2016; Gui et al., 2022).
In most conditions, a linear method is applied in most studies (Peng et al., 2011; Li et al., 2016; Sun et al., 2020; Gui et al., 2022), but linear equations often do not provide a reasonable fractional contribution solution ranging from 0.0% to 100.0%, which constrains the application in wider spatial and temporal scopes (Wang et al., 2016; Zhao et al., 2019; Zhu et al., 2020). For example, in an arid riparian forest, there were negative contributions of evaporation, ranging from -23.9% to -5.6%, and monthly contribution of advection ranges from 61.4% to 119.3% using isotope-based linear mixing model (Zhao et al., 2019). The Monte Carlo method was also used in this riparian forest, but the results were still abnormal. In another case, when three-component mixing models were applied, 19 in 20 monthly evaporations had no reasonable result with contributions between 0.0% and 100.0% in the mountains in Northwest China (Qiu et al., 2021). If the most negative contribution was removed, i.e., the two-component mixing models were used, 8 cases still have abnormal contributions (<0.0% or >100.0%). Some recent studies showed that the Bayesian estimate may have the potential in quantifying moisture recycling (Moore and Semmens, 2008; Parnell et al., 2010; Stock et al., 2018; Qiu et al., 2021; Wang et al., 2022). For example, Qiu et al. (2021) found that the Bayesian model always has fractional contributions between 0.0% and 100.0%. However, the difference in the performance between linear and the Bayesian mixing models under various climates has not been thoroughly studied yet.
In this study, we selected four areas (including 18 sampling stations) from the coastline to the inland in China and then obtained the moisture recycling ratio using linear and the Bayesian mixing models. This work aims to understand the performances of isotope-based linear and the Bayesian mixing models from various climates in China. Through this study, we can better understand the hydrological cycle process in China and provide scientific basis for water resource management and sustainable development.

2 Materials and methods

2.1 Data collection

Four sampling areas in China from eastern coastline to western inland were selected, namely the Taiwan Dao, the Guanzhong Plain, the Qilian Mountains, and the Junggar Basin (Fig. 1; Table 1). The selection criteria of the study area include: (1) the stable isotope compositions of δ2H and δ18O in precipitating vapor, surface evaporation vapor, transpiration vapor, and advection vapor had to be publicly available; and (2) at least three neighboring stations (interior distance <200 km) had to be available in a single area to eliminate the influence of station selection. The isotope compositions are all expressed using the delta notation relative to the Vienna Standard Mean Ocean Water (V-SMOW).
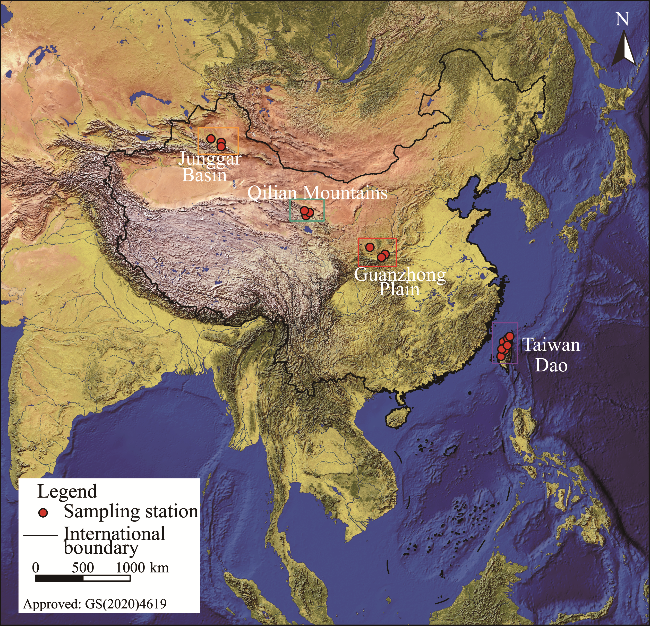
Fig. 1 Sampling stations in China. Four typical sampling areas are marked in squares, i.e., the Taiwan Dao (purple), the Guanzhong Plain (red), the Qilian Mountains (green), and the Junggar Basin (brown) from eastern coastline to western inland in China. Note that the figure is based on the standard map (GS(2020)4619) of the Map Service System (https://bzdt.ch.mnr.gov.cn/), and the standard map has not been modified.
Table 1 Latitude, longitude, and altitude of the sampling stations used in this study
Study area Station Latitude Longitude Altitude (m) Reference
Taiwan Dao Xinshan 25°07′N 121°44′E 27 Peng et al. (2011)
Wuling 24°21′N 121°19′E 1800
Taibei 24°59′N 121°31′E 5
Taichung 24°07′N 120°41′E 34
Puli 23°58′N 120°59′E 732
Lishan 24°16′N 121°10′E 1980
Hsinchu 24°45′N 121°00′E 34
Feitsui 24°54′N 121°34′E 150
Chiayi 23°29′N 120°18′E 27
Guanzhong Plain Xi'an 34°13′N 109°00′E 460 Li et al. (2020)
Weinan 34°29′N 109°27′E 413
Changwu 35°14′N 107°41′E 1220
Qilian Mountains Yeniugou 38°42′N 99°38′E 3320 Zhao et al. (2019)
Pailugou 38°34′N 100°17′E 2720
Hulugou 38°15′N 99°52′E 3020
Junggar Basin Urumqi 43°47′N 87°39′E 935 Wang et al. (2016)
Shihezi 44°19′N 86°03′E 443
Caijiahu 44°12′N 87°32′E 441
The Taiwan Dao faces the western Pacific Ocean in the east, and the Tropic of Cancer crosses the island. This area has a tropical and subtropical monsoon climate. The mean annual precipitation amount exceeds 2000 mm. In the Taiwan Dao (Peng et al., 2011), the samples were collected at nine stations (Xinshan, Wuling, Taibei, Taichung, Puli, Lishan, Hsinchu, Feitsui, and Chiayi) in the summer months (June-September) during 1993-2008.
The Guanzhong Plain is a west-eastern plain bounded by the Loess Plateau in the north and the Qinling Mountains in the south. The region consists of alluvial plains along the Weihe River, a branch of the Yellow River. It has a temperate monsoon climate, and the mean annual precipitation amount ranges approximately from 400 to 900 mm. In the Guanzhong Plain (Li et al., 2020), we used summer month samples (June-August) at three stations (Xi'an, Weinan, and Changwu) during 2010-2018.
The Qilian Mountains, a mountain range at the northeastern margin of the Qinghai-Tibet Plateau, lie to the south of the Hexi Corridor. Many inland streams and rivers originate from the mountains, and the wind regime is mainly controlled by the mid-latitude westerlies. In the Qilian Mountains, we selected three stations (Yeniugou, Pailugou, and Hulugou) with elevations ranging from 2720 to 3320 m a.s.l. in the upper reaches of the Heihe River (Zhao et al., 2019). Summer month samples (May-September) were collected at the three stations during 2008-2014.
The Junggar Basin is a low-lying basin surrounded by the Altay Mountains to the north and the Tianshan Mountains to the south. It belongs to a temperate continental climate and is governed by westerly moisture (Wang et al., 2016). In the Junggar Basin, samples were collected at three stations (Shihezi, Caijiahu, and Urumqi) in the summer months (April-October) during 2012-2013.
The stable δ2H and δ18O isotope compositions were analysed using an isotope ratio mass spectrometer (VG SIRA 10 and VG MM602D, IsoPrime Inc., Manchester, UK) and laser spectrometer (Picarro L2130-i, Picarro Inc., Sunnyvale, USA; DLT-100, Los Gatos Research Inc., Mountain View, USA), in which Picarro L2130-i was used in the Guanzhong Plain and the Qilian Mountains; and LGR DLT-100 was used in the Junggar Basin. Measurement precision is generally comparable.
To understand the comparability of different years, we assessed the precipitation isotopes during sampling years and long-term period using an isotope-incorporated Global Spectral Model v.2.0 (isoGSM2) (Yoshimura et al., 2008), which has been widely used in global and regional hydrological studies (Chiang et al., 2020; Kathayat et al., 2022; Wang et al., 2024). The grid dataset of monthly precipitation isotopes from May to September at a spatial resolution of 1.905° (latitude)×1.875° (longitude) is used here, and the monthly data are then weighted to a mean using precipitation amount. For each region, the closest grid of simulated isotope to the location with average latitude and longitude was selected. As shown in Figure 2, the simulations during the sampling period are close to the long-term climatology during 1979-2020, indicating the data compiled from different periods generally reflect the isotope characteristics of long-term precipitation.
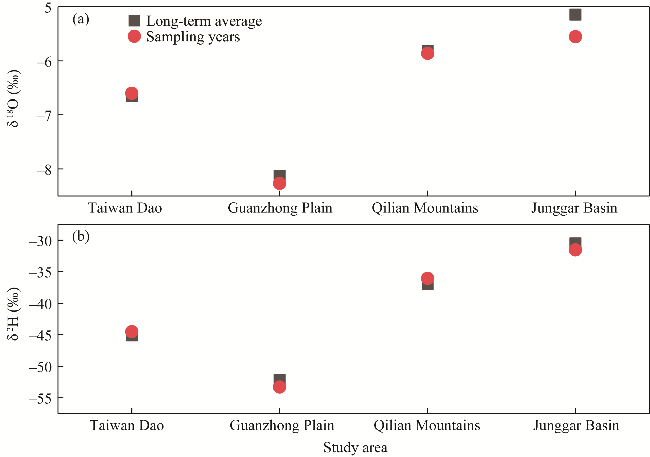
Fig. 2 Precipitation-weighted oxygen (δ18O; a) and hydrogen (δ2H; b) isotopes in summer months from May to September during long-term average (1979-2020) and sampling years in the four areas

2.2 Methods

In an isotope-based three-component mixing model (Fig. 3), the precipitating vapor is usually assumed to originate from three sources, i.e., advection vapor, surface evaporation vapor, and transpiration vapor, with the vapor from these three sources assumed to be fully mixed in the atmosphere. When stable isotope compositions of precipitating vapor and the three sources are known, we can determine the fractional contributions for each source (Peng et al., 2011). We described this basic framework using the delta notation of isotope compositions as follows:
δ Pv = f Adv δ Adv + f Tr δ Tr + f Ev δ Ev
f Adv + f Tr + f Ev = 1
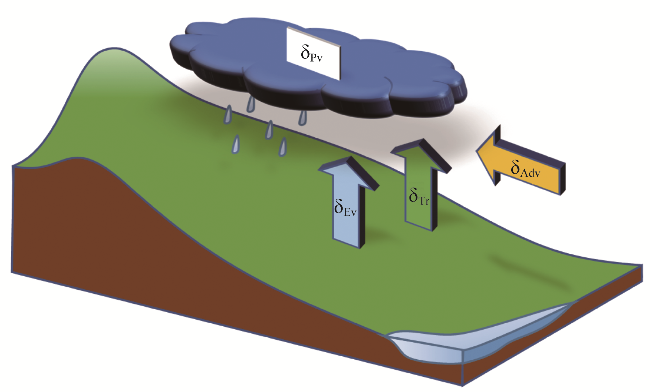
Fig. 3 Schematic of isotope-based three-component mixing model. Three arrows show the isotope compositions of three vapor sources, i.e., advection (δAdv), transpiration (δTr), and surface evaporation (δEv). Isotope composition of precipitating vapor is marked as δPv.
where δPv is the isotope composition of precipitating vapor (‰); fAdvδAdv (‰), fTrδTr (‰), and fEvδEv (‰) are the fractional contributions and the isotope compositions of advection, transpiration, and surface evaporation, respectively. Here the sum of contributions from surface evaporation and transpiration vapor is also known as the moisture recycling ratio (fRe):
f Re = f Tr + f Ev
All the isotope compositions of precipitating, advection, transpiration, and surface evaporation vapors are acquired from the publications in original mixing models (Peng et al., 2011; Wang et al., 2016; Zhao et al., 2019; Li et al., 2020).
To determine the solution of isotope-based mixing model, we used the Microsoft Excel-based software IsoError v.1.04 (Genereux, 1998; Phillips and Gregg, 2001, 2003). The software provides the estimated proportions and standard errors for each moisture source as well as the confidence intervals.
We also used the MixSIAR (the Bayesian mixing model in R software) v.3.1.12 (Moore and Semmens, 2008; Stock et al., 2018). The Bayesian estimate gives the probabilistic prediction of contributions from potential sources, which has been widely used in isotope mixing models (Evaristo et al., 2017). The model provides the mean value, standard error, and confidence intervals for each source. The number of the Markov chains is three, and the chain length is set as normal, i.e., 100,000.

3 Results and discussion

3.1 Relationship among source water isotopes

Relationship of stable isotope compositions for each component is shown in Figure 4. The Taiwan Dao had the largest range of stable isotope compositions among the four areas. Difference for δ2H values was larger than 400‰ in the Taiwan Dao, and the other areas usually had a δ2H range smaller than 200‰. That is, the three potential sources have quite different isotope compositions from precipitating vapor in the Taiwan Dao. Similarly, the range of δ18O values (approximately 70‰) in the Taiwan Dao was also larger than those in the other areas. For the areas with complex topography, there was a relatively large difference in humidity and temperature within one area, which might cause a divergence of stable isotopes in recycled moisture. According to the geographic information shown in Table 1, the Taiwan Dao had higher variation in altitude ranging from 5 to 1980 m. In the mountainous stations of the Taiwan Dao with elevations between 732 and 1980 m (Peng et al., 2010), the surface air temperature (16.9°C-22.0°C) and relative humidity (79.0%-85.0%) were different from the other nearby plain stations lower than 150 m (28.0°C-28.7°C for temperature and 74.0%-78.0% for relative humidity, respectively), and precipitation isotopes were more depleted in the mountains than those at the plain.
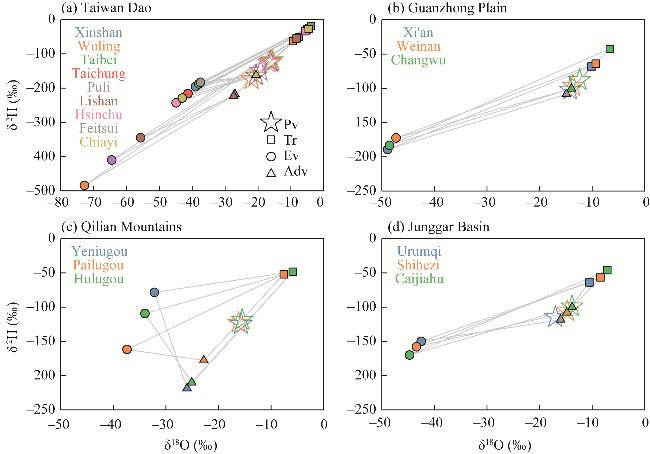
Fig. 4 Relationship between stable hydrogen (δ2H) and oxygen (δ18O) isotope compositions of Pv (precipitating vapor), Tr (transpiration), Ev (surface evaporation), and Adv (advection) vapors for different sampling stations in the four study areas. (a), Taiwan Dao; (b), Guanzhong Plain; (c), Qilian Mountains; (d), Junggar Basin. The symbols of δ2H and δ18O isotope compositions correspond to the sampling stations with the same color. The abbreviations are the same as in the following figures.
Among the three sources of advection, transpiration, and surface evaporation vapors, precipitating vapor was usually close to advected vapor, except in the Qilian Mountains (Fig. 4). In the Taiwan Dao, the Guanzhong Plain, and the Junggar Basin, the distance from selected upwind station to target stations was less than 500 km, indicating strong similarity of water vapor isotope along a transport path. Usually, the recycling ratio increases as study domain increases (Hua et al., 2017). In the Qilian Mountains, the advection vapor had more depleted isotopes, which was consistent with relatively long distance of moisture transport in the original setting (Zhao et al., 2019).
Between transpiration and surface evaporation vapors, precipitating vapor was relatively close to transpiration vapor (Fig. 4). From a global perspective, the contribution of transpiration vapor was usually larger than that of surface evaporation vapor (Rothfuss et al., 2020), and then transpiration vapor played a dominant role in recycled moisture. In addition, there was a commonly-used assumption in isotope mixing model that no isotopic fractionation occurred from soil and xylem water to transpiration vapor, especially in a stable condition, and precipitation isotopes were close to soil water isotopes (Peng et al., 2010).

3.2 Comparison between linear and the Bayesian mixing models

The results of means for each fractional contribution using linear and the Bayesian models are shown in Figure 5. Regarding the spatial pattern, the order of fractional contribution of recycled moisture was the Junggar Basin<the Guanzhong Plain<the Taiwan Dao<the Qilian Mountains. Generally, there was no clear linear trend in the moisture recycling ratio from eastern coastline to western inland.
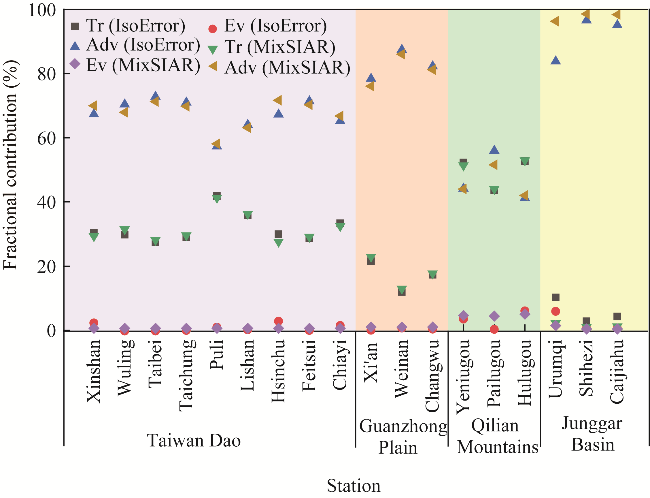
Fig. 5 Fractional contributions of Tr, Ev, and Adv vapors for each sampling station using IsoError and MixSIAR methods
For the results using linear model in 3 stations (Wuling, Taibei, and Feitsui) among 18 stations, fractional contribution had no reasonable values between 0.0% and 100.0% (Fig. 5). The calculated contributions from surface evaporation were below 0.0% at these 3 stations, which actually constrained the application of linear model. The fractional contribution of advection ranged from 41.2% to 96.6%. Contribution of recycled moisture was relatively less than that of advection, including transpiration vapor ranging from 2.8% to 52.8%, as well as surface evaporation ranging from -0.3% to 6.0%. The arithmetic averages were 28.0%, 1.4%, and 70.7%, respectively. The medians were 29.4%, 0.6%, and 70.7%, respectively.
For the MixSIAR-based results (Fig. 5), all the components had a contribution between 0.0% and 100.0%. Specifically, the fractional contributions of transpiration, surface evaporation, and advection vapors ranged from 1.0% to 53.0%, from 0.5% to 5.0%, and from 42.0% to 98.6%, respectively. The arithmetic averages were 27.3%, 1.4%, and 71.3%, respectively. The medians were generally similar to the arithmetic averages, i.e., 29.2%, 0.6%, and 70.2%, respectively.
Generally, among the three sources, advection played a dominant role in most cases, and recycled moisture had less contribution than advection. For recycled moisture, surface evaporation usually showed a fractional contribution of less than 6.0%, and the importance of transpiration vapor was usually larger than that of surface evaporation. This study provides an integrated comparison of the four areas from coastline to inland. Two western areas (the Junggar Basin and the Qilian Mountains) were mainly affected by westerly advection, while eastern areas (the Guanzhong Plain and the Taiwan Dao) were affected by monsoon advection. Contribution of advected moisture was larger than recycled moisture in all study areas. In a warming climate, water cycle is considered to be intensified in the East Asia (Markonis et al., 2019; Zhang et al., 2019), and evaporation intensity has exhibited an increasing trend in most areas during the last three decades (Shen et al., 2022). However, in this study, even in an arid climate with relatively weak moisture transport, advection vapor always plays a dominant role. Although recycled moisture may contribute to precipitation variability, we should not overrate the role of moisture recycling.
When the three abnormal values (Wuling, Taibei, and Feitsui stations) were ignored, the arithmetic averages of differences between IsoError and MixSIAR methods (i.e., IsoError minus MixSIAR) were 0.9% (ranging from -1.4% to 8.1%) for transpiration vapor, 0.2% (ranging from -4.1% to 4.4%) for surface evaporation vapor, and -1.1% (ranging from -12.4% to 4.4%) for advection vapor, respectively. The medians were 0.5%, 0.2%, and -0.8% for transpiration, surface evaporation, and advection vapors, respectively. That is, the importance of transpiration vapor is slightly less for most stations when MixSIAR is applied, and then that of advection is relatively larger. We compared the findings with that of Qiu et al. (2021), and found that three-component mixing model did not have reasonable solutions for most cases. Considering the existing cases without reasonable solutions using linear model in this study, the Bayesian model was relatively effective in determining the isotopic mixing model. Actually, many cases without solutions were exhibited in previous studies such as Zhao et al. (2019) and Qiu et al. (2021), so the Bayesian model should be recommended especially for the situations without reasonable solution.
Some parameters about uncertainties were also available for the two models (Fig. 6). For IsoError, the output included the proportion contribution, standard error, and 95% confidence interval of each source. For MixSIAR method, the software provided the proportion of water vapor source contribution, standard deviation, and 95% confidence interval. For IsoError-based result, the standard errors of advection vapor (ranging from 0.2% to 1.4%) were usually larger than those of transpiration vapor (ranging from 0.2% to 1.1%) and surface evaporation vapor (ranging from 0.3% to 0.5%). The arithmetic averages (and medians) were 0.4% (and 0.4%), 0.4% (and 0.5%), and 0.9% (and 0.9%) for transpiration vapor, surface evaporation vapor, and advection vapor, respectively. For MixSIAR-based results, the standard deviations for advection vapor were also usually higher. The arithmetic averages (and medians) were 2.4% (and 1.6%), 1.2% (and 0.8%), and 2.8% (and 1.6%) for transpiration, surface evaporation, and advection vapors, respectively. Due to the calculation method, we did not recommend to directly compare the values of standard errors and deviations of the two methods. However, the correlation analysis indicated there was no statistically significant correlation between the two values for each source at P<0.050 level, and the significance levels were 0.058, 0.095, and 0.690, respectively. The standard error of advection was usually high, while the standard errors of transpiration and surface evaporation vapors were relatively low. This may reflect the complexity of advection process and the influence of isotopic fractionation effects. In MixSIAR method, the standard deviation of advection vapor also showed a higher trend. These results suggest that there may be significant uncertainty in the contribution of water vapor sources to isotopic ratios, and further research and explanation are needed (Davis et al., 2015; Liu et al., 2023). Although we did not recommend directly comparing their standard error and standard deviation, some trends could still be observed. For example, MixSIAR model typically exhibited higher standard deviations, which might be related to their more complex handling of water vapor sources. However, further research is needed to determine the specific reasons for these differences.
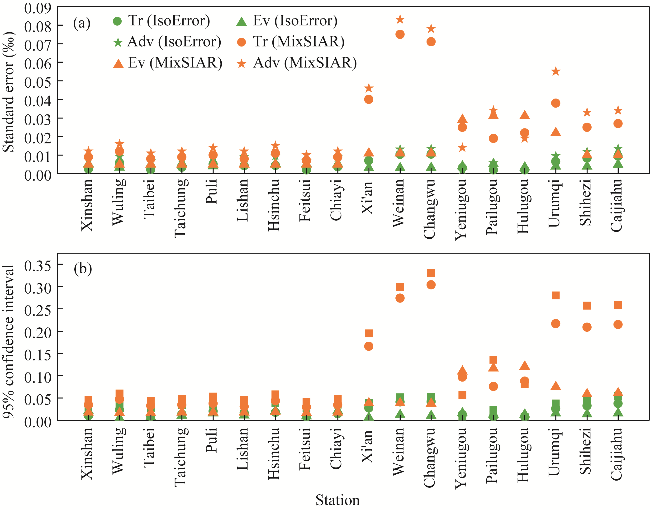
Fig. 6 Standard errors (a) and 95% confidence intervals (b) of Tr, Ev, and Adv vapors for each sampling station using IsoError and MixSIAR methods

3.3 Sensitivity of linear and the Bayesian mixing models

Here we examined the sensitivity of fractional contributions using linear and the Bayesian mixing models. Two isotope scenarios were selected, i.e., increases by 1‰ (+1‰) and decreases by 1‰ (-1‰) to δ2H in vapor isotopes (Figs. 7-10). Since stable δ2H isotope ratios in natural water usually correlate positively with stable δ18O isotope ratios (Crawford et al., 2014; Putman et al., 2019), we modified the value of δ18O according to the linear relationship between δ2H and δ18O. When the linear model works (except at Wuling, Taibei, and Feitsui stations), the basic relationships between advected and recycled moisture in most cases were similar.
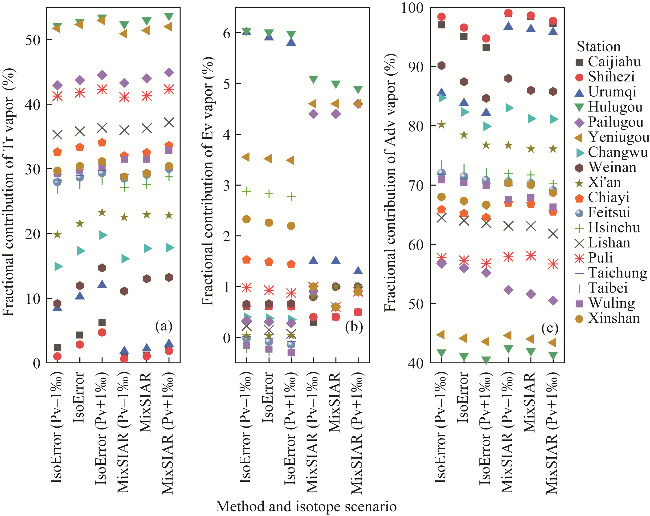
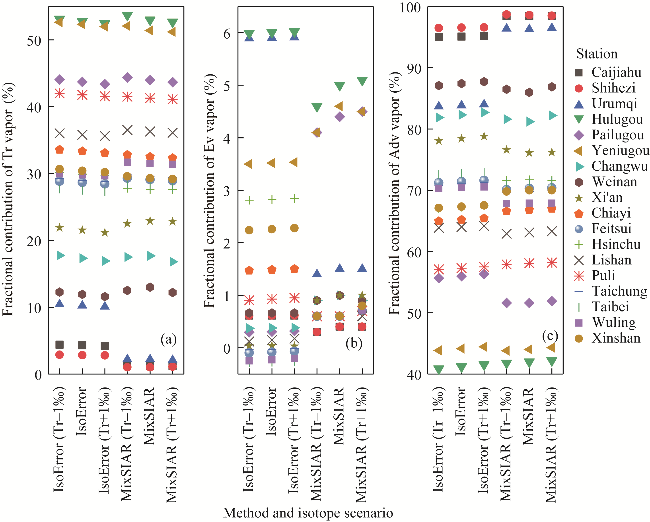
Fig. 7 Sensitivity of fractional contributions for each vapor source when δ2H value in Pv increases by 1‰ (+1‰) or decreases by 1‰ (-1‰) using IsoError and MixSIAR methods. (a), Tr vapor; (b), Ev vapor; (c), Adv vapor.
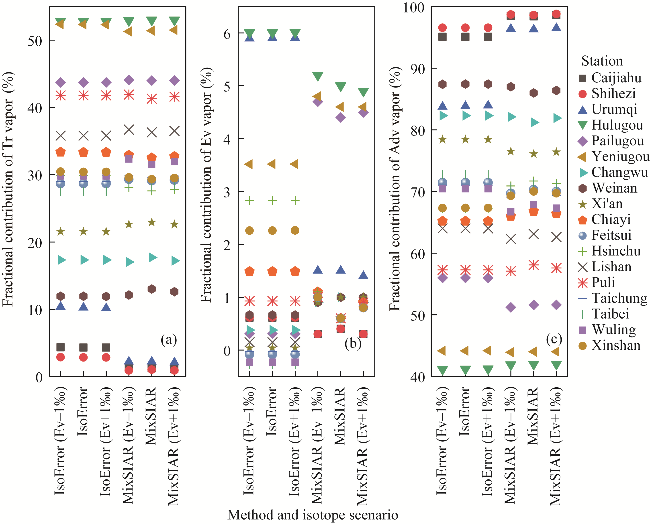
Fig. 8 Sensitivity of fractional contributions for each vapor source when δ2H value in Ev vapor increases by 1‰ (+1‰) or decreases by 1‰ (-1‰) using IsoError and MixSIAR methods. (a), Tr vapor; (b), Ev vapor; (c), Adv vapor.
Fig. 9 Sensitivity of fractional contributions for each vapor source when δ2H value in Tr vapor increases by 1‰ (+1‰) or decreases by 1‰ (-1‰) using IsoError and MixSIAR methods. (a), Tr vapor; (b), Ev vapor; (c), Adv vapor.
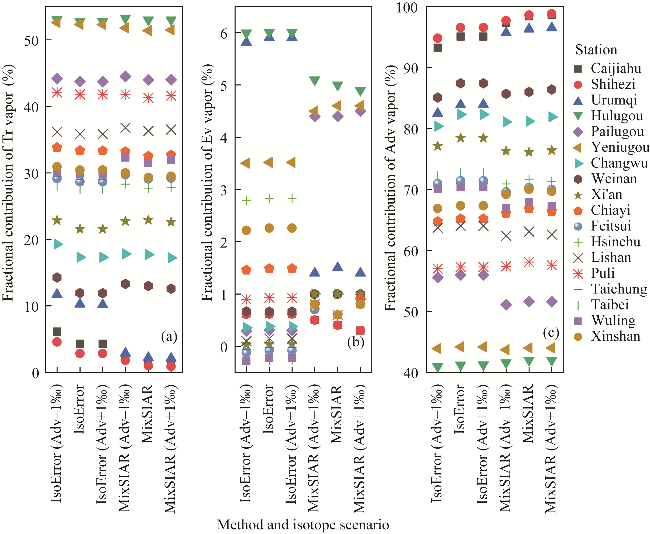
Fig. 10 Sensitivity of fractional contributions for each vapor source when δ2H value in Adv vapor increases by 1‰ (+1‰) or decreases by 1‰ (-1‰) using IsoError and MixSIAR methods. (a), Tr vapor; (b), Ev vapor; (c), Adv vapor.
Regarding the sensitivity under different precipitating vapor isotope signatures (Fig. 7), as precipitating vapor isotope ratio increased, the fractional contribution of transpiration vapor usually increased greatly, and that of advection vapor decreased. The changes using linear model were slightly larger than those using the Bayesian mixing model, indicating the Bayesian mixing model might have slightly lower sensitivity for most cases. In Figures 8-10, the results were not as sensitive as the above changes in precipitating vapor, indicating that it was important to accurately estimate the isotopes in precipitating vapor.

4 Conclusions

Stable δ2H and δ18O isotopes provide a useful tool to quantify the fractional contributions of recycled and advected moisture to precipitation. This is of great help in understanding the land-air interaction and natural and human impacts on the regional water cycle. In this study, four typical areas along the precipitation gradient from coastline to inland in China were selected to assess the performance of isotope-based linear and the Bayesian mixing models. When the abnormal values were ignored, the arithmetic averages of differences between IsoError and MixSIAR methods were 0.9% for transpiration vapor, 0.2% for surface evaporation vapor, and -1.1% for advection vapor, respectively. The importance of transpiration vapor was slightly less for most stations when MixSIAR method was applied, and then that of advection vapor was relatively larger. The Bayesian mixing model was more effective in determining a reasonable solution than linear model since linear model sometimes resulted in abnormal contribution rates (<0.0% or >100.0%). The sensitivity of the Bayesian mixing model to the changes in isotope-related input is slightly less than linear model. As precipitating vapor isotope ratio increased, the fractional contribution of transpiration vapor usually increased greatly, and that of advection vapor decreased. Generally, Bayesian mixing model should be recommended especially when a reasonable positive contribution cannot be determined using the traditional linear model.

Conflict of interest

The authors declare that they have no known competing financial interests or personal relationships that could have appeared to influence the work reported in this paper.

Acknowledgements

This study was supported by the National Natural Science Foundation of China (42261008, 41971034), and the Natural Science Foundation of Gansu Province, China (22JR5RA074). We thank Prof. ZHAO Liangju and Prof. PENG Tsung-Ren for providing the isotope data used in the study. We also thank Dr. QIU Xue for the discussion about isotope-based mixing model.

Author contributions

Conceptualization: XIAO Yanqiong, WANG Shengjie, ZHANG Mingjun; Methodology: XIAO Yanqiong, WANG Liwei, WANG Shengjie, Kei YOSHIMURA, SHI Yudong, LI Xiaofei, Athanassios A ARGIRIOU; Formal analysis: XIAO Yanqiong; Writing - original draft preparation: XIAO Yanqiong, WANG Liwei, WANG Shengjie, Athanassios A ARGIRIOU, ZHANG Mingjun; Writing - review and editing: XIAO Yanqiong, WANG Shengjie; Funding acquisition: WANG Liwei, WANG Shengjie; Resources: Kei YOSHIMURA, SHI Yudong, LI Xiaofei, ZHANG Mingjun; Supervision: ZHANG Mingjun. All authors approved the manuscript.
[1]
Bowen G J, Cai Z, Fiorella R P, et al. 2019. Isotopes in the water cycle: Regional to global scale patterns and applications. Annual Review of Earth and Planetary Sciences, 47: 453-479.

[2]
Chiang J C H, Herman M J, Yoshimura K, et al. 2020. Enriched East Asian oxygen isotope of precipitation indicates reduced summer seasonality in regional climate and westerlies. Proceedings of the National Academy of Sciences, 117: 14745-14750.

[3]
Crawford J, Hughes C E, Lykoudis S. 2014. Alternative least squares methods for determining the meteoric water line, demonstrated using GNIP data. Journal of Hydrology, 519: 2331-2340.

[4]
Davis P, Syme J, Heikoop J, et al. 2015. Quantifying uncertainty in stable isotope mixing models. Journal of Geophysical Research: Biogeosciences, 120(5): 903-923.

[5]
Dominguez F, Eiras-Barca J, Yang Z, et al. 2022. Amazonian moisture recycling revisited using WRF with water vapor tracers. Journal of Geophysical Research: Atmospheres, 127(4): e2021JD035259, doi: 10.1029/2021JD035259.

[6]
Evaristo J, McDonnell J J, Clemens J. 2017. Plant source water apportionment using stable isotopes: A comparison of simple linear, two-compartment mixing model approaches. Hydrological Processes, 31: 3750-3758.

[7]
Genereux D. 1998. Quantifying uncertainty in tracer-based hydrograph separations. Water Resources Research, 34(4): 915-919.

[8]
Gimeno L, Stohl A, Trigo R M, et al. 2012. Oceanic and terrestrial sources of continental precipitation. Reviews of Geophysics, 50(4): RG4003, doi: 10.1029/2012RG000389.

[9]
Gui J, Li Z, Feng Q, et al. 2022. Water resources significance of moisture recycling in the transition zone between Tibetan Plateau and arid region by stable isotope tracing. Journal of Hydrology, 605: 127350, doi: 10.1016/j.jhydrol.2021.127350.

[10]
Harrington T S, Nusbaumer J, Skinner C B. 2023. The contribution of local and remote transpiration, ground evaporation, and canopy evaporation to precipitation across North America. Journal of Geophysical Research: Atmospheres, 128(7): e2022JD037290, doi: 10.1029/2022JD037290.

[11]
Hua L, Zhong L, Ke Z. 2017. Characteristics of the precipitation recycling ratio and its relationship with regional precipitation in China. Theoretical and Applied Climatology, 127: 513-531.

[12]
Keune J, Miralles D G. 2019. A precipitation recycling network to assess freshwater vulnerability: Challenging the watershed convention. Water Resources Research, 55(11): 9947-9961.

[13]
Kong Y, Pang Z, Froehlich K. 2013. Quantifying recycled moisture fraction in precipitation of an arid region using deuterium excess. Tellus B: Chemical and Physical Meteorology, 65: 19251, doi: 10.3402/tellusb.v65i0.19251.

[14]
Li R, Wang C. 2020. Precipitation recycling using a new evapotranspiration estimator for Asian-African arid regions. Theoretical and Applied Climatology, 140(1-2): 1-13.

[15]
Li X, Lu A, Feng Q, et al. 2020. Recycled moisture in an enclosed basin, Guanzhong Basin of Northern China, in the summer: Contribution to precipitation based on a stable isotope approach. Environmental Science and Pollution Research, 27: 27926-27936.

[16]
Li Z, Feng Q, Wang Q J, et al. 2016. Contributions of local terrestrial evaporation and transpiration to precipitation using δ18O and D-excess as a proxy in Shiyang inland river basin in China. Global and Planetary Change, 146: 140-151.

[17]
Liu D, Li X, Zhang Y, et al. 2023. Using a multi-isotope approach and isotope mixing models to trace and quantify phosphorus sources in the Tuojiang River, Southwest China. Environmental Science & Technology, 57(19): 7328-7335.

[18]
Markonis Y, Papalexiou S M, Martinkova M, et al. 2019. Assessment of water cycle intensification over land using a multisource global gridded precipitation dataset. Journal of Geophysical Research: Atmospheres, 124(21): 11175-11187.

[19]
Moore J W, Semmens B X. 2008. Incorporating uncertainty and prior information into stable isotope mixing models. Ecology Letters, 11: 470-480.

[20]
Parnell A C, Inger R, Bearhop S, et al. 2010. Source partitioning using stable isotopes: Coping with too much variation. PLoS ONE, 5(3): e9672, doi: 10.1371/journal.pone.0009672.

[21]
Peng T R, Wang C H, Huang C C, et al. 2010. Stable isotopic characteristic of Taiwan's precipitation: A case study of western Pacific monsoon region. Earth and Planetary Science Letters, 289: 357-366.

[22]
Peng T R, Liu K K, Wang C H, et al. 2011. A water isotope approach to assessing moisture recycling in the island-based precipitation of Taiwan: A case study in the western Pacific. Water Resources Research, 47(8): W08507, doi: 10.1029/2010WR009890.

[23]
Phillips D L, Gregg J W. 2001. Uncertainty in source partitioning using stable isotopes. Oecologia, 127: 171-179.

[24]
Phillips D L, Gregg J W. 2003. Source partitioning using stable isotopes: Coping with too many sources. Oecologia, 136: 261-269.

[25]
Putman A L, Fiorella R P, Bowen G J, et al. 2019. A global perspective on local meteoric water lines: Meta-analytic insight into fundamental controls and practical constraints. Water Resources Research, 55(8): 6896-6910.

[26]
Qiu X, Zhang M, Dong Z, et al. 2021. Contribution of recycled moisture to precipitation in northeastern Tibetan Plateau: A case study based on Bayesian estimation. Atmosphere, 12(6): 731, doi: 10.3390/atmos12060731.

[27]
Rothfuss Y, Quade M, Brüggemann N, et al. 2020. Reviews and syntheses: Gaining insights into evapotranspiration partitioning with novel isotopic monitoring methods. Biogeosciences, 18(12): 3701-3732.

[28]
Shen J, Yang H, Li S, et al. 2022. Revisiting the pan evaporation trend in China during 1988-2017. Journal of Geophysical Research: Atmospheres, 127(12): e2022JD036489, doi: 10.1029/2022JD036489.

[29]
Stock B C, Jackson A L, Ward E J, et al. 2018. Analyzing mixing systems using a new generation of Bayesian tracer mixing models. PeerJ, 6: e5096, doi: 10.7717/peerj.5096.

[30]
Sun C, Chen W, Chen Y, et al. 2020. Stable isotopes of atmospheric precipitation and its environmental drivers in the Eastern Chinese Loess Plateau, China. Journal of Hydrology, 581: 124404, doi: 10.1016/j.jhydrol.2019.124404.

[31]
te Wierik S A, Cammeraat E L H, Gupta J, et al. 2021. Reviewing the impact of land use and land use change on moisture recycling and precipitation patterns. Water Resources Research, 57(7): e2020WR029234, doi: 10.1029/2020WR029234.

[32]
Theeuwen J J E, Staal A, Tuinenburg O A, et al. 2023. Local moisture recycling across the globe. Hydrology and Earth System Sciences, 27(7): 1457-1476.

[33]
Trenberth K E. 1999. Atmospheric moisture recycling: Role of advection and local evaporation. Journal of Climate, 12(5): 1368-1381.

[34]
Tuinenburg O A, Theeuwen J J E, Staal A. 2020. High-resolution global atmospheric moisture connections from evaporation to precipitation. Earth System Science Data, 12(4): 3177-3188.

[35]
van der Ent R J, Savenije H H G, Schaefli B, et al. 2010. Origin and fate of atmospheric moisture over continents. Water Resources Research, 46(9): W09525, doi: 10.1029/2010WR009127.

[36]
Wang S, Zhang M, Che Y, et al. 2016. Contribution of recycled moisture to precipitation in oases of arid central Asia: A stable isotope approach. Water Resources Research, 52(4): 3246-3257.

[37]
Wang S, Wang L, Zhang M, et al. 2022. Quantifying moisture recycling of a leeward oasis in arid central Asia using a Bayesian isotopic mixing model. Journal of Hydrology, 613(6): 128459, doi: 10.1016/j.jhydrol.2022.128459.

[38]
Wang S, Yang G, Bershaw J, et al. 2024. Interannual variations in stable isotopes of atmospheric water in arid Central Asia due to changes in atmospheric circulation. Global and Planetary Change, 234: 104367, doi: 10.1016/j.gloplacha.2024.104367.

[39]
Xiao K, Griffis T J, Lee X, et al. 2023. A coupled equilibrium boundary layer model with stable water isotopes and its application to local water recycling. Agricultural and Forest Meteorology, 339: 109572, doi: 10.1016/j.agrformet.2023.109572.

[40]
Xiao W, Wei Z, Wen X. 2018. Evapotranspiration partitioning at the ecosystem scale using the stable isotope method-A review. Agricultural and Forest Meteorology, 263: 346-361.

[41]
Yoshimura K, Kanamitsu M, Noone D, et al. 2008. Historical isotope simulation using reanalysis atmospheric data. Journal of Geophysical Research, 113(D19): D19108, doi: 10.1029/2008JD010074.

[42]
Zhang M, Wang S. 2016. A review of precipitation isotope studies in China: Basic pattern and hydrological process. Journal of Geographical Sciences, 26(7): 921-938.

[43]
Zhang W, Zhou T, Zhang L, et al. 2019. Future intensification of the water cycle with an enhanced annual cycle over global land monsoon regions. Journal of Climate, 32(17): 5437-5452.

[44]
Zhao L, Liu X, Wang N, et al. 2019. Contribution of recycled moisture to local precipitation in the inland Qilian Mountains. Agricultural and Forest Meteorology, 271: 316-335.

[45]
Zhu X, Wu T, Hu G, et al. 2020. Long-distance atmospheric moisture dominates water budget in permafrost regions of the central Qinghai-Tibet Plateau. Hydrological Processes, 34(22): 4280-4294.

Outlines

/