Research article

Numerical simulation on the influence of plant root morphology on shear strength in the sandy soil, Northwest China

  • ZHANG Lingkai 1, 2 ,
  • SUN Jin , 1, 2, * ,
  • SHI Chong 1, 2, 3
Expand
  • 1College of Water Resources and Civil Engineering, Xinjiang Agricultural University, Urumqi 830052, China
  • 2Xinjiang Key Laboratory of Water Conservancy Engineering Safety and Water Disaster Prevention and Control, Urumqi 830052, China
  • 3Geotechnical Research Institute, Hohai University, Nanjing 210098, China
* SUN Jin (E-mail: )

Received date: 2024-04-08

  Revised date: 2024-08-16

  Accepted date: 2024-08-28

  Online published: 2025-08-13

Abstract

Serious riverbank erosion, caused by scouring and soil siltation on the bank slope in the lower reaches of the Tarim River, Northwest China urgently requires a solution. Plant roots play an important role in enhancing soil shear strength on the slopes to maintain slope soils, but the extent of enhancement of soil shear strength by different root distribution patterns is unclear. The study used a combination of indoor experiments and numerical simulation to investigate the effects of varying plant root morphologies on the shear strength of the sandy soil in the Tarim River. The results showed that: (1) by counting the root morphology of dominant vegetation on the bank slope, we summarized the root morphology of dominant vegetation along the coast as vertical, horizontal, and claw type; (2) the shear strength of root-soil composites (RSCs) was significantly higher than that of remolded soil, and the presence of root system made the strain-softening of soil body significantly weakened so that RSCs had better mechanical properties; and (3) compared with the lateral roots, the average particle contact degree of vertical root system was higher, and the transition zone of shear strength was more prominent. Hence, vegetation with vertical root system had the best effect on soil protection and slope fixation. The results of this study have important guiding significance for prevention and control of soil erosion in the Tarim River basin, the restoration of riparian ecosystems, and the planning of water conservancy projects.

Cite this article

ZHANG Lingkai , SUN Jin , SHI Chong . Numerical simulation on the influence of plant root morphology on shear strength in the sandy soil, Northwest China[J]. Journal of Arid Land, 2024 , 16(10) : 1444 -1462 . DOI: 10.1007/s40333-024-0030-2

1 Introduction

Slope protection is important to reduce the damage of environment and improve the performance of soil structure (Ni et al., 2018, 2024). In recent years, it has been widely used in projects such as embankment and riverbank ecological management (Wai et al., 2022). Plant root systems have strong scour resistance, toughness, and ecological suitability (Zhou and Zhang, 2003; Hu et al., 2005; Badhon et al., 2021). However, the morphology of plant roots is complex and difficult to observe, and root-soil composites (RSCs), as a complex composite structure, the exact influence of its mechanical properties in engineering applications is unclear. Therefore, it is particularly important to study and investigate the mechanical properties of RSCs.
A combination of numerical simulation and physical investigation is used to investigate how vegetation improves the mechanical properties of soil. Using a homemade rectangular soil sampler, the oak tree root system (Endo, 1980) was shown to be able to increase soil shear strength, marking the beginning of laboratory trials with intact root reinforcement. Later, quasi-cohesion, stress-strain behavior, and other strength parameters were added as evaluation criteria for the shear strength of RSCs (Tien et al., 1979). The shear strength of RSCs is highly influenced by root density, root inclination, and distribution morphology when the impact of moisture content is not taken into account (Mickovski et al., 2011). In order to apply the previously described measures, Suleiman et al. (2013) examined the protective effects of riverbank with or without vegetation root systems. Moreover, the contribution rates of different vegetation root systems to erosion control along river bank were analyzed and the maximum values of soil strength enhancement were achieved by these root systems (Yan et al., 2010). In situ shear tests can yield relatively precise results and indoor experiments can accurately depict their true mechanical properties, but in situ excavation causes significant disruption to the environment (Hirano et al., 2009; Augusto et al., 2015). Consequently, numerical simulation experiments are thought to be a valuable approach for gaining a microscopic understanding of mechanisms and mechanical characteristics of plant root systems within the soil (Kirby and Bengough, 2002).
The discrete element method (DEM) was initially developed in the field of numerical simulation by Cundall (1971). It is used in the field of rock mechanics initially. Strack and Cundall (1978) and Cundall and Strack (1979) subsequently refined the DEM for soil mechanics. Two-dimensional disk programs and three-dimensional sphere programs have also been developed to simplify blocks into shapes like triangles, quadrilaterals, and circles. This allows the creation of two-dimensional DEM models to mimic the random microstructures of soil-rock mixture (Graziani et al., 2012). The effects of rock content and gravel shape on the shear properties of soil-rock mixture have been further evaluated by subsequent scholars through numerical models (Yao et al., 2022). Furthermore, Sadek et al. (2011) carried out numerical simulations of biaxial and direct shear testing, evaluating and verifying the simulation models' mechanical results.
The commonly used Particle Flow Code (PFC) model, which is based on the general DEM framework is utilized in this study. The PFC model allows for the displacement and rotation of discrete particles while connecting them through appropriate contact methods to facilitate their movement and interaction within a limited size range. New contacts can be automatically identified during the particle movement process to address complex-shaped particle modeling and analysis.
RSCs are considered as the discontinuous medium with its mechanical properties being manifested by discontinuous flow displacement in different directions after applying force on unit sand particles. This phenomenon may also accompany potential movements and fracture behavior of the internal root system. By bonding particles in RSCs using DEM, effective simulations can be conducted for rock and soil masses.
The degree to which reinforcement materials improve soil mechanical properties is then assessed through simulation using DEM. Sand particle rotation is suppressed and the cohesiveness and friction angle of the sandy soil are enhanced to some extent by artificial materials like rubber and geogrids (Bai et al., 2021; Manohar and Anbazhagan, 2021). According to Zhang et al. (2023), DEM may effectively simulate the root systems of maize and spinach when natural reinforcing materials are incorporated into the previously mentioned research. The overall shear strength is highly dependent on the placement angle and the quantity of reinforcement layers (Wu et al., 2015; Xu et al., 2017). Moreover, inclination-specific reinforcements are observed to have a more noticeable impact than horizontal reinforcements.
To date, however, the majority of research on reinforcement materials has concentrated on examining the impact of individual root system on the shear strength of RSCs (Shikora, 2000; Bischetti et al., 2005; Islam et al., 2016). The effect of whole root system on the mechanical characteristics of the soil has received very little attention (Schwarz et al., 2011; Ni et al., 2017). There isn't yet a well-developed theoretical foundation in this area.
In conclusion, it is thought to be crucial for the advancement of projects about vegetation slope protection to investigate the effects of root morphology on soil mechanical properties from both a microscopic and macroscopic standpoint (Mao et al., 2014; Jafari et al., 2022). RSCs in the downstream of the Tarim River, Northwest China are selected as the subject of this study. Direct shear models are constructed for RSCs and plain soil using numerical simulation. The aim of the study is to analyze the relationship among shear stress, volumetric strain, and shear displacement under different root distribution patterns.

2 Materials and methods

2.1 Study area

The Tarim River is the largest inland river in Northwest China (34°55′-43°08′N, 73°10′-94°05′E). The area has serious soil erosion due to the lack of vegetation cover and infertile soil. The sampling site of this test is in the downstream of the Tarim River. According to the relevant information and the layering of the soil body at the site, the samples were taken in two layers, each with a thickness of 40-45 cm, and the samples were taken for indoor geotechnical tests to analyze the physical and mechanical properties. When the experimental data were combined, it was found that the lower layer was predominantly made up of fine-grained sandy soil, while the higher layer was mainly made up of sandy loam. The soil showed an internal friction angle between 30.7° and 33.9° and a cohesiveness between 3.1 and 13.5 kPa. Table 1 shows the soil's physical properties. Trees, shrubs, and herbaceous plants make up the majority of vegetation in the Tarim River, which covers an area of 25.88×10⁶ hm2. Tree species include Populus euphratica Oliv. and Populus pruinosa Schrenk., while shrubs encompass Tamarix ramosissima Ledeb., Haloxylon ammodendron (C. A. Mey.) Bunge, Alhagi camelorum Fisch., Apocynum venetum L., and so on. Herbaceous plants primarily include Phragmites australis (Cav.) Trin. ex Steud.
Table 1 Physical properties of soils on the Tarim River bank
Water content (%) Wet density (g/cm3) Dry density (g/cm3) Void ratio Specific density of solid particles
27.44 1.87 1.47 0.83 2.68

2.2 Root system types

Based on the influence of different root systems on growth effects, researchers have categorized plant root systems into supporting and absorbing roots. Usually found at the ends of the root system, researchers distinguished by a profusion of fine root hairs that increased the surface area of the roots for better uptake of nutrients and water (de Bauw et al., 2020). The primary function of the plant's support roots was to stabilize and uphold the plant's body. Typically, they were planted further down into the soil and secured there to improve the stability of the plant (Karizumi and Tsutsumi, 1958; Jin et al., 2013). Thus, this research primarily focused on the growth morphology and distribution of support roots in order to provide a more thorough understanding of the composition and operation of plant root systems.
Three varieties of shrub vegetation, each having a growth age of one year, were chosen to be studied (Perkons et al., 2014). We removed mulch around the root system with a brush as the soil was collected using dry excavation method. By identifying the main and lateral roots' growth paths and distribution patterns, this procedure established the comprehensive properties of intact plant root systems (Operstein and Frydman, 2000; Finér et al., 2011). The diameters of the main and lateral roots were measured, and they ranged from 1.5 to 2.0 mm.
The morphology of root systems comprises primary roots and lateral roots, with primary roots playing a dominant role in configuration and lateral roots enhancing water absorption by expanding the root-soil contact area (Zobel, 2008; Armengaud et al., 2009). The position of primary roots and the growth status of lateral roots fundamentally determine the overall structural form of the root systems. Studies indicated that various root measurement indices, including root length, root weight, and absorption area, could reflect root configuration to some extent. Scholars classified root system morphology including downward-rooted, outward-rooted, and horizontal-rooted types. Among them, downward-rooted types were further divided into shallow, intermediate, and deep-rooted types, while horizontal-rooted types were categorized as dispersed, intermediate, and concentrated types. When analyzing the impact of plant root systems on slope protection, research primarily focused on the root configuration of plant species (Saint et al., 2019). The ability of plants to absorb nutrients and water from the soil largely depended on the morphology of their root systems (Coppin and Richards, 1990). Therefore, understanding the root configurations of different plants was of significant scientific value for a deeper understanding of the roles played by plants in soil stabilization processes.
The generalized process of the root system model is depicted in Figure 1. Initially, we collected feature points of the main supporting roots based on the results obtained through dry excavation method. In order to restore the morphology of root systems as much as possible, we calculated the total root density of root systems in the area containing all the roots, and took the average value as Vm. If the ratio of Vi (root density in any area) to Vm within Vi unit area was greater than or equal to Vm (ViVm), the set was considered part of the same root system. If Vi was less than or equal to Vm (ViVm), it was treated as a distinct root system, continuing until the search for all root systems was completed.
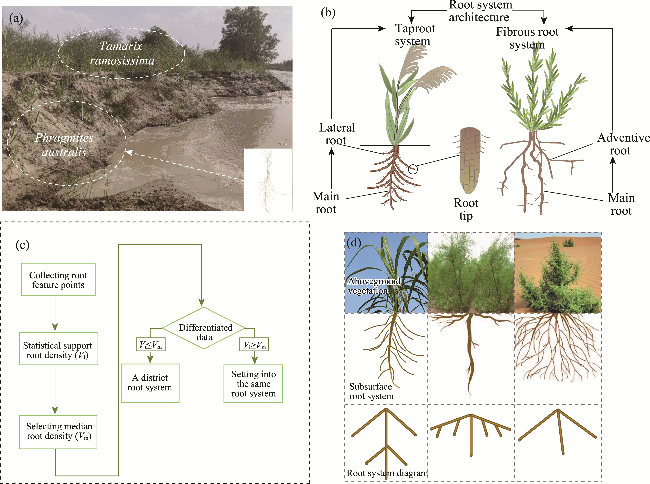
Fig. 1 Schematic diagram of root system generalization in the Tarim River basin. (a), root sampling site and sample of Phragmites australis (Cav.) Trin. ex Steud; (b), schematic diagram of root system configuration; (c), root system generalization process diagram; (d), root system generalization result.
Three main forms of root systems were found through the study and examination of the plants below the Tarim River, i.e., dispersed, horizontal, and vertical root types. There was one primary root and several lateral roots that made up the vertical root type. A main-lateral root system structure was formed, which stretched deep into the soil, as the main root expanded downward and the lateral roots grew to both sides. P. australis was the representative plant. The majority of the roots in the horizontal root type were dispersed throughout the top soil layer, with root systems that grew mainly horizontally. T. ramosissima was the representative plant. The dispersed root type was more widely distributed and featured well-developed branching roots in addition to less pronounced main roots. Alhagi sparsifolia Shap. was the representative plant. Figure 1d displays the conceptual diagram of these root systems.

2.3 Root pulling test

Pullout test on individual root was carried out in the experiment using the helical tension test apparatus (NK-200, Shenzhen Liance Electronic Technology Co., Ltd., Shenzhen, China). Three distinct shrub species were subjected to pullout test. Each root sample was chosen from the same diameter class, and each type of root systems underwent at least 15 test repeats. The link between diameter tensile force and tensile strength was determined using pullout test data. The tensile strength of root systems was determined by the following equation:
$T=\frac{4F}{\text{ }\!\!\pi\!\!\text{ }{{d}^{2}}}$,
where T is the tensile strength of root systems (MPa); F is the tensile force exerted on root systems when it fractures (N); and d is the diameter of root systems (mm).
As can be seen in Figure 2, the tensile strength of vegetative root systems increases as the diameter of root systems increases, and the expansion of cross-sectional area allows root systems as a whole to resist the tensile force more effectively, so the tensile strength gradually increases. There were notable variations in tensile stress between various vegetative root systems while the root diameter remained constant. This resulted from differences in material characteristics of various vegetative root systems, such as elastic modulus and tensile strength, which in turn affected the root systems' overall strength and tensile performance. Additionally, as the root diameter reached 1.5 mm, the variations became more noticeable, suggesting that prior to a particular growth stage, there were not many changes in the tensile force of various vegetative root systems.
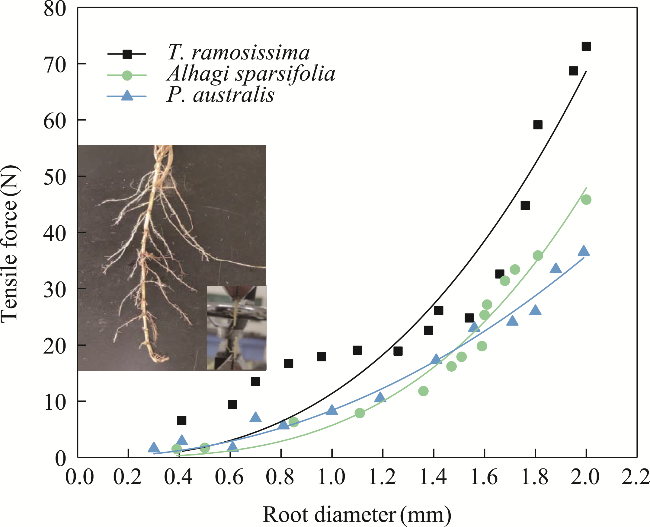
Fig. 2 Relationship between root diameter and tensile force
Regression equations are tested using a combination of numerical analysis softwares (Origin and Matlab) and coefficient of determination (R2), significance, and regression coefficient significance tests (Table 2). Based on Table 2, it is evident that there is a power-law relationship between root diameter and tensile force. The regression equation was able to accurately describe the relationship between two variables during vegetation root growth period, as evidenced by R2 values, which were all greater than 0.90.
Table 2 Regression analysis of relationship between root diameter and tensile force for different vegetation types
Vegetation type Regression equation R2 Regression coefficient test
Constant Exponent sign
t P t P
Tamarix ramosissima F=11.38d2.5936 0.90 2.29 <0.001 2.59 <0.001
Alhag sparsifolia F=8.39d2.0969 0.96 0.74 <0.001 2.10 <0.001
Phragmites australis F=5.77d2.1851 0.97 0.76 <0.001 3.07 <0.001

Note: F is the tensile force exerted on root systems when it fractures; and d is the diameter of root systems.

2.4 Fabric changes

The anisotropy of soil can be reflected by its directional contact fabric (Oda, 1972). After shearing, the directional contact fabric of the specimen undergoes certain displacements along the normal and tangential directions. The contact fabric in the normal direction, denoted as E(θ), and the normal contact force fabric Fn(θ), as well as the tangential contact force fabric Ft(θ), can be represented by Fourier series functions (Rothenburg and Bathurst, 1989):
$\left\{ \begin{matrix} {{F}_{t}}(\theta )=-{{f}_{0}}{{a}_{t}}\sin 2(\theta -{{\theta }_{t}}) \\ {{F}_{n}}(\theta )={{f}_{0}}\left\{ 1+{{a}_{n}}\cos [2(\theta -{{\theta }_{n}})] \right\} \\ E(\theta )=(1/2\text{ }\!\!\pi\!\!\text{ })\left[ 1+a\cos [2(\theta -{{\theta }_{a}})] \right] \\\end{matrix} \right.$,
where θ is the angle between the normal direction of particle-particle contacts (°); f0 is the average normal contact force among all particle-particle contacts (N); θt, θn, and θa are the angles of the principal directions of anisotropic distributions for tangential contact force between particles, normal contact force, and normal direction, respectively (°); and at, an, and a are the Fourier fitting coefficients reflecting the degree of anisotropy in the distributions of tangential contact force between particles, normal contact force, and normal direction, respectively.

3 Model establishment and parameter calibration

3.1 Constructing numerical model

In this study, we initially generated a specific number of particles based on the porosity range of sand. These generated particles were then classified into soil particles using the ''group'' command. Subsequently, root particles with distinct shapes (vertical, horizontal, and claw) were created at specified coordinates using ''create position''. These root particles were grouped using the ''group'' to facilitate subsequent parameter calibration process, whereby model parameters were assigned to root and soil particles separately.

3.1.1 Establishing a sandy soil model

The sampling location for this experiment was along the lower reaches of the Tarim River. Based on in situ soil stratification, we selected samples of two layers, each with a thickness ranging from 40 to 45 cm. These soil samples were subjected to indoor geotechnical test to analyze the soil's physical and mechanical properties. After initial screening, it was observed that the particle size of the soil was less than 0.075 mm. Therefore, both the density meter method and screening method were employed to determine the particle size distribution. It was evident from test results that upper soil primarily consisted of silty sand, while lower soil mainly comprised fine-grained sandy soil. Consequently, the studied soil belonged to the poorly graded sand category. The liquid-plastic limit test revealed that the soil exhibited low strength in its saturated state.
It was clear that sand, with a particle size range of 0.100-0.800 mm, was the focus of this study. A criterion was used to guarantee the stability of simulation findings, wherein the specimen length divided by the minimum radius of simulated sand particles was less than 0.010 mm (Chancellor, 1994). The number of particles (P) was determined by Equation 3, resulting in a total of 8066 particles generated:
$P=\frac{4S(1-n)}{\text{ }\!\!\pi\!\!\text{ }{{({{R}_{\min }}+{{R}_{\max }})}^{2}}}$,
where S is the model area (m2); n is the specified porosity (%); and Rmin and Rmax are the minimum and maximum radii (m), respectively, for randomly generated particles.

3.1.2 Establishing a root system model

The aim of the study was to identify the root distribution morphology that demonstrates the maximum shear resistance by means of a combination of numerical simulation and indoor test. Previous studies have shown that the tensile strength and Young's modulus of simulated root systems are directly correlated with parallel bond stiffness (Bai et al., 2021). The root particle diameter and the simulated Young's modulus are linearly proportional under the same parallel bond stiffness. Furthermore, the impact of simulated root system length on the macroscopic modulus can be disregarded. The scattered root type was generalized as claw-like, with the main root radius being 1.5 times that of the secondary root while retaining the growth characteristics of root systems. This method simplified root structure and increased computational efficiency by reducing the number of roots. The three root types were individually subjected to DEM, and the resulting two-dimensional plane data are presented in Figure 3. The root numbers for the vertical, horizontal, and claw types were 120, 111, and 104, respectively. In addition, the corresponding percentages of root area were 1.7%, 1.8%, and 1.5%, respectively.
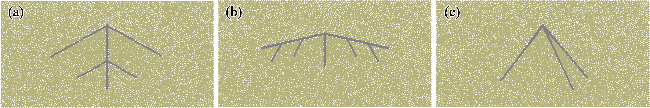
Fig. 3 Two-dimensional numerical simulation of root systems. (a), horizontal type; (b), vertical type; (c), claw type.

3.2 Parameter calibration

3.2.1 Root system parameter calibration

Numerical simulation tests were carried out under a normal stress of 100 kPa on three groups of RSCs with diverse root types and undamaged soil. In this study, it was hypothesized that the upper soil layer of root systems underwent shearing since slope collapses usually involved disruptions in the shallower soil layers. In order to ensure computational efficiency and replicate the impact of rapid shearing on specimen, we operated the upper shearing box at a predetermined shear rate, maintaining a shear displacement consistent with RSCs (Linde, 2007). Through an analysis of the strain and stress properties of several RSCs, we can determine the ideal root type, the RSCs contact model, and root stretching results, as depicted in Figure 4a.
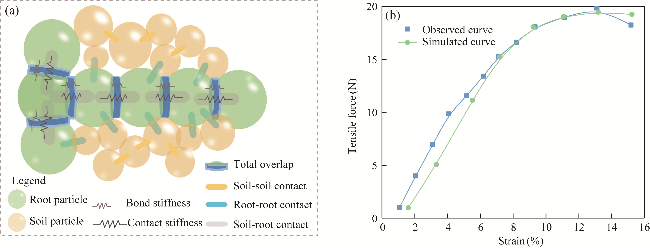
Fig. 4 Comparison between experimental curve and numerical simulation of root tension-strain relationship. (a), bond model of root-soil composites (RSCs); (b), numerical simulation of root tensile force.
Root-root, root-soil, and soil-soil interactions were three categories of DEM contact models used for the specimen. The root-root interaction employed a parallel bonding contact model, while the root-soil and soil-soil interactions utilized a linear bonding model. The distinction lay in the microscopic parameters employed.
Root system particles were considered a continuous entity and connected in series, with their stiffness and cohesive forces much greater than those of soil particles. Root system particles could reinforce the specimen during shear. The elastic coefficients and forces between two series-connected particles in DEM were calculated by the following formulas:
$k=\frac{{{k}_{1}}\times {{k}_{\text{2}}}}{{{k}_{1}}+{{k}_{2}}}$,
${{F}_{r}}=k\times \left[ \frac{k({{x}_{1}}+{{x}_{2}})}{{{k}_{1}}}+\frac{k({{x}_{1}}+{{x}_{2}})}{{{k}_{2}}} \right]$,
where Fr is the tensile force between root system particles (N); k is the elasticity coefficient of the particles in series (N/m); k1 and k2 are the elastic coefficients of two spheres (N/m); and x1 and x2 are the particle spacing between two spheres (m).
With the exception of microscopic parameters employed, all three forms of interactions were modeled using the same contact formula. A double-sphere validation test was carried out between root particles to confirm that the parallel bond model could accurately represent the maximum tensile force of root systems. To record the relationship between tension and strain, we moved the small sphere away from the fixed end at a predetermined velocity, as seen in Figure 4b.
The tension-strain curve of root systems, including its peak tension and slope, was compared with numerical simulation curve through pullout test. The results were validated by extending the conclusion to the other two types of root systems. According to Wang et al. (2016), the chosen parameters were able to replicate the root system's maximum withdrawal force with accuracy. Table 3 displays the particular microscopic parameters.
Table 3 Calibration value of each mesoscopic parameter
Parameter and unit Symbol Calibrated value
Linear model normal stiffness (N/m) kn 1×10⁶
Linear model stiffness ratio k* 2.0
Linearpbond model stiffness (N/m) kt n 1×10⁷
Linearpbond model stiffness ratio $\overline{k_{{}}^{\text{*}}}$ 2.0
Normal stiffness between soil and wall (N/m) kw n 1×10⁶
Root effective modulus (MPa) Eo 1×10⁶
Root bond effective modulus (MPa) Ep 1×10⁷
Adhesive force between root particles (MPa) pb_coh 1×10⁷
Tensile strength between root particles (MPa) pb_ten 1×10⁷
Friction coefficient between root particles (°) pb_fa 30
Damping ratio $\xi $ 0.5
Soil particle-particle friction coefficient ${{\mu }_{\text{b}}}$ 0.1
Soil particle-wall friction coefficient ${{\mu }_{\text{w}}}$ 0
Particle density (kg/m3) ${{\rho }_{\text{b}}}$ 2660
Porosity $n$ 0.12
Shear rate (mm/min) - 0.1
Intrinsic length scale ratio ${{d}_{\text{min}}}/D$ 1×10⁻⁴

Note: - means no symbol.

3.2.2 Calibration of RSCs parameters

To make sure that the results of numerical simulation matched the findings of indoor direct shear test, the model had to have its parameters calibrated. The tension between particles in the presence of water generally resulted in inherent tensions within the sand. Consequently, the model had to take into account the existence of these internal tensile stresses (Tang et al., 2000; Sui et al., 2021). The lack of tangential stiffness in the linear bond contact model prevented it from withstanding tangential moments, even if it could simulate tension between particles. On the other hand, the parallel bond model could tolerate a certain degree of bending moment in addition to tension. A linear bond contact model was therefore used to simulate the interaction between root systems and between roots and soil.
The experiment utilized an optimal moisture content of 14.2% and a corresponding maximum dry density of 1.6 g/cm3 for sample preparation. The pre-prepared soil samples were compacted into ring-shaped specimens, with dimensions measuring 20.0 mm in height and 61.8 mm in diameter, using static pressure. To ensure sufficient consolidation between roots and soil, we allowed the prepared RSCs specimens to consolidate for 24 h prior to the shear test. The strain-controlled direct shear instrument was adopted to conduct the rapid shear test, as the sliding failure of the bank slope typically occurs within a relatively short timeframe. Vertical pressures of 100, 200, 300, and 400 kPa were applied respectively, with a shear rate of 0.8 mm/min. The corresponding shear stresses were determined by Equation 6.
$\tau \mathrm{=}\frac{CN}{A}\times 10$,
where τ is the shear stress (kPa); C is the ring shear factor (N/0.01 mm); N is the indication of dial gauge (mm); and A is the area of ring cutter (cm2).
During the experimental process, the maximum shear stress was considered as the soil's shear strength. Based on the Mohr-Coulomb failure criterion, we determined the relationship between soil's internal friction angle (Tien et al., 1979) and cohesion with shear strength by Equation 7:
${{\tau }_{f}}\mathrm{=}\sigma \tan \varphi +c$,
where τf is the shear strength (kPa); σ is the vertical stress (kPa); φ is the friction angle (°); and c is the cohesion (kPa).
DEM simulation for direct shear test was similar to the indoor experiments, where a linear model was used to simulate the sand. Micro-scale calibration was carried out with reference to the macroscopic parameters obtained from physical and mechanical experiments.
To get simulation results under various vertical stresses, we changed the model parameters in accordance with physical data. The shear strength curves of remodeled soil and RSCs under normal loads ranging from 100 to 400 kPa are depicted in Figure 5. The simulation results for both samples exhibited consistency in terms of initial modulus, peak shear stress, and trend. A common feature observed was that the shear stress increased with increasing shear displacement, while the slope of curve remained relatively consistent across different confining pressures for a given sample. However, after reaching the peak shear stress, there were differences in strain-softening behaviors between remodeled soil sample and RSCs. Specifically, the simulated soil sample demonstrated evident strain-softening behavior due to its uniformly round particle shape, resulting in reduced interlocking effects when subjected to increased external load (Carrasco et al., 2022). Conversely, within the composite system, irregularly shaped roots contributed greater shear strength compared with soil particles alone. This result led to more and stronger contacts throughout the sample as well as enhanced interlocking effects among particles (Yang and Li, 2019). Consequently, particle interlocking continued to function by further mitigating the softening behavior of samples even after reaching the peak shear stress.
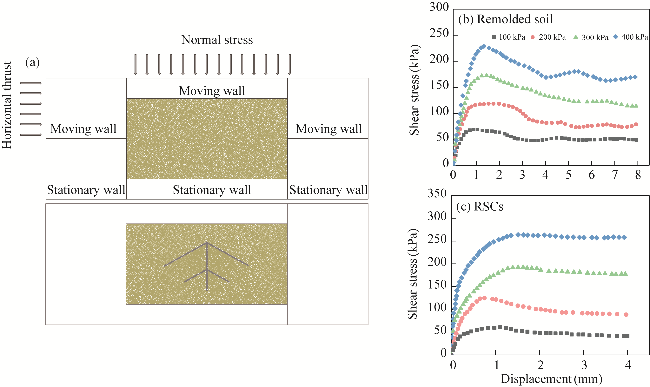
Fig. 5 Simulation sample and fitting results. (a), shear simulation diagram; (b), shear stress-displacement fitting curve of remolded soil; (c), shear stress-displacement fitting curve of RSCs.

4 Results

4.1 Different root types in RSCs

Figure 6a and b presents a relationship of shear stress and volumetric strain with displacement for four sets of specimens under normal stress of 100 kPa. The three RSCs showed initial shear stress characteristics that were comparable to remolded soil: shear stress steadily stabilized after reaching its maximum strength, and a notable strain hardening phenomenon was noted. In comparison with remolded soil, the shear strength of vertical, claw-type, and horizontal RSCs increased by 21.8%, 19.8%, and 9.7%, respectively.
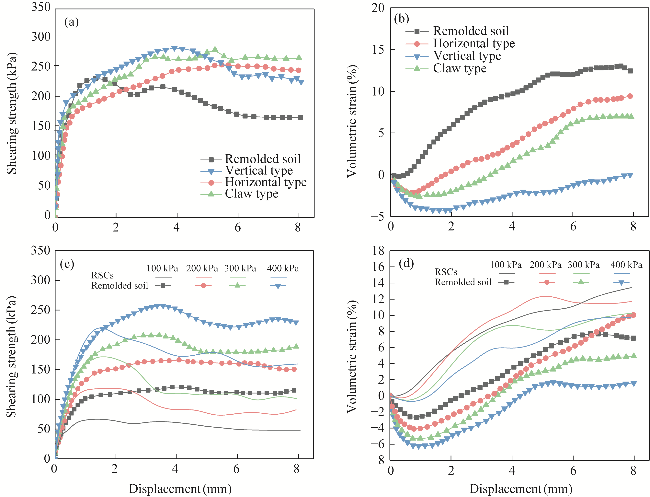
Fig. 6 Relationships among shear stress, volumetric strain, and displacement. (a), stress-displacement relationship for four groups of samples; (b), strain-displacement relationship for four groups of samples; (c), stress-displacement relationship of vertical type specimen under different normal stresses; (d), strain-displacement relationship of vertical type specimen under different normal stresses.
As can be seen in Figure 6a, the initial shear stress of remolded soil increased rapidly as the shear displacement increased. However, after reaching the shear peak, the strain softened noticeably, causing a rapid decrease in shear strength. In the presence of identical normal stress conditions, the three RSCs showed longer times to reach the shear peak and higher peak shear stress, suggesting that the presence of roots strengthened the soil's shear strength by acting as a framework support.
It was noted from Figure 6b that all four sets of specimens first underwent shear contraction and subsequently shear dilation as the shear displacement increased. Shear dilation was the primary characteristic of weak shear contraction in remolded soil. There were different degrees of enhanced shear contraction once the reinforcement was added. Soil dilatation was reduced and shear contraction was heightened by the addition of roots. The following ranking of the soil's shear dilation behavior would suggest a favorable link between the addition of RSCs and the reduction of shear dilation: remolded soil>horizontal type>claw type>vertical type. Roots' ability to establish adequate contact between root systems and soil particles created a network anchor structure that, in part, trapped more soil particle aggregates. These particle aggregates filled in the spaces left by the larger soil particles' force chains and improved the inter-particle bonding. Out of the three varieties of roots, the specimen of vertical type showed the least amount of shear dilation and the least noticeable softening effect.

4.2 Vertical stress in RSCs

Correlations of shear stress and volumetric strain with displacement are established by applying various normal stresses, as shown in Figure 6c and d. Figure 6c and d showed that the shear stress peak for the remolded soil sample and the vertical RSCs sample progressively rose during the shearing operation. Furthermore, the volumetric strain-displacement curves for both groups of samples showed a progressive drop in their initial slope, which suggested a rise in shear contraction. The samples' internal soil particle connections tightened as the normal stress rose, increasing the samples' overall cohesiveness. This result implied that there was a positive relationship between shear contraction and shear stress peak values. Additionally, the degree of softening rose as normal stress increased for both sets of samples; however, the vertical RSCs sample showed less strain softening than the remolded soil sample. Additionally, strain softening started in the remolded soil samples at 100 kPa, whereas it started in the vertical RSCs at 200 kPa. To some degree, strain softening may be reduced in the presence of vertical roots.

4.3 Influence of root system on contact forces

Typically, the tangential and normal forces between particles form force chain networks. The patterns of stress transmission and particle movement in the sample could be examined by looking at the force chain network that forms during shearing. The distribution of force chains' length and number revealed details on the structural properties of particle packing as well as the interaction between particles.
A comparative diagram of force chain networks under shearing conditions for four sets of samples at a normal stress of 100 kPa is shown in Figure 7. The remolded soil sample displayed homogenous material, as seen in Figure 7a, meaning that shear forces were dispersed equally throughout the samples during shearing. Strong force chains, with a maximum force chain strength of only 11.2 kN, were comparatively evenly distributed throughout the interior at later stages of shearing, but their overall strength was lower, suggesting a reduced resistance to shear failure.
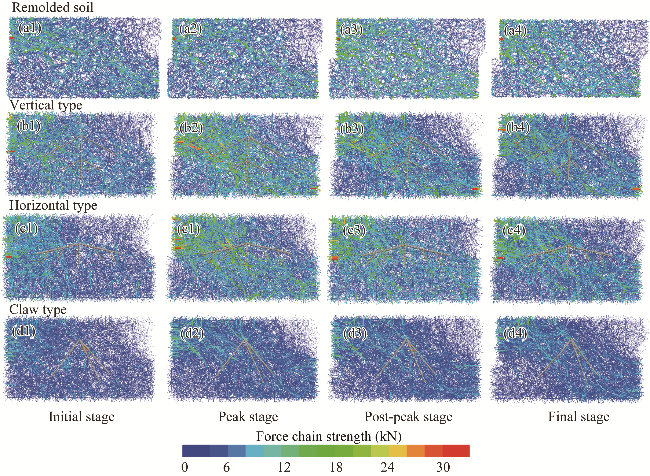
Fig. 7 Comparison of force chain strength of four groups of samples during shearing process. (a1-a4), remolded soil; (b1-b4), vertical type; (c1-c4), horizontal type; (d1-d4), claw type.
The reinforcement offered by plant roots clearly increased the force chain network's overall strength, as seen in Figure 7b-d. For the vertical, claw-like, and horizontal RSCs, the highest force chain strengths under the normal stress of 100 kPa were 34.8, 31.7, and 16.7 kN, respectively. As the particles packed tightly after reaching the shear peak, the strong force chains progressively condensed inside the roots' distribution region. These chains were primarily dispersed in an approximate diagonal pattern on the left side of the higher shear box and the right side of the lower shear box. During the later stages of shearing, the three reinforced soil samples' weak force chains gradually shrank while the strong force chains rearranged and interacted with the weaker force chains around them to form a more distinct force chain distribution in the diagonal region. Among these, the vertical root sample created an internal force chain network that was both comprehensive and interconnected, suggesting a well-organized particle arrangement as well as strong cohesion and shear strength. Strong force chain areas were arranged as follows: vertical type>horizontal type>claws type.

4.4 Influence of root systems on velocity field

In order to better understand how particles interact with one another and investigate how they deform and fail during test, it may be possible to determine the force conditions of particles based on their speed and direction of motion. With four sets of samples and a normal stress of 100 kPa, Figure 8 shows the fluctuation in velocity fields during shearing process. As shown in Figure 8, kinetic energy was first transmitted from the inner walls of specimen to adjacent particles during the early stages of shearing. The specimens 'top walls' velocity vectors on each side converged toward the shear box's center, creating vortices inside the lower shear box. The velocity field within the specimen exhibited a hierarchical difference at reaching the peak shear stress, and thereafter, as the shearing progressed, the velocity fell progressively.
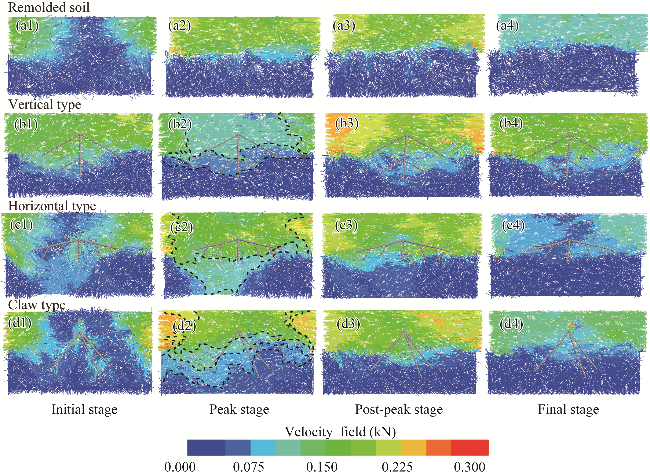
Fig. 8 Comparison of velocity field of four groups of samples during shearing process. (a1-a4), remolded soil; (b1-b4), vertical type; (c1-c4), horizontal type; (d1-d4), claw type.
Upon introducing roots into the soil, a continuous transition zone developed within the specimen upon reaching the peak shear stress, as demonstrated in Figure 8b-d. Particles inside the soil traveled more slowly than those outside the roots, and the velocity of particles was lower near the roots than elsewhere. The early chaos in particle motion gave way to a more consistent direction. The presence of roots primarily contributed to the early stage of shearing until the shear stress reached its peak, unifying the direction of particle motion within the specimen. In the later stage of shearing, there was little difference in the velocity field between samples with and without roots. Soil particles in the remolded soil samples' lower shear box remained disorganized throughout the shearing operation, as shown in Figure 8. This result provided additional evidence that roots could impede soil particle migration during shear, minimizing the amount of soil damage and deformation.

4.5 Shear band

The range of shear band during shearing process was closely associated with particle displacement, which could be categorized into three degrees: highly mobile particles, fixed particles, and relatively mobile particles. Both highly mobile and fixed particles could be considered non-load-bearing entities during shearing process. Consequently, the shear zone was consisted of those particles that moved towards each other.
Four sets of samples were exposed to the same horizontal thrust at a normal stress of 100 kPa. The deformation results of the shear bands are shown in Figure 9. During the initial phase of shearing, the particles in each of the three groups of RSCs were dispersed evenly and exhibited minimal displacement or deformation. During the intermediate shearing stage, there was a discernible displacement and deformation of particles surrounding the walls and root systems due to an increase in shear stress, which eventually resulted in the formation of entire and continuous shear bands. The continuous shear bands that had developed during the late stage of shearing eventually thinned out at both ends of root systems as the shear tension stabilized and they stretched from transverse to longitudinal development.
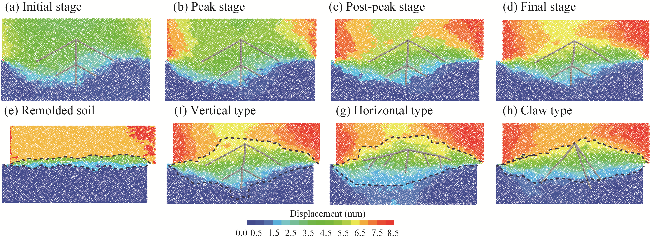
Fig. 9 Shear band evolution of vertical type root under different stages (a-d) and four groups of root samples (e-h)
Each of the four sample groups showed clearly different shear band ranges, with the soil samples having the shortest range and the particles showing more noticeable stretching and dislocation within it. The friction and cohesiveness of the soil increased as a result of the formation of root systems because root expanded the contact area between soil particles. Tensile strength of RSCs increased and deformation decreased as the shear bands broadened because more soil particles distributed the initially concentrated stress. Vertical RSCs had the greatest longitudinal depth for shear bands, as seen in Figure 9. This phenomenon resulted in the greatest increase in friction and cohesion between soil particles and the least amount of deformation within the shear band area. The width of shear bands followed the order of vertical type>horizontal type>claw type>remolded soil.

4.6 Fabric diagram

Figure 10 shows the composition of contact number of four groups of specimens during loading at a vertical stress of 100 kPa. As shown in Figure 10a, the inner walls of the two shear boxes restricted the soil on both sides as the sample compressed in the shear direction during shear process, increasing tension at the ends of top shear box. In relation to shear motion, the direction of acute angles caused an increase in the contact number inside the samples. Reduced contact numbers resulted from the energy loss that occurred during soil particle movement, which loosened soil particle structures in normal direction. The isotropy of particles was usually assessed by the degree of homogeneity in the composition diagram of normal contact numbers.
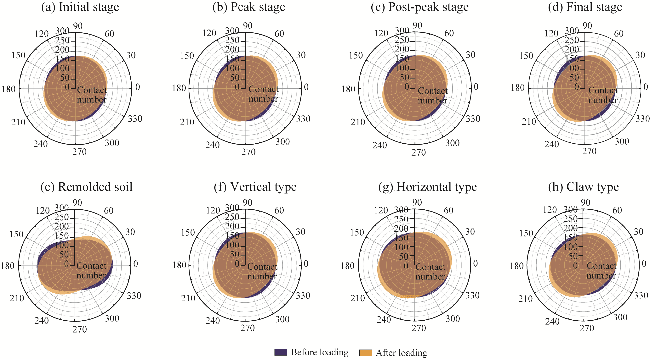
Fig. 10 Homogeneity of contact number distribution of vertical type root under different stages (a-d) and four groups of root samples (e-h)
Homogeneity of contact number distributions varied significantly among four groups of samples, as shown in Figure 10b. Undisturbed soil samples had the highest aspect ratio, reflecting the sample's strongest anisotropy. A vertical-type sample exhibited good isotropy in various directions and had strong vertical limitations on soil particles due to the uniform and symmetrical distribution of roots in the soil. As a result, there was a nearly circular composition diagram of contact numbers due to the relatively uniform distribution of contact numbers between particles. Although there were fewer lateral roots in claw type roots than in vertical type roots, the distribution pattern of roots in the soil was still similar to that of vertical type roots, suggesting less restriction on soil particles. With horizontal type roots, there were more contact numbers along the direction of shear motion because the roots were concentrated horizontally in the soil. The four groups of samples had varying degrees of isotropy. This result implies that adding roots to the soil improves the strength of RSCs and makes them more resilient to external stresses coming from different directions.

5 Discussion

5.1 Root mechanical mechanism

Past studies primarily focused on the diameter and density of root systems. However, little was known about the coordination between different types of root systems (Lu et al., 2023). Based on the field investigation results, Zong et al. (2018) found that the root diameter of dominant vegetation along the Tarim River was positively correlated with tensile strength. The mechanical response of RSCs with various root types under shear stress was investigated through numerical simulation. The numerical simulation offered a multifaceted examination of efficient resistance of root systems to outside influences. In this paper, the shear stress-displacement and deformation of RSCs in 100-400 kPa were compared. With increasing depth of soil layers, the shear stress of RSCs decreased slightly after reaching its peak, whereas the shear stress of remolded soil showed a significant decrease after reaching its peak. This phenomenon was also observed by Wang et al. (2010) in direct shear tests. The shear stress peak is positively correlated with shear ability (Sadek et al., 2011; Yang and Li, 2019), which is the effect of mechanism of root systems (Gray and Ohashi, 1983). With changes in root types, there were noticeable differences in the shear compressibility of RSCs, with the highest shear compressibility observed in the vertical root-soil composite, and the most pronounced dilatation in remolded soil. When root types were consistent, the shear shrinkage properties of RSCs were primarily influenced by normal force applied during shearing, with greater normal forces resulting in increased shrinkage properties and reduced shear dilatation properties of RSCs (Wang et al., 2021).
The microscopic analysis focuses on the interaction between particles, such as force chain network formed by contact of multiple particles, the velocity field resulting from particle displacement under external forces, the number of contacts in different directions, and grid shear bands (Dai et al., 2015). Through further understanding of the role of roots in slope protection engineering, the influence of different root levels on soil stability can be further studied, solving a series of geological problems such as soil erosion and slope instability.
When subjected to external forces in the same direction, the internal particles of RSCs formed a continuous force chain network due to their own inertia and the cohesive action of roots. Vertical RSCs have a higher density of force chain networks and require higher shear damage forces. The reason for this is the greater range of action of root systems and the fact that, due to its structural peculiarities, an anchoring structure is formed all around shear surface (Ruff et al., 1987; Allmaras and Logsdon, 2019). The simulation results showed that the three types of root systems within the distribution of shear zone underwent different degrees of deformation, and the more uniform the distribution of root systems in all directions, the larger the area of shear zone and the smaller the degree of deformation (Liang and Chao, 2017). The reason for this is that the tensile force generated by root systems along the direction of deformation is decomposed into components perpendicular to the shear surface and parallel to the shear surface to jointly resist the deformation of the soil (van Beek et al., 2005a, b).
Combined with the results of field study, it was found that when the main root was surrounded by a large number of lateral roots, root systems came into full contact with the soil particles to form a web-anchored structure when the specimen was subjected to shear, which to a certain extent retained a larger number of small soil particles, thus filling in the gaps in the force chain formed by larger soil particles and enhancing the bonding effect between soil particles (Scippa et al., 2006; Wang et al., 2018). The root tensile force and surface friction are different due to the differences in fiber content and distribution range of different root systems. When the root tensile force is higher in the specimen, it can provide a greater resistance to shear damage in the soil, which leads to a higher peak shear stress (Wen et al., 2016). Thus, the soil particles inside RSCs show different degrees of cohesion. When the root tensile force in the sample is high, it can provide the soil with greater resistance to resist shear damage, so that the soil reaches a high peak shear stress.

5.2 Numerical simulation prospect

The study assumed uniform tensile strength across different root segments during root system simulation, despite conducting microscopic analysis and physical trials (Zhang et al., 2023). It did not take into consideration differences in tensile strength across root segments that differed in diameter or location. In this study, the tensile strength of different root segments was assumed to be uniform, but did not consider differences in tensile strength of root segments with different diameters or different locations. The results of the study are limited to a two-dimensional plane, and two-dimensional simulations may not adequately capture the possibility of more complex particle arrangements, particle aggregation, and more extensive force chain networks in three-dimensional systems. This means that this study may not have taken into account all of the complex three-dimensional scenarios in real-world engineering or natural systems (Bourrier et al., 2013; Huang et al., 2023). Soil consolidation effect of vertical, horizontal, and claw type roots was compared and analyzed in this study. In addition to the three types of roots mentioned in this study, some scholars have summarized other root distribution types (Li et al., 2016), but due to the limitations of the study area and experimental apparatus, the other root types are not fully investigated and discussed in this study. Meanwhile, fine root whiskers were ignored when simulating root systems, leading to a larger error in the simulation accuracy (Li et al., 2016; Li et al., 2020). Nowadays, various computer capture techniques have been fully developed, and this topic can be combined with image scanning technology (Chen et al., 2011, 2018) and programming software such as OpenGL (Song and Lu, 2020) to improve simulation accuracy in future research. In practical engineering settings, despite microscopic analysis and physical tests, a more accurate assessment of stability is needed to take into account the three-dimensional soil structure and stress fluctuations in different root segments. To sum up, in future studies, attention should be paid to the macroscopic influence of size effect on slope protection by vegetation, stress fluctuation of different root segments, and soil consolidation effect of root types for a more accurate assessment.

6 Conclusions

Effects of root morphology on mechanical behavior and shear strength of the sandy soil were verified by laboratory test and numerical simulation. Substantial strain softening happened during shear stress process and the undisturbed soil samples attained their maximal shear stress. Soil samples containing RSCs showed notable strain hardening and took longer time to reach the peak shear stress. The soil's shear dilatation was enhanced by the presence of root systems, while its shear contraction was decreased. Movement speed of soil particles near root systems was significantly lower than those at the other locations, and root systems could play a certain role in hindering the movement of soil particles, thus reducing the degree of soil deformation and damage. Moreover, more obvious multi-layer transition zones were formed in the samples of three groups of RSCs. Roots increased the contact area between soil particles, and the shear zone range of the three groups of RSCs increased. As the shear zone widened, more soil particles dispersed the stress originally concentrated, the deformation gradually weakened, and the tensile strength of complex increased. Composition of contact groups in each direction showed that the length-to-width ratio of remolded soil was the largest, the vertical type roots were more evenly distributed in the soil, and isotropy of the particles was the most obvious. The results confirmed that plant root system could play a great role when soil body was subject to shear damage and water erosion. The root system could effectively slow down the scouring and erosion of the soil by forming a net-like structure and closely connecting soil particles, which was beneficial for the conservation of sandy soil.

Conflict of interest

The authors declare that they have no known competing financial interests or personal relationships that could have appeared to influence the work reported in this paper

Acknowledgements

This research was funded by the Key Research and Development Task of Xinjiang Uygur Autonomous Region, China (2022B03024-3). The authors would like to thank the Itasca Consulting Group, America, for the support in providing Particle Flow Code (PFC) software.

Author contribution

Conceptualization: ZHANG Lingkai, SUN Jin; Methodology: SHI Chong, SUN Jin, ZHANG Lingkai; Formal analysis: ZHANG Lingkai, SHI Chong; Writing - original draft preparation: SUN Jin, ZHANG Lingkai; Writing - review and editing: ZHANG Lingkai, SHI Chong, SUN Jin; Funding acquisition: ZHANG Lingkai, SHI Chong; Resources: ZHANG Lingkai, SHI Chong; Supervision: ZHANG Lingkai, SHI Chong. All authors approved the manuscript.
[1]
Allmaras R R, Logsdon S D. 2019. Soil Structural Influences on the Root Zone and Rhizosphere. Boca Raton: CRC Press, 47.

[2]
Armengaud P, Zambaux K, Hills A, et al. 2009. EZ-Rhizo: Integrated software for the fast and accurate measurement of root system architecture. The Plant Journal, 57(5): 945-956.

[3]
Augusto L, Achat D L, Bakker M R, et al. 2015. Biomass and nutrients in tree root systems-sustainable harvesting of an intensively managed Pinus pinaster (Ait.) planted forest. Global Change Biology Bioenergy, 7(2): 231-243.

[4]
Badhon F F, Islam M S, Islam M A, et al. 2021. A simple approach for estimating contribution of vetiver roots in shear strength of a soil-root system. Innovative Infrastructure Solutions, 6(2): 96, doi: 10.1007/s41062-021-00469-1.

[5]
Bai H, Li R D, Wang W B, et al. 2021. Investigation on parameter calibration method and mechanical properties of root-reinforced soil by DEM. Mathematical Problems in Engineering, 2021(19): 6623489, doi: 10.1155/2021/6623489.

[6]
Bischetti G B, Chiaradia E A, Simonato T, et al. 2005. Root strength and root area ratio of forest species in Lombardy (northern Italy). Plant and Soil, 278(1-2): 11-22.

[7]
Bourrier F, Kneib F, Chareyre B, et al. 2013. Discrete modeling of granular soils reinforcement by plant roots. Ecological Engineering, 61(1): 646-657.

[8]
Carrasco S, Cantor D, Ovalle C. 2022. Effects of particle size shape correlations on steady shear strength of granular materials: The case of particle elongation. International Journal for Numerical and Analytical Methods in Geomechanics, 46(5): 979-1000.

[9]
Chancellor W J. 1994. Advances in soil-plant dynamics. In: Advances in Soil Dynamics Volume 1. Missouri: American Society of Agricultural and Biological Engineers Press, 255-280.

[10]
Chen F Q, Zhou X C, Li Y H, et al. 2018. Design and implementation of plant root 3D architecture measurement system. Computer Engineering and Applications, 54(10): 249-255. (in Chinese)

[11]
Chen Y G, Zhou X C, Le K. 2011. New method for region growing segmentation of plant root CT image sequences. Computer Engineering and Applications, 47(28): 158-161. (in Chinese)

[12]
Coppin N J, Richards I G. 1990. Use of vegetation in civil engineering. Choice Reviews Online, 28(5), 2750-2750.

[13]
Cundall P A. 1971. Proceedings of the Symposium of the International Society of Rock Mechanics. Rotterdam: Balkema.

[14]
Cundall P A, Strack O D L. 1979. A discrete numerical model for granular assemblies. Geotechnique, 29(1): 47-65.

[15]
Dai B B, Yang J, Luo X D. 2015. A numerical analysis of the shear behavior of granular soil with fines. Particuology, 21: 160-172.

[16]
de Bauw P, Mai T H, Schnepf A, et al. 2020. A functional-structural model of upland rice root systems reveals the importance of laterals and growing root tips for phosphate uptake from wet and dry soils. Annals of Botany, 126(4): 789-806.

[17]
Endo T. 1980. Effect of tree roots upon the shear strength of soil. Japan Agricultural Research Quarterly, 14(2): 112-115.

[18]
Finér L, Ohashi M, Noguchi K, et al. 2011. Factors causing variation in fine root biomass in forest ecosystems. Forest Ecology and Management, 261(2): 265-277.

[19]
Gray D H, Ohashi H. 1983. Mechanics of fiber reinforcement in sand. Journal of Geotechnical Engineering, 109(3): 335-353.

[20]
Graziani A, Rossini C, Rotonda T. 2012. Characterization and DEM modeling of shear zones at a large dam foundation. International Journal of Geomechanics, 12(6): 648-664.

[21]
Hirano Y, Dannoura M, Aono K, et al. 2009. Limiting factors in the detection of tree roots using ground-penetrating radar. Plant and Soil, 319(1-2): 15-24.

[22]
Hu C H, Wang Y G, Guo Q C, et al. 2005. Fluvial Process and Regulation of the Main Stem Tarim River. Beijing: Science Press. (in Chinese)

[23]
Huang Y, Ding J W, Sun W C, et al. 2023. Evaluating the shear behavior of rooted soil by discrete element method simulations in two dimensions. Plant and Soil, 493(1): 355-373.

[24]
Islam M S, Arif M Z U, Badhon F F, et al. 2016. Investigation of vetiver root growth in sandy soil. In:Proceedings of the BUET-ANWAR ISPAT 1st Bangladesh Civil Engineering Summit. Dhaka, Bangladesh, 62-69.

[25]
Jafari M, Tahmoures M, Ehteram M, et al. 2022. Slope stabilization methods using biological and biomechanical measures. In: Soil Erosion Control in Drylands. Cham: Springer, 445-647.

[26]
Jin K, Shen J B, Ashton R W, et al. 2013. How do roots elongate in a structured soil. Journal of Experimental Botany, 64(15): 4761-4777.

[27]
Karizumi N, Tsutsumi T. 1958. A reference of the root systems on the forest trees (to 1955). Journal of the Japan Forestry Society, 40(5): 202-223.

[28]
Kirby J M, Bengough A G. 2002. Influence of soil strength on root growth: experiments and analysis using a criticalstate model. European Journal of Soil Science, 53(1): 119-127.

[29]
Li Q, Yang J C, Zhang J Q, et al. 2020. Progress of research on soil erosion resistance of plant roots and future prospects. Journal of Agricultural Resources and Environment, 37(1): 17-23. (in Chinese)

[30]
Li Y P, Wang Y Q, Ma C, et al. 2016. Influence of the spatial layout of plant roots on slope stability. Ecological Engineering, 91: 477-486.

[31]
Liang C, Xu C. 2017. State of the art and prospect of shear band in reinforced soil. Journal of Yangtze River Scientific Research Institute, 34(2): 23-28. (in Chinese)

[32]
Linde J V D. 2007. Discrete element modeling of a vibratory subsoiler. PhD Dissertation. Stellenbosch: University of Stellenbosch.

[33]
Lu J R, Li Y L, Tan Z Q, et al. 2023. Review on quantification of root-induced change of soil hydraulic parameters. Acta Pedologica Sinica, 60(4): 939-952. (in Chinese)

[34]
Manohar D R, Anbazhagan P. 2021. Shear strength characteristics of geosynthetic reinforced rubber sand mixture. Geotextiles and Geomembranes, 49(4): 910-920.

[35]
Mao Z, Yang M, Bourrier F, et al. 2014. Evaluation of root reinforcement models using numerical modelling. Plant and Soil, 381: 249-270.

[36]
Mickovski S B, Stokes A, Beek R V, et al. 2011. Simulation of direct shear tests on rooted and nonrooted soil using finite element analysis. Ecological Engineering, 37(10): 1523-1532.

[37]
Ni J J, Leung A K, Ng C W W, et al. 2017. Investigation of plant growth and transpiration-induced matric suction under mixed grass-tree conditions. Canadian Geotechnical Journal, 54(4): 561-573.

[38]
Ni J J, Leung A K, Ng C W W, et al. 2018. Modelling hydro-mechanical reinforcements of plants to slope stability. Computers and Geotechnics, 95: 99-109.

[39]
Ni J J, Xiao Y, Shi J Q, et al. 2024. Soil bioengineering using vegetation under climate change. Biogeotechnics, 2(1): 100067, doi: 10.1016/j.bgtech.2023.100067.

[40]
Oda M. 1972. Initial fabrics and their relations to mechanical properties of granular material. Soils and Foundations, 12(1): 17-36.

[41]
Operstein V, Frydman S. 2000. The influence of vegetation on soil strength. Proceedings of the Institution of Civil Engineers-Ground Improvement, 4(2): 81-89.

[42]
Perkons U, Kautz T, Uteau D, et al. 2014. Root-length densities of various annual crops following crops with contrasting root systems. Soil and Tillage Research, 137: 50-57.

[43]
Rothenburg L, Bathurst R J. 1989. Analytical study of induced anisotropy in idealized granular material. Geotechnique, 39(4): 601-614.

[44]
Ruff M S, Krizek D T, Mirecki R M, et al. 1987. Restricted root zone volume: Influence on growth and development of tomato. Journal of the American Society for Horticultural Science, 112(5): 763-769.

[45]
Sadek M A, Chen Y, Liu J. 2011. Simulating shear behavior of a sandy soil under different soil conditions. Journal of Terramechanics, 48(6): 451-458.

[46]
Saint C C, Meredieu C, Défossez P, et al. 2019. Modelling root system development for anchorage of forest trees up to the mature stage, including acclimation to soil constraints: The case of Pinus pinaster. Plant and Soil, 439: 405-430.

[47]
Schwarz M, Cohen D, Or D. 2011. Pullout tests of root analogs and natural root bundles in soil: Experiments and Modeling. Journal of Geophysical Research: Earth Surface, 116(F2): 1-14.

[48]
Scippa G S, Di Michele M, Di Iorio A, et al. 2006. The response of Spartium junceum roots to slope: Anchorage and gene factors. Annals of Botany, 97(5): 857-866.

[49]
Shikora S A. 2000. Techniques and procedures: Surgical treatment for severe obesity: The state of the art for the new millennium. Nutrition in Clinical Practice, 15(1): 13-22.

[50]
Song W L, Lu L. 2020. Three-dimensional visual image reconstruction simulation of plant roots. Computer Simulation, 37(12): 404-408. (in Chinese)

[51]
Strack O D L, Cundall P A. 1978. The Distinct Element Method as a Tool for Research in Granular Media, Part 1. Minneapolis:University of Minnesota Press.

[52]
Sui Z F, Yi W, Lu Y G, et al. 2021. Experimental and numerical simulation study on the shear strength characteristics of magnolia multiflora root-soil composites. Advances in Civil Engineering, 2021(14): 6642594, doi: 10.1155/2021/6642594.

[53]
Suleiman M K, Bhat N R, Jacob S. 2013. Vetiveria zizanoides plantation for slope stabilization in Kuwait: A case study. Journal of Agriculture and Biodiversity Research, 2(2): 44-54.

[54]
Tang C A, Tham L G, Lee P K K, et al. 2000. Numerical studies of the influence of microstructure on rock failure in uniaxial compression—part II: Constraint, slenderness and size effect. International Journal of Rock Mechanics and Mining Sciences, 37(4): 571-583.

[55]
Tien H W, William P M III, Douglas N S. 1979. Strength of tree roots and landslides on Prince of Wales Island, Alaska. Canadian Geotechnical Journal, 16(1): 19-33.

[56]
van Beek L P H, Wint J, Cammeraat L H, et al. 2005a. Observation and simulation of root reinforcement on abandoned Mediterranean slopes. Plant and Soil, 278(1-2): 55-74.

[57]
van Beek L P H, Wint J, Cammeraat L H, et al. 2005b. Root reinforcement on abandoned Mediterranean slopes as measured by in situ direct shear stress tests and root pull-out tests. Plant and Soil, 278: 135-147.

[58]
Wai N C W, Qi Z, Chao Z, et al. 2022. Eco-geotechnics for human sustainability. Science China Technological Sciences, 65(12): 2809-2845.

[59]
Wang C L, Liu J, Xing H W, et al. 2010. Friction properties of interface between soil-roots and soil-soil of Artemisia sphaerocephala and Sabina valgaris. In: Proceedings of the 4th International Conference on Bioinformatics and Biomedical Engineering. Chengdu, China, 1-5.

[60]
Wang S Y, Zang L K, Chen G X, et al. 2021. Parameter inversion and direct shear simulation of discrete element model of soil-rock mixture based on 3D scanning technology. Materials Reports, 35(10): 10088-10095, 10108. (in Chinese)

[61]
Wang Y, Du F, Zhou M, et al. 2018. Research on shear strength of root-soil composite in a forest and grass standing site in Northern Shanxi. Research of Soil and Water Conservation, 25(2): 213-219. (in Chinese)

[62]
Wang Z J, Jacobs F, Ziegler M. 2016. Experimental and DEM investigation of geogrid-soil interaction under pullout loads. Geotextiles and Geomembranes, 44(3): 230-246.

[63]
Wen W, Li Y R, Li G F, et al. 2016. Study on the effect of herbaceous plants roots reinforcement on soil under the condition of different confining pressure. Chinese Quarterly of Mechanics, 37(1): 124-130. (in Chinese)

[64]
Wu Y K, Li Y B, Niu B. 2015. Investigation of mechanical properties of randomly distributed Sisal fibre reinforced soil. Materials Research Innovations, 18(Suppl. 2): 953-959.

[65]
Xu X M, Zheng F L, Qin C, et al. 2017. Impact of cornstalk buffer strip on hillslope soil erosion and its hydrodynamic understanding. Catena, 149: 417-425.

[66]
Yan Z X, Song Y, Jiang P, et al. 2010. Mechanical analysis of interaction between plant roots and rock and soil mass in slope vegetation. Applied Mathematics and Mechanics, 31(5): 617-622. (in Chinese)

[67]
Yang S, Li X Q. 2019. Shear simulation and macro meso analysis of sand based on PFC3D. Chinese Journal of Computational Mechanics, 36(6): 777-783. (in Chinese)

[68]
Yao Y S, Li J, Ni J J, et al. 2022. Effects of gravel content and shape on shear behaviour of soil-rock mixture: Experiment and DEM modeling. Computers and Geotechnics, 141: 104476, doi: 10.1016/j.compgeo.2021.104476.

[69]
Zhang S L, Zhao H B, Wang X Z, et al. 2023. Discrete element modeling and shear properties of the maize stubble-soil complex. Computers and Electronics in Agriculture, 204: 107519, doi: 10.1016/j.compag.2022.107519.

[70]
Zhou D, Zhang J. 2003. Slope Protection Engineering Technology with Vegetation. Beijing: China Communications Press. (in Chinese)

[71]
Zobel R W. 2008. Hardware and software efficacy in assessment of fine root diameter distributions. Computers and Electronics in Agriculture, 60(2): 178-189.

[72]
Zong Q L, Feng B, Cai H B, et al. 2018. Mechanism of riverbank protection by desert riparian vegetation roots in Tarim River basin. Chinese Journal of Rock Mechanics and Engineering, 37(5): 1290-1300. (in Chinese)

Outlines

/