
Erosion on marginal slopes of unpaved roads in semi-arid Brazil, and the role of Caatinga vegetation in sediment retention and disconnectivity
Received date: 2024-07-27
Revised date: 2025-01-30
Accepted date: 2025-02-17
Online published: 2025-08-13
Vegetation plays a major role in soil protection against erosion effects, and studies have also highlighted its importance in retaining sediments from roadside slopes. Yet, hydro-sedimentological studies under natural precipitation conditions are still scarce in semi-arid areas due to difficulties in monitoring the few and very concentrated precipitation events. Quantifying sediment connectivity and yield at watershed scale, often highly impacted by the erosion of unpaved roads, is necessary for management plans. This study aims to evaluate the efficiency of native vegetation on roadside slope segments in Caatinga biome in retaining sediments and conserving the soil in a semi-arid area of Brazil. Surface runoff, sediment concentration, and yield measurements were measured from 34 natural precipitation events in four years on two slopes with and without vegetation. The runoff coefficients of the plot with no vegetation varied from 3.0% to 58.0%, while in the vegetated plot, they showed variation from 1.0% to 21.0%. The annual specific sediment yield ranged from 4.6 to 138.7 kg/(hm2•a) for the vegetated plot and from 34.9 to 608.5 kg/(hm2•a) for the unvegetated one. These results indicate a 4 to 12 times higher soil loss on the unvegetated slope in relation to the vegetated one and demonstrate that natural Caatinga vegetation acts as an effective barrier against surface-transported sediments. Moreover, natural Caatinga vegetation present on the slope plays an important role in breaking connectivity between sediment flows from unpaved roads and the watershed drainage system. These findings indicate that investments in unpaved road and roadside slope restoration, not only enhance road infrastructure but also promote environmental gains by reducing the impact of erosion.
Key words: erosion control; road erosion; road slopes; road impact; sediment retention; slope restoration
Teresa Raquel Lima FARIAS , Maria Thereza Rocha CHAVES , Cicero Lima de ALMEIDA , Pedro Henrique Augusto MEDEIROS , José Carlos de ARAÚJO , Joaquín NAVARRO-HEVIA . Erosion on marginal slopes of unpaved roads in semi-arid Brazil, and the role of Caatinga vegetation in sediment retention and disconnectivity[J]. Journal of Arid Land, 2025 , 17(4) : 500 -514 . DOI: 10.1007/s40333-025-0012-z
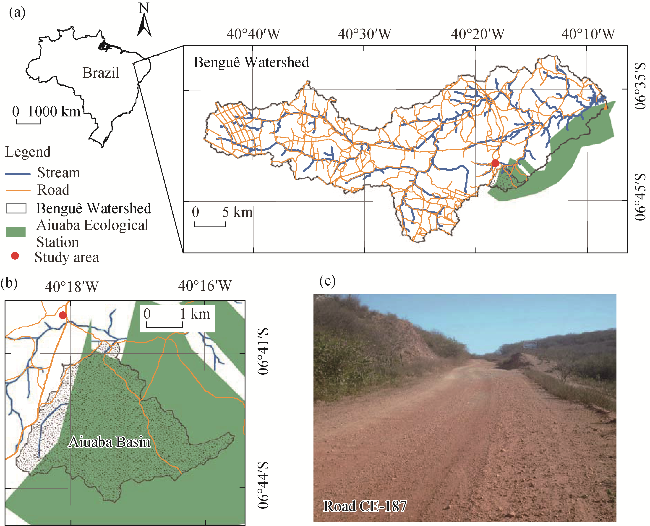
Fig. 1 Location of the study area (a and b) in the semi-arid Brazil and the road (c) where the studied plots are located |
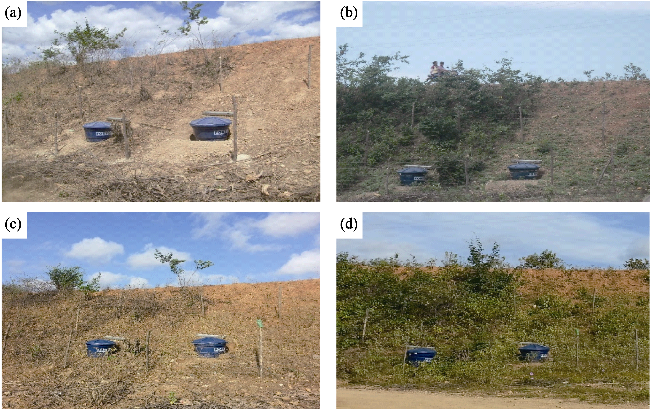
Fig. 2 Roadside slope and plots with and without vegetation. (a), installation of the sediment monitoring systems in September 2012; (b), vegetation recolonization in February 2013; (c), vegetation recolonization in September 2014; (d) vegetation recolonization in January 2016. |
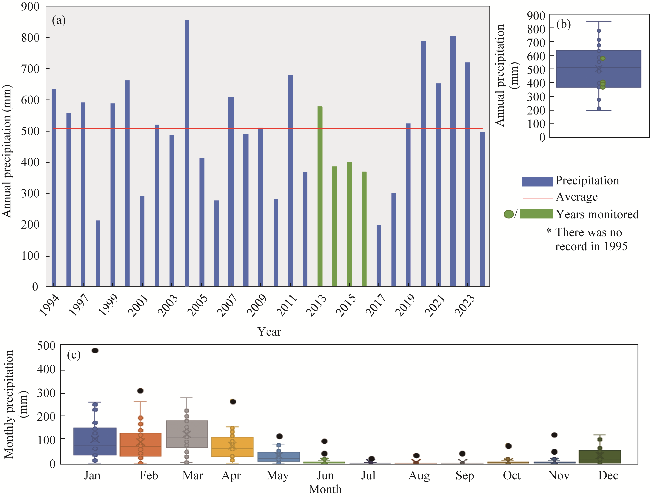
Fig. 3 Precipitation histogram (a), box plots of annual precipitation (b), and monthly precipitation (c) distribution during 1994-2024. Boxes in Figure 3b and c indicate the IQR (interquartile range, 75th to 25th of the data). The median value is shown as a line within the box. Whisker is shown as the mean. Outliers are shown as circles. Bars extend to the most extreme value within 1.5×IQR. Green circles in Figure 3b represent the annual precipitation during monitoring years. |
Table S1 Values for precipitation (P), runoff coefficient (CR), sediment concentration (CS), and sediment yield (SY) on the slopes with and without vegetation during 2013-2016 |
| Event | Date (dd/mm/yyyy) | P (mm) | Slope with vegetation (WV) | Slope with no vegetation (NV) | ||||
|---|---|---|---|---|---|---|---|---|
| CR (%) | CS (mg/L) | SY (kg/hm2) | CR (%) | CS (mg/L) | SY (kg/hm2) | |||
| 1 | 04/01/2013 | 29 | 5 | 653 | 10.1 | 11 | 690 | 21.4 |
| 2 | 16/02/2013 | 53 | 6 | 43 | 1.3 | 6 | 1327 | 41.1 |
| 3 | 26/03/2013 | 42 | 7 | 172 | 5.3 | 7 | 648 | 98.7 |
| 4 | 04/04/2013 | 11 | 7 | 428 | 6.6 | 14 | 1506 | 11.7 |
| 5 | 01/05/2013 | 19 | 16 | 404 | 12.2 | 58 | 395 | 43.8 |
| 6 | 23/06/2013 | 13 | 6 | 117 | 1.8 | 12 | 3010 | 23.3 |
| 7 | 09/09/2013 | 29 | 16 | 65 | 3.0 | 45 | 145 | 19.1 |
| 8 | 20/12/2013 | 64 | 1 | 162 | 1.3 | 5 | 250 | 8.7 |
| 9 | 23/12/2013 | 50 | 3 | 62 | 1.0 | 43 | 342 | 78.0 |
| 10 | 13/01/2014 | 23 | 15 | 79 | 2.7 | 45 | 378 | 37.5 |
| 11 | 31/01/2014 | 12 | 6 | 173 | 1.3 | 7 | 2506 | 19.4 |
| 12 | 04/02/2014 | 31 | 10 | 49 | 1.5 | 17 | 2083 | 105.8 |
| 13 | 11/02/2014 | 44 | 2 | 32 | 0.2 | 23 | 42 | 3.2 |
| 14 | 19/02/2014 | 10 | 8 | 59 | 0.5 | 8 | 82 | 0.6 |
| 15 | 06/03/2014 | 10 | 8 | 102 | 0.8 | 8 | 224 | 1.7 |
| 16 | 18/03/2014 | 15 | 5 | 35 | 0.3 | 35 | 87 | 4.4 |
| 17 | 28/03/2014 | 17 | 4 | 94 | 0.7 | 5 | 205 | 1.6 |
| 18 | 31/03/2014 | 5 | 15 | 60 | 0.5 | 15 | 258 | 2.0 |
| 19 | 02/04/2014 | 37 | 2 | 31 | 0.2 | 8 | 110 | 3.2 |
| 20 | 19/09/2014 | 7 | 16 | 241 | 2.6 | 17 | 315 | 3.4 |
| 21 | 17/11/2014 | 18 | 4 | 48 | 0.4 | 19 | 80 | 2.7 |
| 22 | 24/11/2014 | 32 | 2 | 670 | 5.2 | 11 | 852 | 29.0 |
| 23 | 18/01/2015 | 6 | 13 | 205 | 1.6 | 13 | 245 | 1.9 |
| 24 | 04/02/2015 | 142 | 2 | 29 | 1.0 | 6 | 130 | 11.1 |
| 25 | 20/02/2015 | 31 | 2 | 76 | 0.6 | 3 | 80 | 0.6 |
| 26 | 23/02/2015 | 35 | 2 | 44 | 0.3 | 57 | 75 | 15.0 |
| 27 | 02/03/2015 | 49 | 3 | 32 | 0.5 | 11 | 47 | 2.4 |
| 28 | 06/03/2015 | 27 | 3 | 36 | 0.3 | 3 | 53 | 0.4 |
| 29 | 20/03/2015 | 26 | 3 | 38 | 0.3 | 3 | 445 | 3.5 |
| 30 | 14/01/2016 | 79 | 4 | 139 | 4.9 | 13 | 390 | 39.6 |
| 31 | 21/01/2016 | 88 | 19 | 510 | 85.5 | 30 | 1835 | 489.2 |
| 32 | 25/01/2016 | 42 | 4 | 9 | 0.2 | 8 | 13 | 0.5 |
| 33 | 18/03/2016 | 95 | 21 | 238 | 47.7 | 23 | 249 | 54.1 |
| 34 | 12/05/2016 | 12 | 13 | 26 | 0.4 | 36 | 573 | 25.1 |
| Minimum | 5 | 1 | 9 | 0.2 | 3 | 13 | 0.4 | |
| Maximum | 142 | 21 | 670 | 86.0 | 58 | 3010 | 489.0 | |
| Median | 29 | 6 | 71 | 1.2 | 13 | 254 | 11.4 | |
| Mean | 35 | 7 | 152 | 6.0 | 18 | 579 | 35.0 | |
| Standard deviation | 30 | 6 | 177 | 16.0 | 16 | 758 | 85.0 | |
Table 1 Normalization test and hypothesis for surface runoff, sediment concentration, and sediment yield for samples from slopes with (WV) and without vegetation (NV) |
| Year | Test | Surface runoff | Sediment concentration | Sediment yield | |||
|---|---|---|---|---|---|---|---|
| WV | NV | WV | NV | WV | NV | ||
| 2013 | Shapiro-Wilk test | 0.06 | 0.02 | 0.06 | 0.02 | 0.08 | 0.08 |
| Hypothesis test | 0.04 | 0.01 | 0.01 | ||||
| 2014 | Shapiro-Wilk test | 0.06 | 0.02 | <0.01 | <0.01 | <0.01 | <0.01 |
| Hypothesis test | <0.01 | <0.01 | <0.01 | ||||
| 2015 | Shapiro-Wilk test | <0.01 | <0.01 | <0.01 | 0.02 | 0.04 | 0.04 |
| Hypothesis test | 0.03 | 0.02 | 0.03 | ||||
| 2016 | Shapiro-Wilk test | 0.23 | 0.80 | 0.33 | 0.10 | 0.09 | <0.01 |
| Hypothesis test | 0.15 | 0.23 | 0.42 | ||||
Table 2 Characteristics of the monitored events in the slopes with vegetation (WV) and without vegetation (NV) of the unpaved road |
| Year | Pannual (mm) | Pac (mm) | Paverage (mm) | Number of P events | Average runoff coefficient (%) | Total sediment yield (kg/(hm2•a)) | ||||
|---|---|---|---|---|---|---|---|---|---|---|
| WV | NV | NV/WV | WV | NV | NV/WV | |||||
| 2013 | 575 | 310 | 34.4 | 9 | 6.1 | 19.7 | 3.2 | 42.6 | 345.8 | 8.1 |
| 2014 | 382 | 261 | 20.1 | 13 | 5.8 | 17.7 | 3.0 | 16.9 | 214.5 | 12.7 |
| 2015 | 398 | 316 | 45.1 | 7 | 2.5 | 11.8 | 4.6 | 4.6 | 34.9 | 7.6 |
| 2016 | 367 | 316 | 63.2 | 5 | 13.6 | 20.9 | 1.5 | 138.7 | 608.5 | 21.9 |
Note: Pac, accumulated precipitation; P, precipitation; NV/WV indicates the ratio between non-vegetated slope and vegetated for average values of runoff coefficient and total sediment yield. |
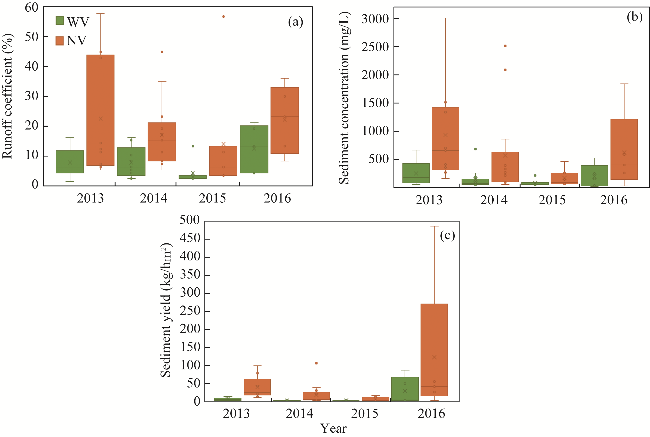
Fig. 4 Variability of runoff coefficient (a), sediment concentration (b), and sediment yield (c) in the slopes with vegetation (WV) and without vegetation (NV) during 2013-2016. Boxes indicate the IQR (interquartile range, 75th to 25th of the data). The median value is shown as a line within the box. Whisker is shown as the mean. Outliers are shown as circles. Bars extend to the most extreme value within 1.5×IQR. |
Table 3 Results of the Mann-Kendall trend and Sen's slope analysis for runoff coefficient (CR), sediment concentration (CS), and sediment yield (SY) |
| Index | Slope with vegetation | Slope with no vegetation | ||||
|---|---|---|---|---|---|---|
| CR | CS | SY | CR | CS | SY | |
| Mann-Kendall statistics | 64 | -31 | -144 | -162 | -18 | -152 |
| Test statistics | -0.44 | -2.12 | -2.39 | -0.25 | -2.29 | -1.63 |
| P-value | 0.65 | 0.03 | 0.01 | 0.80 | 0.02 | 0.10 |
| Sen's slope | 0.00 | -2.12 | -1.70×10⁻⁵ | 0.00 | -13.05 | -3.80×10⁻⁴ |
| Trend | Not significant | Decreasing | Decreasing | Not significant | Decreasing | Not significant |
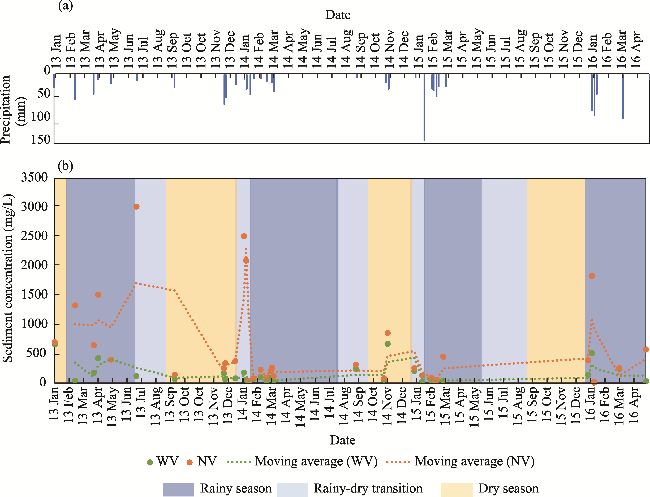
Fig. 5 Variation in sediment concentration on the slopes with (WV) and without (NV) vegetation after precipitation events during 2013-2016. (a), precipitation; (b), sediment concentration. |
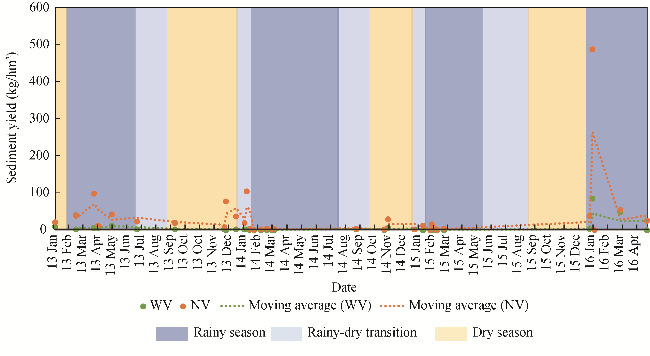
Fig. 6 Variation in sediment yield on the slopes with (WV) and without (NV) vegetation after precipitation events during 2013-2016 |
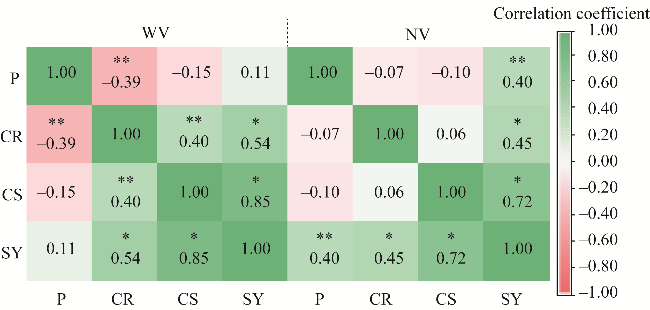
Fig. 7 Spearman correlation among precipitation (P), surface runoff coefficient (CR), sediment concentration (CS), and yield (SY) of the slopes with (WV) and without (NV) vegetation.*, P<0.05 level; **, P<0.01 level. |
| [1] |
|
| [2] |
|
| [3] |
|
| [4] |
|
| [5] |
|
| [6] |
|
| [7] |
|
| [8] |
|
| [9] |
|
| [10] |
|
| [11] |
|
| [12] |
|
| [13] |
|
| [14] |
|
| [15] |
|
| [16] |
|
| [17] |
|
| [18] |
|
| [19] |
|
| [20] |
|
| [21] |
|
| [22] |
|
| [23] |
|
| [24] |
National Transport Confederation. 2024. Roadway Research CNT 2024. Brasília. [2024-06-28]. https://pesquisarodovias.cnt.org.br/. (in Portuguese)
|
| [25] |
|
| [26] |
|
| [27] |
|
| [28] |
|
| [29] |
|
| [30] |
|
| [31] |
|
| [32] |
|
| [33] |
|
| [34] |
|
| [35] |
|
| [36] |
|
| [37] |
|
| [38] |
|
| [39] |
|
| [40] |
|
| [41] |
|
| [42] |
|
| [43] |
|
| [44] |
|
| [45] |
|
| [46] |
|
/
| 〈 |
|
〉 |