
Response of precipitation isotopes and water vapor sources to regional climate change on the Gannan Plateau, China
Received date: 2024-09-05
Revised date: 2024-12-28
Accepted date: 2025-01-03
Online published: 2025-08-13
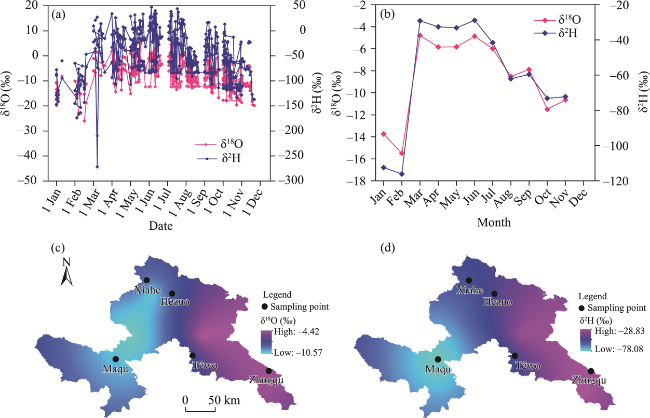
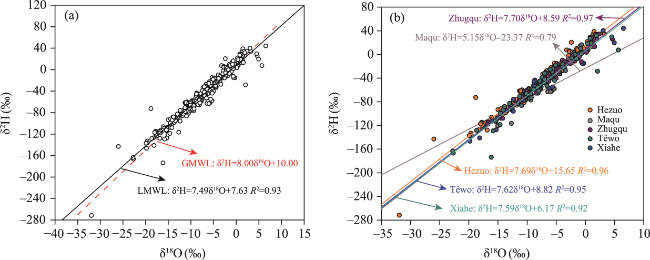
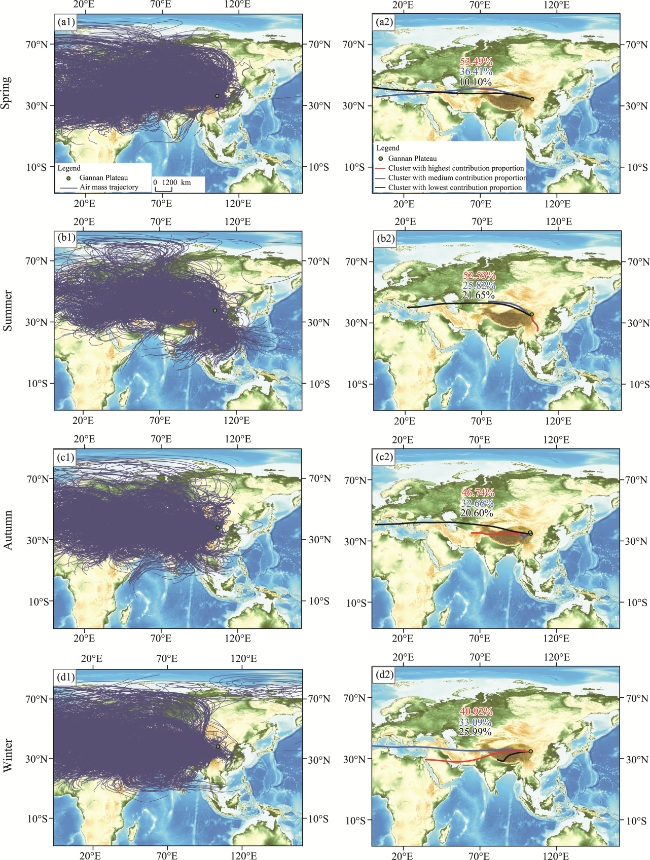
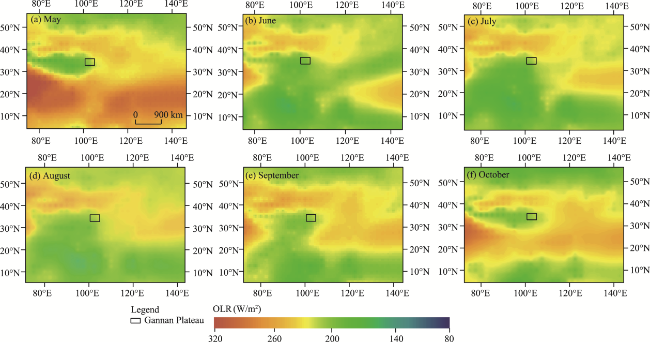
Precipitation isotopes (δ18O and δ2H) are closely related to meteorological conditions for precipitation generation and the initial state of water vapor source areas, and are essential to the study of the regional hydrological cycle. The deuterium excess (d-excess) indicates deviation in isotope fractionation during evaporation and can trace water vapor sources. This study analyzed 443 precipitation samples collected from the Gannan Plateau, China in 2022 to assess precipitation isotope variations and their driving factors. Water vapor sources were evaluated using the Hybrid Single-Particle Lagrangian Integrated Trajectory (HYSPLIT), Concentration Weighted Trajectory (CWT), and Potential Source Contribution Factor (PSCF) models. Results showed that precipitation isotope values showed significant spatial and temporal variations on the Gannan Plateau. Temporally, precipitation isotope values peaked in June (when evaporation dominated) and minimized in March (depletion effect of air masses in the westerly wind belt). Spatially, the isotope values showed a distribution pattern of "high in the east and low in the west", which was mainly regulated by the differences in altitude and local meteorological conditions. Compared with the global meteoric water line (GMWL) with equation of δ2H=8.00δ18O+10.00, the slope and intercept of local meteoric water line (LMWL) for precipitation on the Gannan Plateau were smaller (7.49 and 7.63, respectively), reflecting the existence of a stronger secondary evaporation effect under the clouds in the region. The sources of water vapor on the Gannan Plateau showed significant seasonality and spatial heterogeneity. Specifically, the westerly belt and monsoon were the main water vapor transport paths at each sampling point, with Central Asian continental water vapor dominating in spring (53.49%), Indian Ocean water vapor dominating in summer (52.53%), Atlantic Ocean water vapor dominating in autumn (46.74%), and Atlantic Ocean and Mediterranean Sea water vapor dominating in winter (42.30% and 33.68%, respectively). Changes in the intensity of convective activity and Outgoing Longwave Radiation (OLR) affected the enrichment of isotopic values, which exhibited the same change trends as δ18O. During the precipitation process, the δ18O value first decreased and then increased. During the initial and final stages of precipitation process, precipitation was mainly influenced by continental air masses, while during the middle stage, it was controlled by marine air masses. The systematic research on precipitation isotopes and water vapor sources is important for climate change research and extreme precipitation prediction on the Gannan Plateau and other similar areas.
CHEN Fenli , KANG Nan , WANG Shengjie , GAO Minyan , ZHANG Qiuyan , LI Huizhen , YAO Yiwen . Response of precipitation isotopes and water vapor sources to regional climate change on the Gannan Plateau, China[J]. Journal of Arid Land, 2025 , 17(4) : 440 -456 . DOI: 10.1007/s40333-025-0077-8
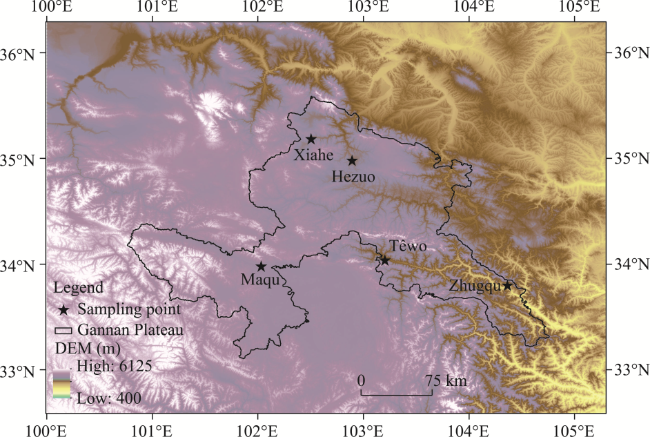
Fig. 1 Overview of the Gannan Plateau based on the digital elevation model (DEM) and distribution of the five precipitation sampling points |
Table 1 Basic information of precipitation sampling points on the Gannan Plateau |
| Sampling point | Latitude | Longitude | Altitude (m) | Number of samples | Annual climatology | ||
|---|---|---|---|---|---|---|---|
| Temperature (℃) | Precipitation (mm) | Relative humidity (%) | |||||
| Maqu | 34°00′N | 102°05′E | 3471 | 84 | 8.8 | 494.5 | 76.8 |
| Hezuo | 35°00′N | 102°54′E | 2910 | 141 | 7.7 | 448.8 | 79.4 |
| Têwo | 34°04′N | 103°14′E | 2374 | 78 | 10.6 | 436.6 | 77.4 |
| Zhugqu | 33°47′N | 104°22′E | 1400 | 74 | 17.6 | 350.5 | 72.8 |
| Xiahe | 35°21′N | 102°53′E | 2229 | 66 | 7.4 | 374.2 | 73.8 |
Fig. 2 Spatiotemporal variation characteristics of precipitation isotopes on the Gannan Plateau. (a), temporal variation in event-based precipitation isotopes; (b), temporal variation in monthly weighted average precipitation isotopes; (c), spatial variation in annual weighted average δ18O; (d), spatial variation in annual weighted average δ2H. |
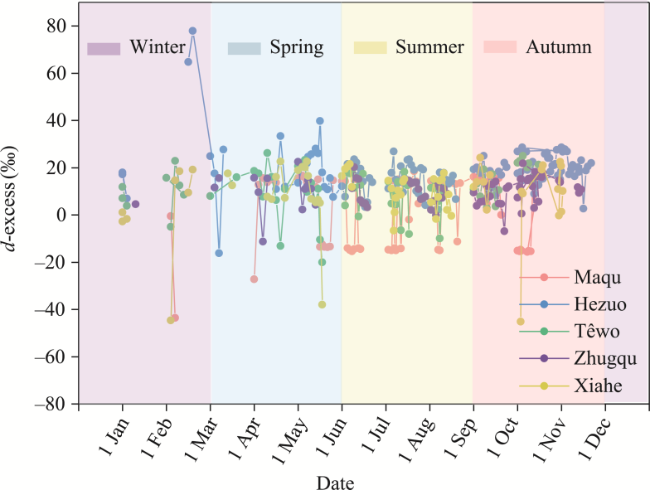
Fig. 3 Temporal variation characteristics of deuterium excess (d-excess) at different sampling points across the Gannan Plateau |
Fig. 4 Comparison between GMWL and LMWL based on all precipitation events on the Gannan Plateau (a) and among the LMWLs based on the precipitation events at each sampling point (b). GMWL, global meteoric water line; LMWL, local meteoric water line. |
Fig. 5 Air mass trajectories (a1-d1) and their clustering results (a2-d2) for each season in 2022. Note that the base map used was obtained from the National Centers for Environmental Information website (https://www.ncei.noaa.gov/products/etopo-global-relief-model). |
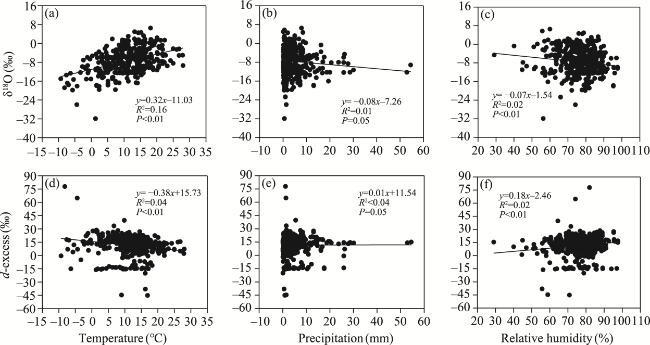
Fig. 6 Correlations of δ18O and d-excess with temperature (a and d), precipitation (b and e), and relative humidity (c and f) |
Fig. 7 Spatial variations in outgoing longwave radiation (OLR) in May (a), June (b), July (c), August (d), September (e), and October (f) on the Gannan Plateau |
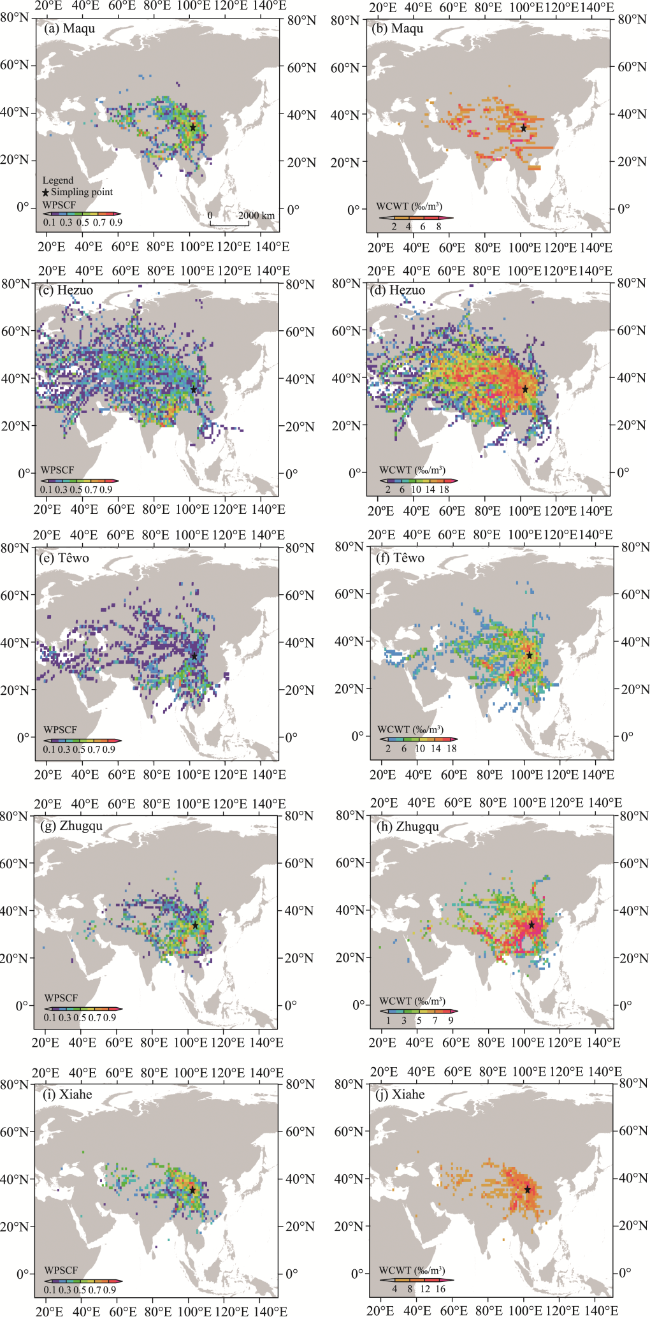
Fig. 8 Results for Potential Source Contribution Function (PSCF) and Concentration Weighted Trajectory (CWT) analyses of potential water vapor sources at Maqu (a and b), Hezuo (c and d), Têwo (e and f), Zhugqu (g and h), and Xiahe (i and j) on the Gannan Plateau in 2022. Note that the base map was obtained from the Meteoinfo website (http://www.meteothink.org/index.html#). |
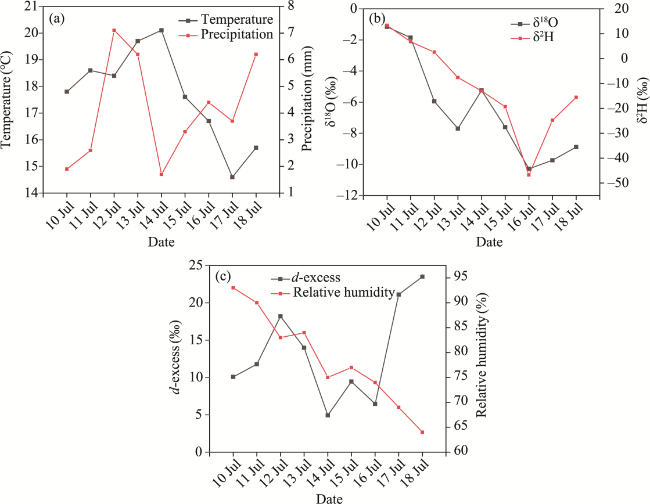
Fig. 9 Variations in precipitation isotopes and meteorological factors during the precipitation event at Hezuo from 10 July to 18 July 2022. (a), temperature and precipitation; (b), δ18O and δ2H; (c), d-excess and relative humidity. |
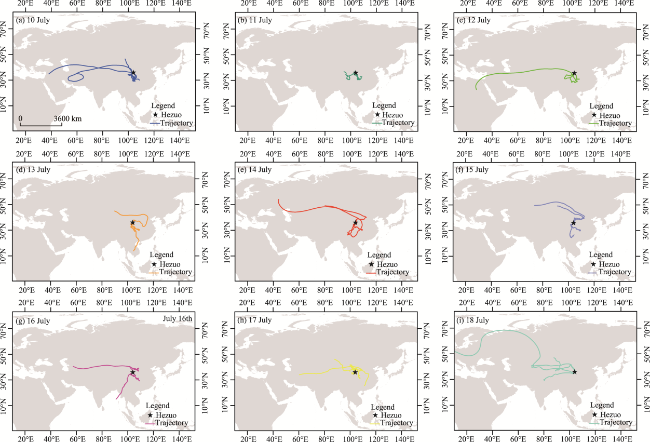
Fig. 10 Backward trajectory tracking of the HYSPLIT modeled persistent precipitation water vapor sources during the precipitation event at Hezuo from 10 July to 18 July 2022. HYSPLIT, Hybrid Single-Particle Lagrangian Integrated Trajectory (HYSPLIT). Note that the base map was obtained from the Meteoinfo website (http://www.meteothink.org/index.html#). |
| [1] |
|
| [2] |
|
| [3] |
|
| [4] |
|
| [5] |
|
| [6] |
|
| [7] |
|
| [8] |
|
| [9] |
|
| [10] |
|
| [11] |
|
| [12] |
|
| [13] |
|
| [14] |
|
| [15] |
|
| [16] |
|
| [17] |
|
| [18] |
|
| [19] |
|
| [20] |
|
| [21] |
|
| [22] |
|
| [23] |
|
| [24] |
|
| [25] |
|
| [26] |
|
| [27] |
|
| [28] |
|
| [29] |
|
| [30] |
|
| [31] |
|
| [32] |
|
| [33] |
|
| [34] |
|
| [35] |
|
| [36] |
|
/
| 〈 |
|
〉 |