
Hydrochemistry and environmental implications in the western alpine region of China
Received date: 2024-08-11
Revised date: 2024-11-20
Accepted date: 2024-11-25
Online published: 2025-08-13
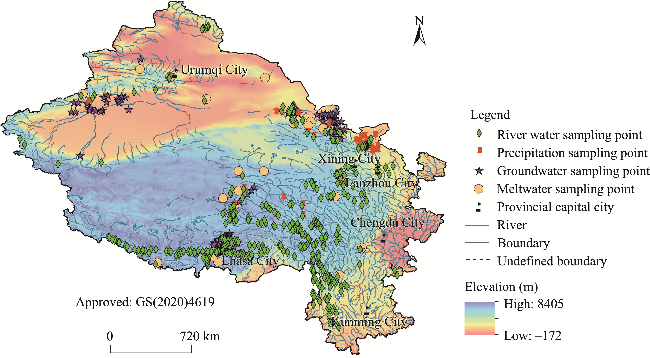
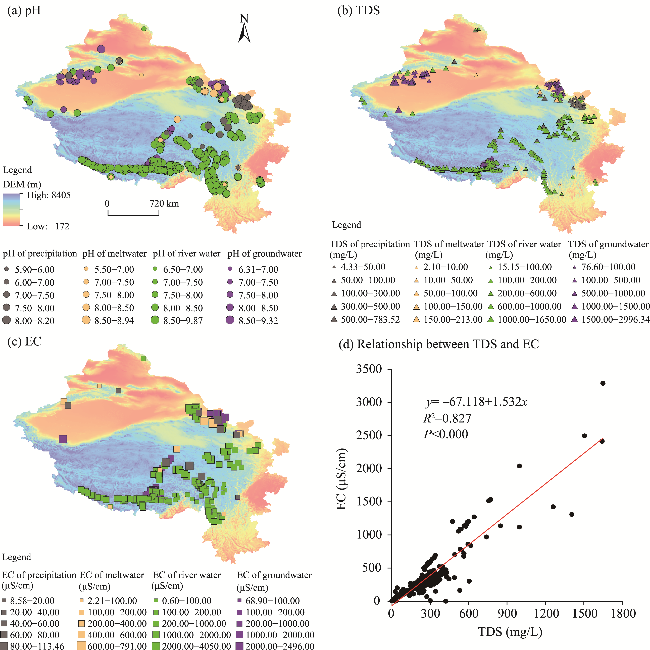
The western alpine region is an important freshwater supply and water conservation area for China and its surrounding areas. As ecological civilization construction progresses, the ecohydrology of the western alpine region in China, which is a crucial ecological barrier, has undergone significant changes. In this study, we collected 1077 sampling points and presented a comprehensive overview of research results pertaining to the hydrochemistry of river water, meltwater, groundwater, and precipitation in the western alpine region of China using piper diagram, end-member diagram, and hydrological process indication. Water resources in the western alpine region of China were found to be weakly alkaline and have low total dissolved solids (TDS). The mean pH values for river water, meltwater, groundwater, and precipitation are 7.92, 7.58, 7.72, and 7.32, respectively. The mean TDS values for river water, meltwater, groundwater, and precipitation are 280.99, 72.48, 544.41, and 67.68 mg/L. The hydrochemical characteristics of the water resources in this region exhibit significant spatial and temporal variability. These characteristics include higher ion concentrations during the freezing period and higher ion concentrations in inland river basins, such as the Shule River Basin and Tarim River Basin. The principal hydrochemical type of river water and meltwater is HCO3-•SO42--Ca2+, whereas the principal cations in groundwater are Mg2+ and Ca2+, and the principal anions are HCO3- and SO42-. In terms of precipitation, the principal hydrochemical type is SO42--Ca2+. The chemical ions in river water and groundwater are primarily influenced by rock weathering and evaporation-crystallization, whereas the chemical ions in meltwater are mainly affected by rock weathering and atmospheric precipitation, and the chemical ions in precipitation are derived primarily from terrestrial sources. The main forms of water input in the western alpine region of China are precipitation and meltwater, and mutual recharge occurs between river water and groundwater. Hydrochemical characteristics can reflect the impact of human activities on water resources. By synthesizing the regional hydrochemical studies, our findings provide insights for water resources management and ecological security construction in the western alpine region in China.
ZHAO Yue , LI Zongxing , LI Zhongping , AOBULI Gulihumaer , NIMA Zhaxi , WANG Dong . Hydrochemistry and environmental implications in the western alpine region of China[J]. Journal of Arid Land, 2025 , 17(4) : 411 -439 . DOI: 10.1007/s40333-025-0072-0
Fig. 1 Overview of the study area and distribution of sampling points of different water bodies. Note that the figure is based on the standard map (GS(2020)4619) of the Map Service System (https://bzdt.ch.mnr.gov.cn/), and the standard map has not been modified. |
Table 1 Date sources for different types of sampling points |
| Sampling point type | Reference |
|---|---|
| River water | Liu (1986); Guo (1987); Su and Tang (1987); Pu et al. (1988); Qin et al. (1999); Liu et al. (2000); Sun et al. (2002); Zhou et al. (2004); Nie et al. (2005); Wu et al. (2008); Huang et al. (2009); Noh et al. (2009); Wei et al. (2010a); Feng et al. (2011); Huang et al. (2011); Pu et al. (2011); Zhang et al. (2012a); Fan et al. (2014); Li et al. (2014b); Zhou et al. (2014); Guo et al. (2015); Jiang et al. (2015); Qu et al. (2015); Wang et al. (2015); Wang (2016); Wei et al. (2016); Xu (2016); Bu (2017); He et al. (2017); Li et al. (2017a); Yang (2017); Li (2018); Li et al. (2018b); Liu et al. (2018); Bao (2019); He et al. (2019); Hu (2019); Li et al. (2019b); Liu et al. (2019, 2020c); Li et al. (2020b); Liu et al. (2020b); Zhao (2020); Zhao et al. (2020); Han et al. (2021); Ma et al. (2021); Renzeng et al. (2021); Wang et al. (2021a); Wang et al. (2021b); Wang et al. (2021c) |
| Meltwater | Pu et al. (1988); Qin et al. (1999); Kang et al. (2002); Sun et al. (2002); Nie et al. (2005); Li et al. (2007b); Li et al. (2008, 2016a, 2019a); Wu et al. (2008); Zheng et al. (2008); Wu et al. (2009); Dong et al. (2010); Wei et al. (2010a); Li et al. (2011a); Li et al. (2011b); Pu et al. (2011); Feng et al. (2012); Zhang et al. (2012b); Zhao et al. (2012); Dong et al. (2013); Guo et al. (2015); Li et al. (2015b); Wang (2016); Wang et al. (2016); Wei et al. (2016); Bu (2017); Feng et al. (2017); Hu (2019); Song et al. (2019); Zhou et al. (2019); Li et al. (2020a) |
| Groundwater | Nie et al. (2005); Zhu et al. (2008); Zhu et al. (2010); Zhang et al. (2012a); Li et al. (2013); Li et al. (2014b); Wang et al. (2015); Wang (2016); Luo et al. (2017); Yang (2017); Li et al. (2018a); Li et al. (2018c); Zhang et al. (2018a); Hu (2019); Li et al. (2019a, 2020b); Ma (2019); Liu et al. (2020c); Ma et al. (2021) |
| Precipitation | Pu et al. (1988); Williams et al. (1992); Tang et al. (2000); Sun et al. (2002); Zhang et al. (2004); Li et al. (2007a); Li et al. (2009, 2014b); Feng et al. (2011); Ma et al. (2012); Wang (2012); Zhou et al. (2014); Guo et al. (2015); Li et al. (2015a, 2017b, 2020c); Wang et al. (2015); Wang et al. (2016); Yang (2017); Yu and Zhao (2017); Li (2018); Wang et al. (2019b); Li et al. (2020b); Zhang et al. (2020); Wang et al. (2022) |
Fig. 2 Spatial distributions of pH (a), TDS (b), and EC (c), as well as fitting relationship between TDS and EC (d) of different water bodies. TDS, total dissolved solids; EC, electrical conductivity. |
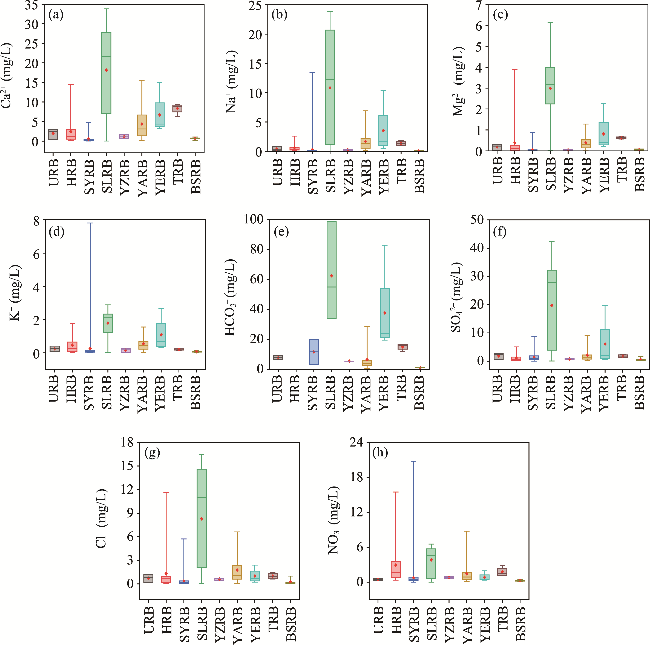
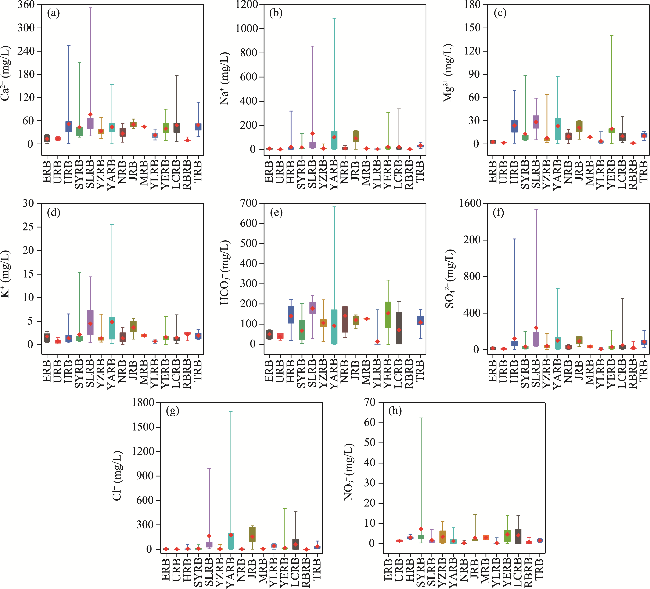
Fig. 3 Variations in the concentrations of Ca2+ (a), Na+ (b), Mg2+ (c), K+ (d), HCO3- (e), SO42- (f), Cl- (g), and NO3- (h) in precipitation in different river basins. URB, Urumqi River Basin; HRB, Heihe River Basin; SYRB, Shiyang River Basin; SLRB, Shule River Basin; YZRB, Yarlung Zangbo River Basin; YARB, Yangtze River Basin; YERB, Yellow River Basin; TRB, Tarim River Basin; BSRB, Baishui River Basin. Box boundaries indicate the 25th and 75th percentiles, and whiskers below and above the box indicate the minimum and maximum, respectively. The black horizontal line within each box indicates the median. The solid red dot indicates the mean. |
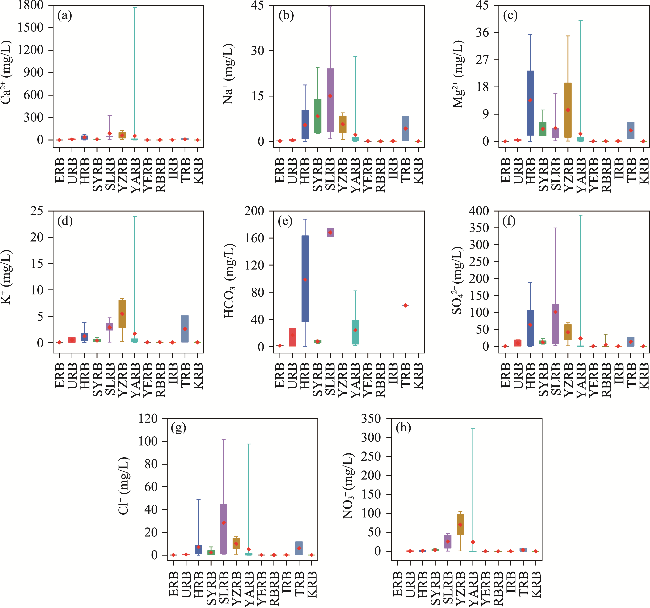
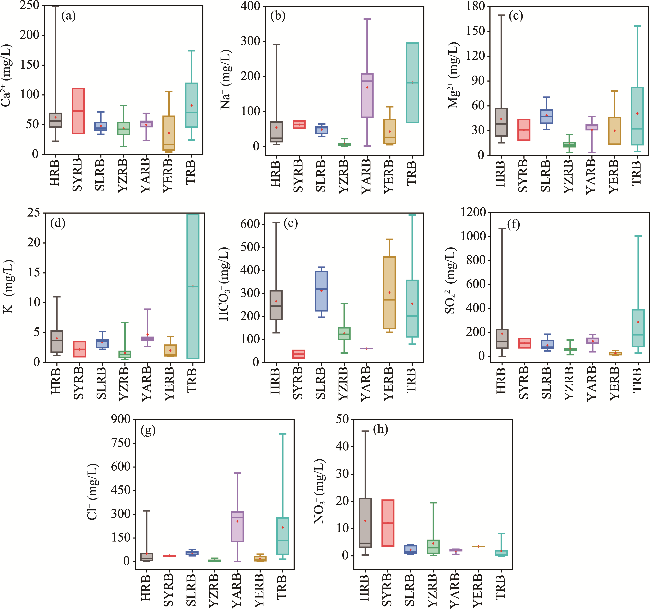
Fig. 4 Variations in the concentrations of Ca2+ (a), Na+ (b), Mg2+ (c), K+ (d), HCO3- (e), SO42- (f), Cl- (g), and NO3- (h) in meltwater in different river basins. ERB, Ertix River Basin; IRB, Ili River Basin; KRB, Kuytun River Basin. Box boundaries indicate the 25th and 75th percentiles, and whiskers below and above the box indicate the minimum and maximum, respectively. The black horizontal line within each box indicates the median. The solid red dot indicates the mean. |
Fig. 5 Variations in the concentrations of Ca2+ (a), Na+ (b), Mg2+ (c), K+ (d), HCO3- (e), SO42- (f), Cl- (g), and NO3- (h) in river water in different river basins. NRB, Nujiang River Basin; JRB, Jinsha River Basin; MRB, Minjiang River Basin; YLRB, Yalong River Basin; LCRB, Lancang River Basin; RBRB, Rongbuk River Basin. Box boundaries indicate the 25th and 75th percentiles, and whiskers below and above the box indicate the minimum and maximum, respectively. The black horizontal line within each box indicates the median. The solid red dot indicates the mean. |
Fig. 6 Variations in the concentrations of Ca2+ (a), Na+ (b), Mg2+ (c), K+ (d), HCO3- (e), SO42- (f), Cl- (g), and NO3- (h) in groundwater in different river basins. Box boundaries indicate the 25th and 75th percentiles, and whiskers below and above the box indicate the minimum and maximum, respectively. The black horizontal line within each box indicates the median. The solid red dot indicates the mean. |
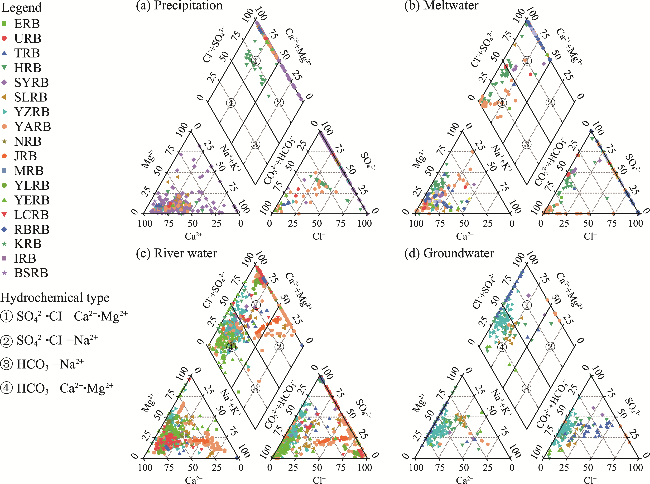
Fig. 7 Piper diagram showing hydrochemical types of precipitation (a), meltwater (b), river water (c), and groundwater (d) in different river basins |
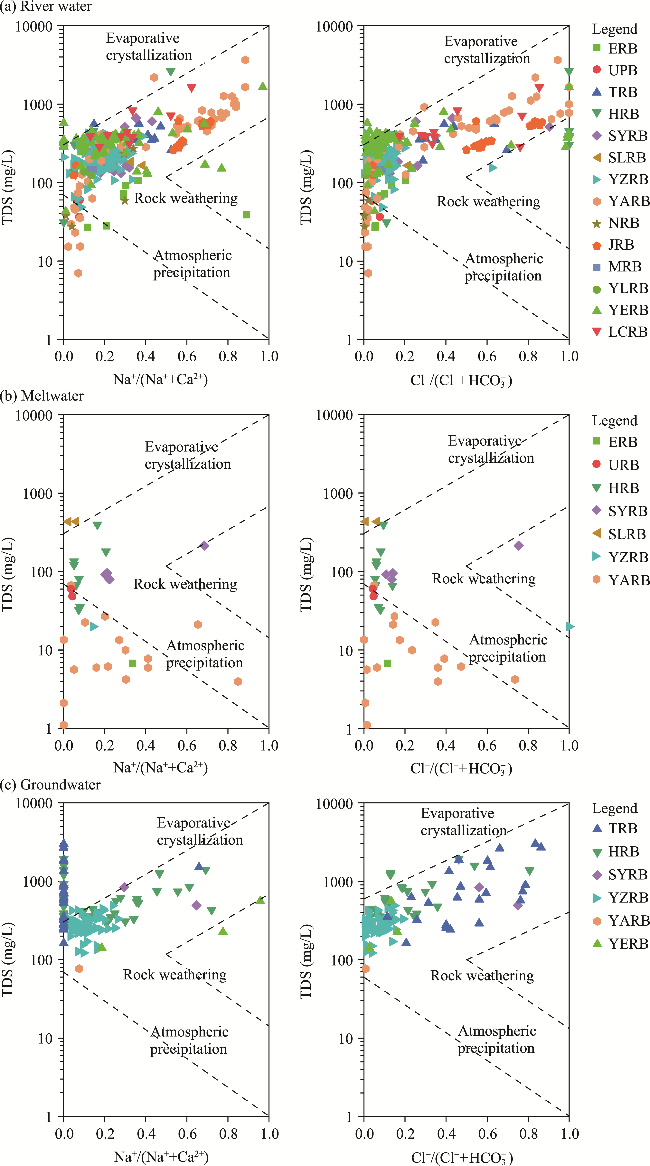
Fig. 8 Gibbs diagrams showing the hydrochemical formation process of river water (a), meltwater (b), and groundwater (c) in different river basins |
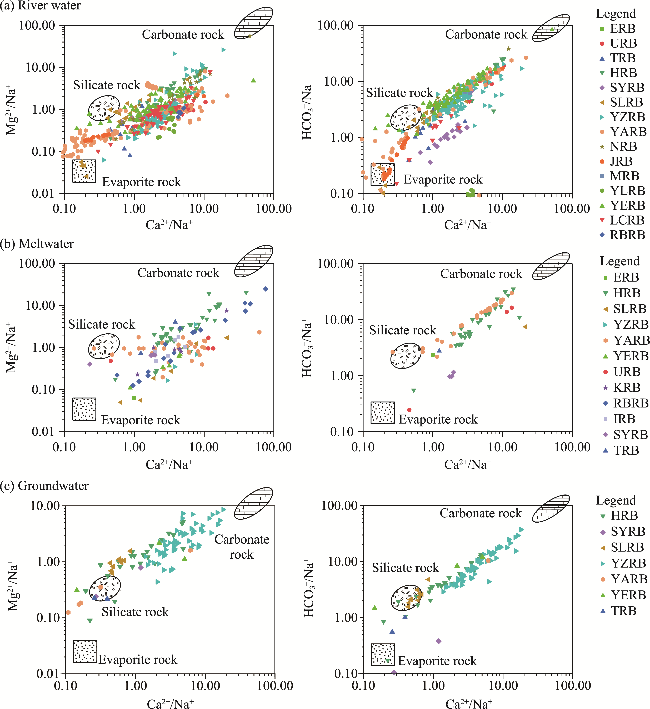
Fig. 9 End-member diagrams determining the rock types of river water (a), meltwater (b), and groundwater (c) in different river basins |
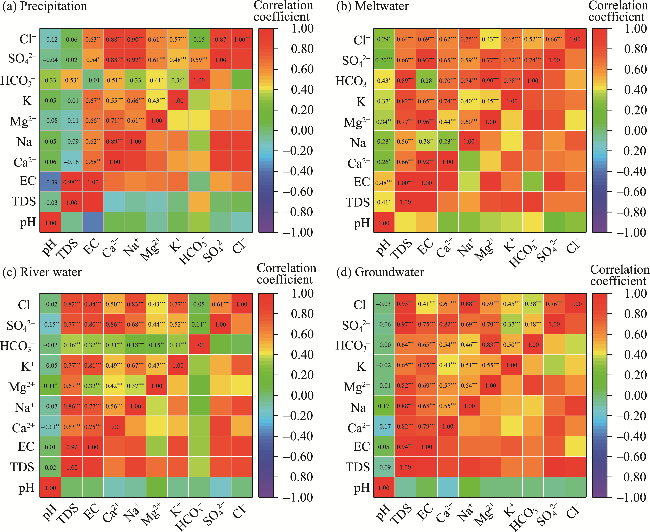
Fig. 10 Correlation coefficients between ions in precipitation (a), meltwater (b), river water (c), and groundwater (d). *** indicates that the correlation is significant at P<0.001 level; ** indicates that the correlation is significant at P<0.01 level; * indicates that the correlation is significant at P<0.05 level. |
Table 2 Analysis of enrichment factors and contribution rate of ion sources |
| Precipitation | EFsea | EFsoil | SSF (%) | NSSF (%) | ||
|---|---|---|---|---|---|---|
| CF (%) | AF (%) | |||||
| Ca2+ | 167.26 | - | 0.60 | 99.40 | ||
| Na+ | 2.29 | 0.75 | 43.73 | 56.27 | ||
| Mg2+ | 6.33 | 0.57 | 15.79 | 84.21 | ||
| K+ | 74.19 | 0.46 | 1.35 | 98.65 | ||
| Cl- | - | 176.56 | - | 0.57 | - | |
| SO42- | 44.88 | 100.49 | 2.23 | 1.00 | 96.77 | |
| HCO3- | 471.60 | - | 0.21 | 99.79 | ||
| NO3- | 126,773.29 | 533.15 | 0.00 | 0.19 | 99.81 | |
| Meltwater | EFsea | EFsoil | SSF (%) | NSSF (%) | ||
| CF (%) | AF (%) | |||||
| Ca2+ | 855.90 | - | 0.12 | 99.88 | ||
| Na+ | 2.46 | 0.44 | 40.57 | 59.43 | ||
| Mg2+ | 32.68 | 1.27 | 3.06 | 78.98 | 17.96 | |
| K+ | 30.75 | 0.22 | 3.25 | 96.75 | ||
| Cl- | - | 132.13 | - | 0.76 | - | |
| SO42- | 68.59 | 85.12 | 1.46 | 1.17 | 97.37 | |
| HCO3- | 6966.36 | - | 0.01 | 99.99 | ||
| NO3- | 41,611.80 | 44.27 | 0.00 | 2.26 | 97.74 | |
| River water | EFsea | EFsoil | SSF (%) | NSSF (%) | ||
| CF (%) | AF (%) | |||||
| Ca2+ | 942.58 | - | 0.11 | 99.89 | ||
| Na+ | 14.51 | 1.37 | 6.89 | 73.22 | 19.89 | |
| Mg2+ | 180.67 | 1.31 | 0.55 | 76.31 | 23.14 | |
| K+ | 52.28 | 0.08 | 1.91 | 98.09 | ||
| Cl- | - | 246.26 | - | 0.41 | - | |
| SO42- | 546.29 | 47.18 | 0.18 | 2.12 | 97.70 | |
| HCO3- | 4779.42 | - | 0.02 | 99.98 | ||
| NO3- | 18,533.28 | 8.38 | 0.01 | 11.94 | 88.05 | |
| Groundwater | EFsea | EFsoil | SSF (%) | NSSF (%) | ||
| CF (%) | AF (%) | |||||
| Ca2+ | 694.87 | - | 0.14 | 99.86 | ||
| Na+ | 4.45 | 0.97 | 22.45 | 77.55 | ||
| Mg2+ | 77.32 | 2.06 | 1.29 | 48.56 | 50.15 | |
| K+ | 31.58 | 0.04 | 3.17 | 96.83 | ||
| Cl- | - | 193.86 | - | 0.52 | - | |
| SO42- | 179.43 | 50.60 | 0.56 | 1.98 | 97.46 | |
| HCO3- | 5760.10 | - | 0.02 | 99.98 | ||
| NO3- | 23,998.65 | 13.28 | 0.00 | 7.53 | 92.47 | |
Note: "-" indicates that the corresponding contribution of ion sources cannot be determined by the formulas of enrichment factor (EF). EFsea and EFsoil are relative enrichment degree of an element in each kind of water body relative to the ocean and soil, respectively; SSF is the sea salt fraction; NSSF is the non-sea salt fraction, when the source of chemical ions is more complex, it is impossible to better distinguish the crustal and anthropogenic contributions; CF is the soil/rock weathering fraction; AF is the anthropogenic fraction. |
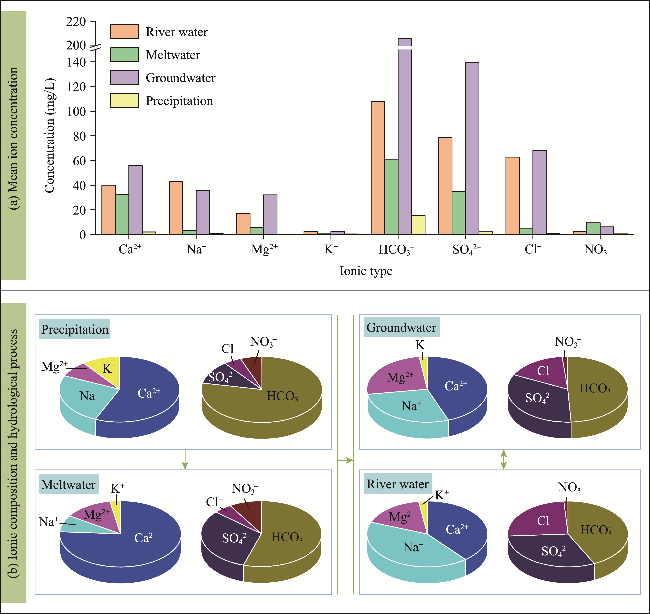
Fig. 11 Hydrological processes indicated by hydrochemistry in the western alpine region. (a), variations in ion concentrations of different water bodies; (b), hydrological processes and ionic composition of cations and anions in different water bodies. Arrows in Figure 11b represent the direction of hydrological recharge. |
| [1] |
|
| [2] |
|
| [3] |
|
| [4] |
|
| [5] |
|
| [6] |
|
| [7] |
|
| [8] |
|
| [9] |
|
| [10] |
|
| [11] |
|
| [12] |
|
| [13] |
|
| [14] |
|
| [15] |
|
| [16] |
|
| [17] |
|
| [18] |
|
| [19] |
|
| [20] |
|
| [21] |
|
| [22] |
|
| [23] |
|
| [24] |
|
| [25] |
|
| [26] |
|
| [27] |
|
| [28] |
|
| [29] |
|
| [30] |
|
| [31] |
|
| [32] |
|
| [33] |
|
| [34] |
|
| [35] |
|
| [36] |
|
| [37] |
|
| [38] |
|
| [39] |
|
| [40] |
|
| [41] |
|
| [42] |
|
| [43] |
Labaciren. 2017. Analysis of water chemistry characteristics and source of pollutants in the Yarlung Zangbo River basin in Qinghai-Tibet Plateau. MSc Thesis. Tianjin: Tianjin University. (in Chinese)
|
| [44] |
|
| [45] |
|
| [46] |
|
| [47] |
|
| [48] |
|
| [49] |
|
| [50] |
|
| [51] |
|
| [52] |
|
| [53] |
|
| [54] |
|
| [55] |
|
| [56] |
|
| [57] |
|
| [58] |
|
| [59] |
|
| [60] |
|
| [61] |
|
| [62] |
|
| [63] |
|
| [64] |
|
| [65] |
|
| [66] |
|
| [67] |
|
| [68] |
|
| [69] |
|
| [70] |
|
| [71] |
|
| [72] |
|
| [73] |
|
| [74] |
|
| [75] |
|
| [76] |
|
| [77] |
|
| [78] |
|
| [79] |
|
| [80] |
|
| [81] |
|
| [82] |
|
| [83] |
|
| [84] |
|
| [85] |
|
| [86] |
|
| [87] |
|
| [88] |
|
| [89] |
|
| [90] |
|
| [91] |
|
| [92] |
|
| [93] |
|
| [94] |
|
| [95] |
|
| [96] |
|
| [97] |
|
| [98] |
|
| [99] |
|
| [100] |
|
| [101] |
|
| [102] |
|
| [103] |
|
| [104] |
|
| [105] |
|
| [106] |
|
| [107] |
|
| [108] |
|
| [109] |
|
| [110] |
|
| [111] |
|
| [112] |
|
| [113] |
|
| [114] |
|
| [115] |
|
| [116] |
|
| [117] |
|
| [118] |
|
| [119] |
|
| [120] |
|
| [121] |
|
| [122] |
|
| [123] |
|
| [124] |
|
| [125] |
|
| [126] |
|
| [127] |
|
| [128] |
|
| [129] |
|
| [130] |
|
| [131] |
|
| [132] |
|
| [133] |
|
| [134] |
|
| [135] |
|
| [136] |
|
| [137] |
|
| [138] |
|
| [139] |
|
| [140] |
|
| [141] |
|
| [142] |
|
| [143] |
|
| [144] |
|
| [145] |
|
| [146] |
|
| [147] |
|
| [148] |
|
| [149] |
|
| [150] |
|
| [151] |
|
| [152] |
|
| [153] |
|
| [154] |
|
| [155] |
|
| [156] |
|
| [157] |
|
| [158] |
|
| [159] |
|
| [160] |
|
| [161] |
|
| [162] |
|
| [163] |
|
| [164] |
|
| [165] |
|
| [166] |
|
| [167] |
|
| [168] |
|
| [169] |
|
| [170] |
|
| [171] |
|
| [172] |
|
| [173] |
|
| [174] |
|
| [175] |
|
| [176] |
|
| [177] |
|
| [178] |
|
| [179] |
|
| [180] |
|
| [181] |
|
| [182] |
|
| [183] |
|
/
| 〈 |
|
〉 |