Research article

Effect of long-term restoration on soil phosphorus transformation and desorption in the semi-arid degraded land, India

  • Jyotirmay ROY 1 ,
  • Dipak Ranjan BISWAS 1 ,
  • Biraj Bandhu BASAK 1 ,
  • Ranjan BHATTACHARYYA 1 ,
  • Shrila DAS 1 ,
  • Sunanda BISWAS 1 ,
  • Renu SINGH 1 ,
  • Avijit GHOSH , 2, *
Expand
  • 1Indian Council of Agricultural Research (ICAR)-Indian Agricultural Research Institute (IARI), New Delhi 110012, India
  • 2ICAR-Indian Grassland and Fodder Research Institute (IGFRI), Jhansi 284003, India
*Avijit GHOSH (E-mail: )

Received date: 2025-01-13

  Revised date: 2025-04-22

  Accepted date: 2025-05-09

  Online published: 2025-08-13

Abstract

Understanding how different vegetation-based restoration practices alter soil chemical and microbial characteristics is crucial, as restoration practices influence phosphorus (P) transformation and fractions and modify P adsorption behavior during the restoration process of degraded land. This study investigated the impacts of vegetation-based restoration practices on soil chemical and microbial parameters, P fractions, and patterns of P adsorption and desorption, and highlighted the combined influence on P availability. To evaluate the impact of vegetation-based restoration practices on P fractions and adsorption behavior in the semi-arid degraded land in India, this study compared three distinct tree-based restoration systems, including Leucaena leucocephala (Lam.) de Wit-based silviculture system (SCS), Acacia nilotica (L.) Willd. ex Delile-based silvopasture system (SPS), and Emblica officinalis Gaertn-based hortipasture system (HPS), with a natural grassland system (NGS) and a degraded fallow system (FS) as control. The soil samples across various soil depths (0-15, 15-30, and 30-45 cm) were collected. The findings demonstrated that SCS, SPS, and HPS significantly improved soil organic carbon (SOC) and nutrient availability. Moreover, SCS and SPS resulted in increased microbial biomass phosphorus (MBP) content and phosphatase enzyme activity. The P fractionation analysis revealed that ferrum-associated phosphorus (Fe-P) was the major P fraction, followed by aluminum-associated phosphorus (Al-P), reflecting the dominance of ferrum (Fe) and aluminum (Al) oxides in the semi-arid degraded land. Compared with FS, vegetation-based restoration practices significantly increased various P fractions across soil depths. Additionally, P adsorption and desorption analysis indicated a lower adsorption capacity in tree-based restoration systems than in FS, with FS soils adsorbing higher P quantities in the adsorption phase but releasing less P during the desorption phase. This study revealed that degraded soils responded positively to ecological restoration in terms of P fraction and desorption behavior, influencing the resupply of P in restoration systems. Consequently, litter rich N-fixing tree-based restoration systems (i.e., SCS and SPS) increased total phosphorus (TP) stock for plants and sustained the potential for long-term P supply in semi-arid ecosystems. With the widespread adoption of restoration practices across degraded landscapes, SCS and SPS would significantly contribute to soil restoration and improve productivity by maintaining the soil P supply in semi-arid ecosystems in India.

Cite this article

Jyotirmay ROY , Dipak Ranjan BISWAS , Biraj Bandhu BASAK , Ranjan BHATTACHARYYA , Shrila DAS , Sunanda BISWAS , Renu SINGH , Avijit GHOSH . Effect of long-term restoration on soil phosphorus transformation and desorption in the semi-arid degraded land, India[J]. Journal of Arid Land, 2025 , 17(6) : 846 -864 . DOI: 10.1007/s40333-025-0101-z

1 Introduction

Land degradation severely limits agricultural productivity and ecosystem sustainability. Approximately 33.00% of global land degradation results in a 60.00% decline in ecosystem services (Bardgett et al., 2021). Unsustainable land use, overpopulation, and poor management systems accelerate degradation, leading to biodiversity loss and declining soil productivity. Restoring nutrient cycles, particularly phosphorus (P), is vital for soil health and recovery of degraded ecosystems, as P is often limited due to fixation by metal oxides (Margenot et al., 2016). Large-scale land restoration offers a sustainable solution by re-establishing vegetation, stabilizing soils, and increasing soil fertility, microbial diversity, and productivity (Hu et al., 2022; Neffar et al., 2022). Vegetation recovery improves soil structure, water infiltration, and nutrient cycling through surface litter, root exudates, and rhizodeposition (Bandyopadhyay and Maiti, 2022).
Vegetative ecosystems are crucial in P cycling, as deep tree roots absorb inorganic P from lower soil depths and transfer it to the upper layer via leaf litter and rhizodeposition (Schaap et al., 2021). The P is a critical nutrient for forest productivity in degraded tropical ecosystems (Yang et al., 2021), with deficiency caused by strong adsorption of H2PO4- onto metal oxides (Chakraborty and Prasad, 2023). Vegetative land use can increase the P supply by altering P forms, reducing interactions with soil components (Roy et al., 2025), improving soil physical and chemical characteristics (Cui et al., 2019), and increasing microbial functioning (Padalia et al., 2022). Soil enzymatic activities are vital for nutrient cycling and P transformation (Sun et al., 2021), with plant and microbial community shifts facilitating better access to inorganic P and mineralize organic P (Dai et al., 2020). The recycling of organic and inorganic P reduces the dependence on external inputs. The afforestation of degraded land can increase topsoil available P (AP), with tree and grass species influencing soil chemistry and metal oxide distribution (Tuyishime et al., 2022). Understanding P transformation and sorption under restoration practices is essential for identifying appropriate vegetation species for degraded lands.
The transformation of P is principally controlled by pH, dissolved oxygen, organic matter, microbial diversity, metal oxides, and hydroxides (Li et al., 2016). Strongly acidic and weathered soils are typically dominated by amorphous and crystalline ferrum (Fe)-aluminum (Al) associated P (Chen et al., 2024). Vegetations impact soil chemistry by lowering pH and enhancing legacy P release (Jin et al., 2022), while also influencing biological factors such as microbial diversity and phosphatase activity, which affect P mineralization (Fu et al., 2020). The sorption reactions of P are key to environmental P management and occur in two stages: an initial phase dominated by chemical adsorption and a slower phase characterized by incorporation of P into more stable mineral forms (Barrow, 1980). Calcite, silicate clay edges, Fe and Al oxides, and organic matter can alter P adsorption on soil surfaces (Mabagala and Mng'ong'o, 2022). In contrast, P desorption releases immobilized P, making it available for reuse. Both adsorption and desorption mechanisms are crucial in determining P bioavailability.
The P fractions are crucial indicators of ecosystem restoration. Vegetative land systems improve P solubilization and mobilization by altering microbial biomass and phosphatase activity (Roy et al., 2025). Compared with shrubland, natural secondary forests present higher-soluble P and organic P contents, indicating the benefits of forest restoration (Fu et al., 2020). Similarly, restoring native woody and perennial plants increase both the concentration of P and the ratio of organic P to total P (TP) over abandoned exotic grasslands (Zhong et al., 2021). Broad-leaved tree systems moderately elevate labile P over plantation systems (Zhu et al., 2021), and rejuvenated forestry systems outperform pasture systems in terms of labile and moderately labile P (Ferreira et al., 2022). Vegetative cover also increases available phosphorus (AP) levels, reinforcing the positive role of forest restoration (Chen et al., 2021). Although a meta-analysis of 217 studies revealed that afforestation significantly increases carbon (C) and nitrogen (N) stocks by 37.00% and 28.00%, respectively, while it has no significant effect on the total phosphorus (TP) stock (Luo et al., 2023). According to Yang et al. (2019), organic matter can significantly improve P availability by reducing adsorption sites and promoting release; though some studies reported no direct effect of organic matter on P adsorption (Borggaard et al., 1990; Guan et al., 2006; Yan et al., 2016). The conflicting results likely reflect differences in soil composition, including soil texture, pH, organic matter composition, and other chemical properties, emphasizing the complexity of P cycling and the need for site-specific management approaches.
Researchers have advanced the understanding of P dynamics in restoration ecosystems, highlighting the roles of vegetation, soil properties, and microbial activities. While afforestation increases labile P fractions, it does not significantly increase the TP stock, as P is derived solely from parent material and is not replenished atmospherically such as C and N. Therefore, assessing whether high-litter and N-fixing tree species can increase soil TP through nutrient pumping, rapid organic matter decomposition rates, and enhanced microbial activity, is crucial. The role of organic matter in P adsorption across soils and the relationships among P fractions, adsorption, and availability remain unclear. This study addressed the research gaps by comparing native N-fixing tree-based restoration systems with fallow land and evaluating impacts on P fractionation, adsorption, and microbial activity. The experimental site, which is degraded by erosion and extreme climates, is rich in Fe and Al oxides that enhance P fixation (Baradwal et al., 2022). Although silvopastoral land and grassland improve soil quality (Baradwal et al., 2023), their effects on P distribution are poorly understood. Investigating P fractions is crucial for identifying P sources and sinks, guiding efficient P management. A deeper understanding of long-term restoration practices on P transformation and desorption is necessary in semi-arid degraded soils.
With this background, we conducted an experiment in the semi-arid degraded land in India under different vegetation-based restoration practices and analyzed soil samples for P fractions, microbial properties, and P adsorption-desorption. This research aims to investigate two issues: (1) how different land restoration measures impact soil P fractions; and (2) whether the land restoration practices could alter soil adsorption-desorption behavior and reduce P fixation.

2 Materials and methods

2.1 Study area

We conducted the study at the institutional farm of the Indian Council of Agricultural Research (ICAR)-Indian Grassland and Fodder Research Institute (IGFRI) in Jhansi City, Bundelkhand Region, Uttar Pradesh State, India (25°31ʹ11ʺ-25°31ʹ28ʺN, 78°32ʹ32ʺ-78°32ʹ53ʺE; 326.4 m a.s.l.). The climate at the experimental site is typically dry, with scorching summers and cold and foggy winters from late November to mid-March. Although the annual average precipitation is approximately 841 mm, 90.00% of the total precipitation occurs during the southwest monsoon season (June-September). The dry season extends from October to May, with very low precipitation (85 mm). This region often experiences irregular precipitation patterns, resulting in intermittent drought episodes. The air temperature ranges from an average daily maximum of 21.4°C in January to 41.6°C in May, with the highest temperature exceeding 47.8°C in summer. The peak mean daily evaporation rate was recorded in June at 12.7 mm/d. The region experiences high wind velocities (>8 km/h) from May to July, leading to significant wind erosion (Baradwal et al., 2023). The annual soil loss ranges from 37.00 to 53.00 Mg/(hm2•a) (Baradwal et al., 2023). The soil at the experimental site belongs to the hypothermic Typic Haplustepts and is yellowish red to dark brown in color. The geological formations consist of gneisses, granites, ferruginous beds, and intrusions of basic igneous rocks (Baradwal et al., 2022). The nutrient retention and water holding capacity of the soil are considered moderate, with a saturation water holding capacity of 32.50% (Baradwal et al., 2022). The poor fertility of the soil (soil organic carbon (SOC): 3.49 g/kg; available nitrogen (AN): 82.52 mg/kg, AP: 3.99 mg/kg, and available potassium (AK): 110.34 mg/kg) restricts conventional agriculture and undermines soil productivity (Roy et al., 2025). Soils are also high in Fe and Al oxides, with average concentrations of 70.01 (±5.52) and 240.11 (±15.25) g/kg, respectively (Roy et al, 2025).

2.2 Land restoration system

The establishment of tree-based restoration system aimed at rehabilitating degraded lands via sustainable practices, including silviculture system (SCS), silvopasture system (SPS), and hortipasture system (HPS). Native tree seedlings were manually planted after preparing the soil by digging holes to support root establishment. Extensive site preparation included debris removal, vegetation clearing, terrain levelling for uneven water distribution, and plowing to improve aeration and root penetration. In addition to the three restoration systems, we included another two land systems for comparison: natural grassland system (NGS), as a reference representing a natural grassland system and fallow system (FS), as a control representing degraded land. The experiment site selection was based on proper spatial distribution across specific land use systems, avoiding proximity to minimize interactions and allowing independent evaluation of each system's impact on soil P properties (Table 1).
Table 1 Land system in the study area
Land system Coverage area (hm2) Sand (%) Silt (%) Clay (%) Coordinate Year of establishment Soil erosion rate (Mg/(hm2•a))
Silviculture system (SCS) 3.0 53.80 30.70 15.50 25°31ʹ12ʺN, 78°32ʹ35ʺE 2000 23.50
Silvopasture system (SPS) 1.1 59.80 24.70 15.50 25°31ʹ11ʺN, 78°32ʹ53ʺE 2010 25.27
Hortipasture system (HPS) 1.2 51.80 34.70 13.50 25°31ʹ24ʺN, 78°32ʹ32ʺE 1996 25.46
Natural grassland system (NGS) 2.0 59.80 24.70 15.50 25°31ʹ28ʺN, 78°32ʹ51ʺE 2000 26.59
Fallow system (FS) 2.0 59.80 26.70 13.50 25°31ʹ14ʺN, 78°32ʹ52ʺE 1980 53.29

Note: The soil erosion rate data were referred to Baradwal et al. (2023).

The SCS consists of Leucaena leucocephala (Lam.) de Wit with naturally growing grasses such as Cenchrus ciliaris L., Panicum maximum Jacq., Brachiaria decumbens Stapf, and Heteropogon contortus (L.) P. Beauv. ex Roem. & Schult. (Fig. 1). The SPS consists of Acacia nilotica (L.) Willd. ex Delile with sown grasses such as P. maximum, Stylosanthes seabrana Vogel, and Chrysopogon fulvus (Spreng.) Chiov. The HPS consists of Emblica officinalis Gaertn with sown grasses such as C. ciliaris, P. maximum, Pennisetum pedicellatum Trin., Cenchrus setigerus Vahl, and B. decumbens. The tree species selection for the three restoration practices (i.e., the L. leucocephala for SCS, the A. Nilotica for SPS, and the E. Officinalis for HPS) was on the basis of ecological adaptability, environmental benefits, growth performance, and biodiversity. The primary aim of tree planting was ecological restoration, with no commercial exploitation.
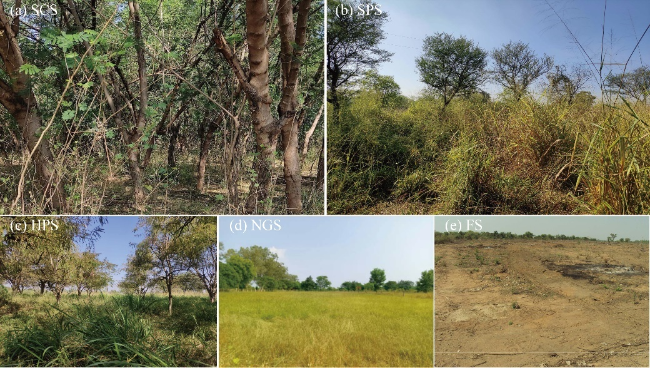
Fig. 1 Landscape of land system in the semi-arid area in India. (a), Leucaena leucocephala (Lam.) de Wit based silviculture system (SCS); (b), Acacia nilotica (L.) Willd. ex Delile based silvopasture system (SPS); (c), Emblica officinalis Gaertn based hortipasture sytem (HPS); (d), natural grassland system (NGS); (e), fallow system (FS).
The NGS, reference grassland system, consists of naturally growing grasses such as C. ciliaris, Celosia argentea L., Hyptis suaveolens (L.) Poit., Acanthospermum hispidum DC., and Eragrostis cilianensis (All.) Vignolo ex Janch. Indian semi-arid natural grasslands are savanna type (i.e., 10.00%-20.00% area is covered by trees in scattered manner). Vegetation-based restoration practices were compared with FS, which has similar climate, topography, elevation, and soil origin. The FS plots, which have been undisturbed since 1980, serve as long-term control for evaluating ecosystem recovery, with no interventions such as fertilization, irrigation, or planting. The natural vegetation in FS is sparse and consists mainly of hedges and bushes. Therefore, we assumed FS to be devoid of significant vegetation, with no influence on soil P properties, providing a baseline for comparing the influences of restoration practices on P dynamics. Before restoration, SCS, SPS, HPS, and NGS were identical to FS.

2.3 Soil sampling

In December 2022, we collected soil samples from each land system to assess the soil chemical properties and nutrient dynamics. We sampled at three depths: 0-15, 15-30, and 30-45 cm. We subdivided each plot into 8 subplots (30.0 m×30.0 m), spaced at 50.0 m apart to reduce spatial bias. Then, we collected 8 replicates at each depth interval within each plot to ensure robust representation and minimize variability, totalling 120 soil samples. Each replicate was collected from each subplot. We chose all the sampling points on the basis of soil homogeneity, slope, and tree density (considering tree density for the three tree-based restoration system SCS, SPS, and HPS). We separated each sample into two subsets: one subset experienced air-dried, pulverized, and sieved (2 mm) for chemical analysis, and the other subset was refrigerated at 4.0°C for microbial biomass and enzymatic activity assessment.

2.4 Soil chemical and microbial properties

In this study, we determined the soil pH via a 0.010 M CaCl2 suspension and measured it with a Systronics 361 pH meter (Systronics, Ahmedabad, India) (Schofield and Taylor, 1955). We also measured electrical conductivity (EC) by preparing a 1.02.5 soil-to-water ratio supernatant and measuring it with a Systronics 306 digital EC meter (Systronics, Ahmedabad, India) (Jackson, 1973). This study employed the Walkley and Black (1934) method to estimate SOC, where K2Cr2O7 oxidizes SOC in the presence of concentrated H2SO4, and the unreacted dichromate is titrated to ferrous ammonium sulfate (FAS) to determine SOC content. We determined AN by extracting NO3- and NH4+ ions using a KCl solution (Jackson, 1973). We extracted AK with 1.000 M ammonium acetate (pH=7.00), shaken, filtered, and analyzed with a Systronics 128 flame photometer (Systronics, Ahmedabad, India) (Hanway and Heidel, 1952).
We measured dehydrogenase (DHA) activity by incubating 1.0 g of soil with 2,3,5-triphenyltetrazolium chloride (TTC) and glucose solutions at 27.0°C for 24 h, followed by methanol extraction and measuring the absorbance at 485 nm with a Systronics 167 spectrophotometer (Systronics, Ahmedabad, India) (Casida et al., 1964). Additionally, we determined acid phosphatase (ACP) and alkaline phosphatase (ALP) activities by incubating 1.0 g of soil with nitrophenol phosphate in Modified Universal Buffer (MUB) at pH=6.50 and 11.00, respectively, at 37.0°C for 1 h. After incubation, we added 0.500 M CaCl2 and 0.500 M NaOH, and measured the absorbance at 440 nm (Tabatabai, 1994). We measured microbial biomass carbon (MBC) by fumigating one set of 10.0 g soil samples with chloroform and extracting fumigated and unfumigated sets with 0.500 M K2SO4. Then, we digested the extracts with concentrated H2SO4 in presence of K2Cr2O7 and titrated the unreacted K2Cr2O7 with 0.005 M FAS. The MBC extraction efficiency of K2SO4 from soil was accounted by using a correction factor of 0.45 (Vance et al., 1987). We determined the microbial biomass phosphorus (MBP) by fumigating one set of 10.0 g soil samples with chloroform and extracting both fumigated and unfumigated sets using 0.500 M NaHCO3 at pH=8.50. The MBP extraction efficiency of NaHCO3 from soil was accounted by using a correction factor of 0.40 (Brookes et al., 1982). We measured the absorbance of MBP at 730 nm with Systronics 167 spectrophotometer.

2.5 P fraction

This study employed the sequential inorganic P fractionation scheme (Kuo, 1996), which includes soluble and loosely bound phosphorus (Sal-P), Al-associated phosphorus (Al-P), Fe-associated phosphorus (Fe-P), Ca-associated phosphorus (Ca-P), and reductant soluble phosphorus (Res-P) (Table 2). We chose this scheme because of its efficiency and suitability for semi-arid soils in the study area, where P availability is severely influenced by Fe and Al oxides. This method can effectively separate Fe-P and Al-P, which serve as critical indicators of P cycling in degraded and restored ecosystems. We estimated TP using the microwave digestion method, as detailed by Page et al. (1982). We also determined organic P by taking the TP content of soil and subtracting the combined inorganic P fractions (Zhang and Kovar, 2009). This study employed the Bray and Kurtz (1945) method to measure AP. This method involves an acid fluoride extraction (0.030 M NH4F in 0.025 M HCl) to release P from soil. The Systronics 167 spectrophotometer was used to measure the P concentration in the extract at 730 nm (Murphy and Riley, 1962).
Table 2 Phosphorus (P) fractionation scheme used by this study
P fraction Extractant Condition
Soluble and loosely bound phosphorus (Sal-P) 1.000 M NH4Cl Shake for 30 min and centrifuge at 10,000 r/min
Aluminum-associated phosphorus (Al-P) 0.500 M NH4F Shake for 17 h, centrifuge at 10,000 r/min, and wash with saturated NaCl
Ferrum-associated phosphorus
(Fe-P)
0.100 M NaOH Shake for 1 h, centrifuge at 10,000 r/min, and wash with saturated NaCl
Calcium-associated phosphorus
(Ca-P)
0.250 M H2SO4 Shake for 1 h, centrifuge at 10,000 r/min, and wash with saturated NaCl
Reductant soluble
phosphorus
(Res-P)
0.300 M trisodium citrate dihydrate, 1.000 M NaHCO3, and 0.5 g Na2S2O4 Water bath, stir, heat at 80°C, centrifuge at 10,000 r/min, and wash with saturated NaCl

2.6 P adsorption

We selected the soil samples from 0-15 cm layer of each land system for P adsorption and desorption research, as the soil at this layer is the most active zone for nutrient cycling, and the majority of root activity and microbial processes occur in this layer (Roy et al., 2025). Deeper layers (15-30 and 30-45 cm) are generally less involved in the P sorption processes, as they are outside the primary zone of root interference and biological activity.
We added 3.0 g of soil to 50 mL centrifuge tubes in the P adsorption experiment. This process involved adding a solution of 0.010 M CaCl2 and varying P concentrations (5, 10, 20, 30, 40, 50, 60, and 80 mg/L) along with two drops of toluene to achieve a 1:10 soil to solution ratio. Then, we shook the tubes for 24 h at 25.0°C and centrifuged at 10,000 r/min for 10 min. Next, we transferred 25 mL of the supernatant from centrifuge tubes for P analysis using the ascorbic acid method through Systronics 167 spectrophotometer at 730 nm (Murphy and Riley, 1962). The calculation of P adsorbed by the soil involved subtracting the remaining P in the equilibrium solution from the initial amount added. To evaluate the P adsorption characteristics of the soils in different ecosystems, we applied two isotherm models. The Langmuir model assumes monolayer adsorption on a finite number of homogeneous sites, making it useful for estimating maximum adsorption capacity. The Freundlich model is empirical and better suited for heterogeneous surfaces with variable adsorption energies.
The Langmuir linear equation can be expressed mathematically by the following equation (Langmuir, 1918):
$\frac{C}{X}=\frac{C}{b}+\frac{1}{y}$,
$y=b\times k$,
where C is the equilibrium phosphorus concentration (mg/L); X is the phosphorus adsorbed per unit mass of soil (µg/g); b is the maximum phosphorus adsorption capacity (µg/g); k is the phosphorus binding affinity (mL/µg); and y is the maximum phosphorus buffering capacity (mL/g).
The Freundlich linear equation can be represented mathematically by the following equation (Freundlich, 1907):
$\log (X)=\log (a)+\frac{1}{n}\log (C)$,
where a is the number of phosphorus adsorption sites; and n is the phosphorus bonding energy.

2.7 P desorption

For the desorption study, soil samples previously equilibrated with the highest P concentration from the adsorption study (80 mg/L) served to examine P release. The process began by decanting 25 mL of the supernatant and replacing it with 0.010 M CaCl2 solution to simulate natural soil solution conditions. Then centrifuge tubes were shaken for 6 h and centrifuged at 10,000 r/min for 10 min. After that, we collected 25 mL of the supernatant for P analysis. Lastly, we measured the desorbed P concentration with Systronics 167 spectrophotometer at 730 nm (Murphy and Riley, 1962). The desorption process was repeated three times, as no significant amount of P was released thereafter (Roy et al., 2025).
${{P}_{r}}=P{}_{a}-{{P}_{d}}$,
where Pr is the amount of P retained in the soil (mg/kg); Pa is the amount of P initially adsorbed during the adsorption phase (mg/kg); and Pd is the amount of P desorbed during the desorption phase (mg/kg).

2.8 Measurement of aboveground biomass, litterfall, and root biomass

We estimated aboveground biomass in tree-based restoration systems (i.e., SCS, SPS, and HPS) non-destructively using allometric equations. We measured tree height and diameter at breast height for all individuals within randomly selected subplots (Chave et al., 2014). In other land systems (i.e., NGS and FS), we estimated aboveground biomass by clipping all herbaceous vegetation within 1 m2 quadrats and oven-drying the samples at 65°C to constant weight (Anderson and Ingram, 1993). We collected the litterfall using litter traps (0.5 m×0.5 m) placed randomly within each subplot and oven-dried the collections at 60°C (Hairiah et al., 2001). Traps were emptied monthly over a 12-month period. We determined root biomass by extracting soil cores using a 10 cm diameter soil sampler (Precision Balance, Kolkata, India). After sieving and hand-sorting, the roots were separated with soil; and then the roots were washed and oven-dried at 65°C until constant weight (Bohm, 1979; Jackson et al., 1997).

2.9 Statistical analysis

This study evaluated the statistical significance of the impacts of the various land restoration systems on soil characteristics using a one-way analysis of variance (ANOVA) within a randomized block experimental design. We identified differences among treatments using the Duncan post-hoc test. A structural equation model was adopted to evaluate the direct and indirect effects of soil chemical properties, microbial activities, and P adsorption parameters on P dynamics across all kinds of land systems. The structural equation model included four latent variables: soil chemical properties (pH, EC, SOC, AN, and AK), soil microbial parameters (DHA activity, ACP activity, ALP activity, MBC, and MBP), soil P fractions (Sal-P, Al-P, Fe-P, Res-P, Ca-P, organic P, AP, and TP), and P adsorption properties (maximum phosphorus buffering capacity, number of phosphorus adsorption sites, maximum phosphorus adsorption capacity, phosphorus bonding energy, and phosphorus binding affinity). We estimated the path coefficients by using maximum likelihood estimation. All variables were z-standardized (mean=0.000, standard deviation (SD)=1.000) prior to analysis to obtain standardized path coefficients. Only paths with P<0.05 were retained in the final model. We evaluated the model's adequacy using the χ2 test, goodness of fit (GIF), and root mean squared error of approximation (RMSEA). In this study, the standard of a good model fit was set as P<0.05, GIF>0.90, and RMSEA<0.080. The SPSS v.29.0 software (International Business Machines Corporation, Armonk, USA) performed all the statistical analyses.

3 Results

3.1 Soil chemical property and nutrient availability

Soil pH across the different land systems was slightly acidic, ranging between 4.60 and 5.90. Across all depths, the pH values for SCS, SPS, and HPS were significantly higher over FS (Table 3). In the case of EC, FS showed a lower EC value than SCS, SPS, HPS, and NGS across all depths. The SOC within the 0-45 cm soil layer varied between 1.56 and 9.05 g/kg, with a decreasing pattern as soil depth increased. The SCS showed 4.50-, 3.29-, and 2.78-fold increase than FS in SOC at 0-15, 15-30, and 30-45 cm soil depths, respectively. Moreover, SCS showed 99.42%, 91.36%, and 89.56% higher AN than FS at 0-15, 15-30, and 30-45 cm soil depths, respectively. Meanwhile, SPS showed 85.62%, 91.36%, and 89.62% higher AN than FS at 0-15, 15-30, and 30-45 cm soil depths, respectively. The AK was the highest in SCS and the lowest in SPS. Both the NGS and HPS could not increase AK content over FS at 15-30 and 30-45 cm soil depths. Nutrient availability was higher at soil depth of 0-15 cm than at 15-45 cm.
Table 3 Impact of land restoration on soil chemical property
Soil depth (cm) Land system pH EC (dS/m) SOC (g/kg) AN (mg/kg) AK (mg/kg)
0-15 SCS 5.74±0.15a 0.049±0.004a 9.05±0.08a 104.02±10.04a 121.44±15.73a
SPS 5.57±0.24a 0.021±0.003b 7.34±0.12ab 96.82±6.23a 35.26±8.70d
HPS 5.47±0.10a 0.033±0.005bc 5.93±0.06b 83.86±4.19b 60.82±5.55b
NGS 5.02±0.03b 0.022±0.003bc 5.33±0.02b 83.85±4.42b 54.91±4.35bc
FS 4.60±0.01b 0.015±0.004c 2.01±0.04c 52.16±4.91c 40.22±3.86c
15-30 SCS 5.90±0.00a 0.044±0.004a 5.13±0.05a 82.19±8.15a 56.32±8.72a
SPS 5.57±0.16ab 0.021±0.003a 4.02±0.06b 82.19±8.27a 25.26±3.55c
HPS 5.54±0.19ab 0.036±0.006b 3.67±0.04b 63.42±6.06b 32.16±6.94bc
NGS 5.36±0.13bc 0.020±0.003b 2.66±0.01c 69.29±4.28b 41.04±8.11b
FS 4.99±0.15c 0.019±0.004b 1.56±0.02c 42.95±2.83c 33.92±4.03bc
30-45 SCS 5.82±0.05a 0.042±0.005a 4.47±0.08a 74.48±4.91a 51.83±6.86a
SPS 5.58±0.15a 0.020±0.001b 4.52±0.06ab 74.50±4.22a 22.33±4.89c
HPS 5.58±0.02a 0.029±0.003b 3.47±0.04b 59.76±4.24b 29.54±4.76bc
NGS 5.25±0.01b 0.021±0.003b 2.36±0.02c 59.72±4.17b 44.11±5.33b
FS 4.90±0.05c 0.020±0.006b 1.61±0.01c 39.29±3.19c 32.12±5.06bc

Note: EC, electrical conductivity; SOC, soil organic carbon; AN, available nitrogen; AK, available potassium. Different lowercase letters within the same soil depth indicate statistical significant differences among different land systems at P<0.05 level. Mean±standard deviation (SD).

3.2 Soil biological parameter

Microbial parameters showed a significant improvement across different restoration practices as compared with FS (Table 4). Also, similar to nutrient, the biological parameters exhibited the highest content or activity at 0-15 cm soil depth than at 15-30 and 30-45 cm soil depths. The DHA activity exhibited the highest in SCS, followed by SPS, which was statistically similar to HPS and NGS across respective soil depths. The SCS obtained 2.48 and 1.99 times higher DHA activity than FS at 0-15 and 15-30 cm soil depths, respectively. The lowest DHA activity was observed in FS. For various land systems, ACP activity was higher than ALP activity. The ACP activity was the highest in SCS, which was 3.15-, 4.16-, and 5.91-fold higher than FS at 0-15, 15-30, and 30-45 cm soil depths, respectively. The SCS, SPS, and HPS showed 4.83-, 2.71-, and 2.76-fold increase in ALP activity than FS, respectively, at 0-15 cm soil depth. The SCS, SPS, and HPS showed significant increases in MBC content than FS. At 0-15 cm soil depth, SCS and SPS obtained 116.69% and 87.94% increments in MBC content than FS, respectively. Also, at 15-30 cm soil depth, SCS, SPS, and HPS showed 124.38%, 96.49%, and 106.66% increments than FS, respectively. The NGS increased 59.50% and 59.29% in MBC content than FS at 0-15 and 15-30 cm soil depths, respectively. The SCS, SPS, and HPS increased 98.65%, 84.20%, and 26.19% in MBP content than FS, respectively, at 0-15 cm soil depth. The highest MBP content was contained by SCS, followed by SPS and HPS. The HPS and NGS obtained the lowest increment in MBP content, statistically similar to FS.
Table 4 Impact of land restoration practice on soil microbial property
Microbial
parameter
Soil depth (cm) Land system
SCS SPS HPS NGS FS
DHA activity
(μg TPF/(g•24h))
0-15 78.42±3.33a 46.33±4.15b 45.91±5.66b 50.52±1.64b 31.62±3.12c
15-30 50.82±3.06a 32.79±2.49b 26.86±2.63b 30.85±0.62b 25.54±0.97b
30-45 21.53±1.50a 18.18±0.39b 17.57±0.62b 18.08±1.32b 16.35±0.27b
ACP activity
(μg PNP/(g•h))
0-15 146.50±1.84a 120.35±2.21b 89.29±1.93c 74.80±7.13d 46.51±5.06e
15-30 94.42±4.05a 75.44±5.29ab 85.62±2.60b 39.08±2.14c 22.71±0.43d
30-45 90.44±2.52a 55.61±8.61b 68.55±5.74b 28.04±4.86c 15.30±0.52c
ALP activity
(μg PNP/(g•h))
0-15 75.31±5.34a 42.22±1.41b 43.11±4.71b 21.38±1.03c 15.60±2.17c
15-30 67.12±2.46a 37.46±1.45b 35.72±1.54b 10.85±1.44c 10.4±2.17c
30-45 44.06±7.41a 33.53±6.51a 29.37±2.35a 10.60±0.61b 9.6±1.44b
MBC
(mg/kg)
0-15 928.48±24.21a 805.29±40.50ab 831.83±16.15ab 683.46±101.25b 428.49±68.33c
15-30 849.17±36.79a 743.62±26.48a 782.10±35.39a 602.84±37.40b 378.45±66.48c
30-45 637.33±22.10a 512.32±36.22b 540.46±18.74b 378.92±38.35c 348.35±43.36c
MBP
(mg/kg)
0-15 8.80±0.67a 8.16±0.61a 5.59±0.46b 4.93±0.21b 4.43±0.20b
15-30 6.26±0.47a 4.15±0.53b 4.26±0.23b 4.16±0.60b 3.18±0.41b
30-45 4.41±0.27a 3.83±0.08ab 3.53±0.44ab 3.47±0.80ab 2.88±0.20b

Note: DHA, dehydrogenase; ACP, acid phosphatase; ALP, alkaline phosphatase; MBC, microbial biomass carbon; MBP, microbial biomass phosphorus. Mean±SD. Different lowercase letters within the same soil depth indicate statistical significant differences among different land systems at P<0.05 level.

3.3 P fraction

The proportion of different P fractions under various restoration practices followed this order: Sal-P (0.35%-0.65%)<Ca-P (4.07%-8.89%)<Res-P (6.46%-9.90%)<Al-P (16.30%-27.68%)<Org-P (17.33%-29.53%)<Fe-P (37.39%-41.79%). The SCS exhibited 110.16% higher Sal-P than FS at 0-15 cm soil depth (Fig. 2). Otherwise, HPS and NGS did not show a significant increment in Sal-P compared with FS. The highest Al-P was exhibited in SCS, followed by SPS and HPS. The SCS exhibited 28.96%, 21.64%, and 11.93% higher Al-P than FS at 0-15, 15-30, and 30-45 cm soil depths, respectively. At 0-15 cm soil depth, SCS, SPS, and HPS exhibited 85.18%, 72.44%, and 48.25% greater Fe-P than FS, respectively. The SCS, SPS, and HPS contained 66.34%, 41.93%, and 32.49% greater Fe-P than FS, respectively, at 15-30 cm soil depth. At 0-15 cm soil depth, SCS, SPS, and HPS exhibited 31.58%, 30.36%, and 42.34% greater Res-P than FS, respectively. The NGS did not demonstrate a significant increase in Res-P than FS, regardless of soil depth. The Ca-P content in SCS was 2.99, 3.41, and 3.89 times higher than FS at 0-15, 15-30, and 30-45 cm soil depths, respectively. A similar pattern was noticed for Org-P content. In the case of TP, SCS exhibited a significant increase compared with FS by 95.74%, 65.54%, and 55.19% at 0-15, 15-30, and 30-45 cm soil depths, respectively. And SPS demonstrated 65.28% and 35.16% increases compared with FS at 0-15 and 15-30 cm soil depths, respectively. The AP was significantly higher in SCS than those in NGS and FS within 0-45 cm soil depth. The SPS and HPS exhibited 1.14 and 1.21 times higher AP than FS at 15-30 cm soil depth, respectively.
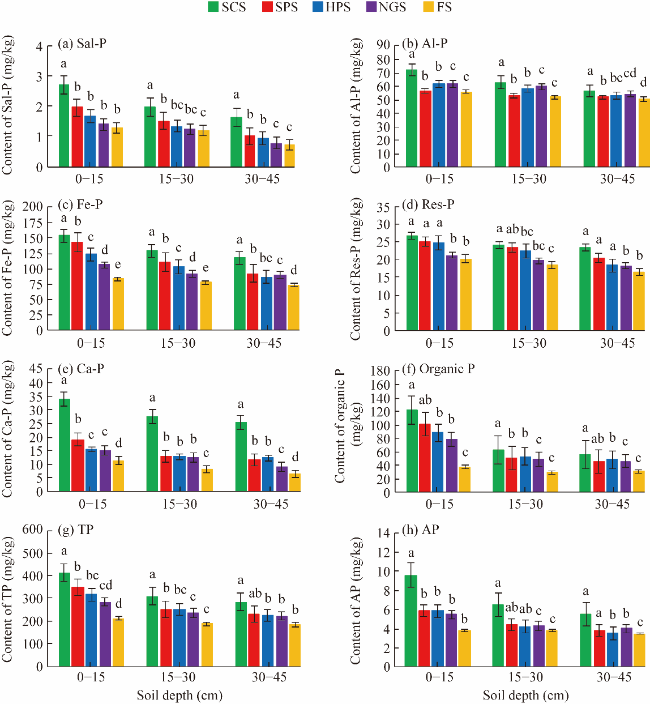
Fig. 2 Impact of different land restoration practices on soil phosphorus (P) fraction at different soil depths. (a), soluble and loosely bound-phosphorus (Sal-P); (b), aluminium-associated phosphorus (Al-P); (c), ferrum-associated phosphorus (Fe-P); (d), calcium-associated phosphorus (Ca-P); (e), reductant soluble phosphorus (Res-P); (f), organic P; (g), total phosphorus (TP); (h), available phosphorus (AP). Different lowercase letters within the same soil depth indicate statistical significant differences among different land systems at P<0.05 level. Bars represent standard errors.

3.4 P adsorption

Across all land systems, P adsorption increased with rising added P concentrations, following a typical adsorption pattern (Fig. 3). The FS exhibited the highest P adsorption capacity throughout the entire range of equilibrium concentrations. The NGS showed higher P adsorption than tree-based restoration systems. In contrast, SCS consistently showed the lowest P adsorption. The SPS and HPS displayed intermediate adsorption levels.
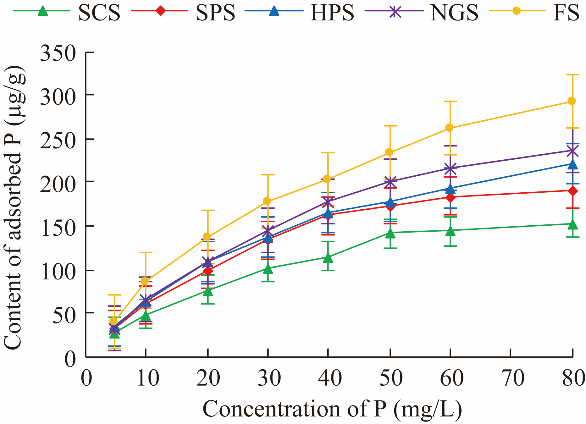
Fig. 3 P adsorption curve under different restoration practices. Bars represent standard errors.

3.4.1 Langmuir adsorption parameter

At 0-15 cm soil depth, FS exhibited the highest maximum phosphorus adsorption capacity (315 μg/g), while SCS exhibited the lowest maximum phosphorus adsorption capacity (190 μg/g) (Table 5). The SPS, HPS, and NGS exhibited non-significant decrease in maximum phosphorus adsorption capacity than FS. To be specific, SCS, SPS, HPS, and NGS showed 39.68%, 26.67%, 13.97%, and 6.67% decreases in maximum phosphorus adsorption capacity, respectively, compared with FS. However, all the vegetative restoration practices (i.e., including NGS) had significantly reduced phosphorus binding affinity than FS. A similar pattern was observed in the case of maximum phosphorus buffering capacity. The SCS, SPS, HPS, and NGS exhibited 3.51, 2.16, 1.99, and 2.00 times reduction in maximum phosphorus buffering capacity than FS, respectively.
Table 5 Langmuir and Freundlich adsorption parameter for different land systems
Land system Langmuir adsorption parameter Freundlich adsorption parameter
b (µg/g) k (mL/µg) y (mL/g) a n
SCS 190±10b 0.069±0.013b 12.9±1.6b 21±1c 1.95±0.05b
SPS 231±21ab 0.093±0.013b 21.0±1.2b 29±3bc 1.98±0.10b
HPS 271±44ab 0.085±0.003b 22.8±2.8b 34±3b 2.01±0.07b
NGS 294±55ab 0.081±0.015b 22.6±2.6b 36±5b 2.04±0.02b
FS 315±30a 0.144±0.013a 45.3±5.4a 62±8a 2.43±0.04a

Note: b, maximum phosphorus adsorption capacity; k, phosphorus binding affinity; y, maximum phosphorus buffering capacity; a, number of phosphorus adsorption sites; n, phosphorus bonding energy. Mean±SD. Different lowercase letters within the same parameter indicate statistical significant differences among different land systems at P<0.05 level.

3.4.2 Freundlich adsorption parameter

Restoration practices exhibited a significant reduction in both Freundlich parameters than FS (Table 5). The minimum number of phosphorus adsorption sites was observed in SCS (21). The SCS, SPS, HPS, and NGS decreased 66.67%, 53.23%, 45.16%, and 41.94% in the number of phosphorus adsorption sites than FS, respectively. Also, in the case of phosphorus bonding energy, SCS, SPS, HPS, and NGS decreased 19.75%, 18.52%, 17.28%, and 16.05% than FS, respectively.

3.5 P desorption

Across all land systems, the highest proportion of P was desorbed during the first desorption stage (i.e., the first round desorption, the desorption process was repeated three times in this study until no significant amount of P was released), with subsequent stages showed progressively lower P desorption (Fig. 4). The lowest cumulative P desorption was observed in FS, with only 1.95% of the adsorbed P. The cumulative P desorption in SCS, SPS, HPS, and NGS were 14.46%, 10.19%, 7.92%, and 6.81%, respectively.
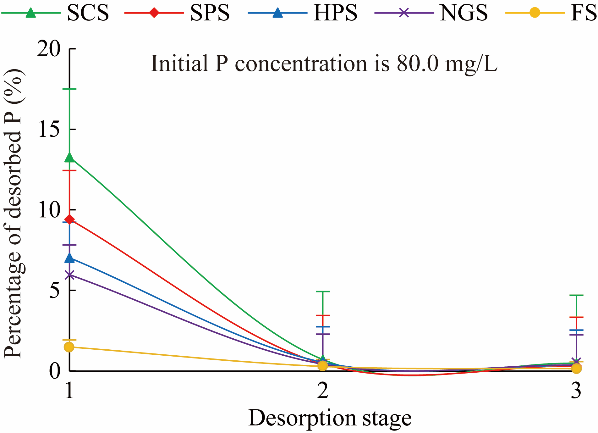
Fig. 4 P desorption curve under different restoration practices. Bars represent standard errors.

3.6 Aboveground biomass, litterfall, and root biomass

The highest aboveground biomass was recorded in SCS, followed by HPS and SPS (Table 6). The higher aboveground biomass in tree-based restoration systems than NGS and FS might due to the tree species with larger canopy and greater wood biomass. The HPS had the highest litterfall, which attributed to the combined contribution of horticultural species with high leaf turnover and pasture grasses. The SCS had the highest root biomass in the topsoil (0-15 cm), indicating a dense fibrous root network. However, SPS and HPS had relatively higher root biomass in deeper layers (15-45 cm), possibly due to the foraging behavior of pasture species and their adaptation to access deeper soil moisture.
Table 6 Aboveground biomass, litterfall, and root biomass in different land systems
Land system Aboveground biomass (Mg/hm2) Litterfall (g/m2) Root biomass (g/m2)
0-15 cm 15-30 cm 30-45 cm
SCS 12.53±1.24a 147.44±11.02b 84.67±7.22a 71.37±7.12a 34.69±3.11b
SPS 9.89±0.97b 126.25±12.64c 58.64±5.42b 75.67±7.31a 54.27±5.22a
HPS 10.24±0.87b 198.14±8.47a 40.33±4.02c 62.34±6.47b 52.21±5.17a
NGS 3.25±0.35c 57.14±3.29d 38.33±3.02c 32.34±3.17c 25.21±2.17c
FS 0.03±0.00d 15.2.14±3.28e 5.28±0.52d 4.67±0.45d 1.27±0.22d

Note: Mean±SD. Different lowercase letters within the same variable indicate statistical significant differences among different land systems at P<0.05 level.

3.7 Linking soil properties and P availability via strucural equation model

The structural equation model showed a good fit (χ2=213.17, GIF=0.92, and RMSEA=0.068), meeting favorable thresholds. It revealed that soil microbial properties directly and indirectly influenced P bioavailability and significantly impacted the distribution of various P fractions (Fig. 5). Microbial characteristics enhanced organic P mineralization and inorganic P solubilization, thereby increasing soluble P. The soluble P forms subsequently interacted with Fe and Al ions to form moderately available inorganic P fractions, maintaining equilibrium with Sal-P and ensuring long-term P supply. The P adsorption and desorption properties showed an inverse relationship with both P fractions and bioavailability. Declines in binding affinity, adsorption capacity, number of adsorption sites, and maximum buffering capacity created conditions favoring P availability. Evidence for this enhanced P availability was further supported by data on litterfall and root biomass in the restoration practices. Litter inputs enriched the soil with organic substrates that promoted microbial activity and organic P breakdown, whereas rhizodeposition from root biomass enhanced rhizosphere nutrient richness, fostering microbial solubilization of P.
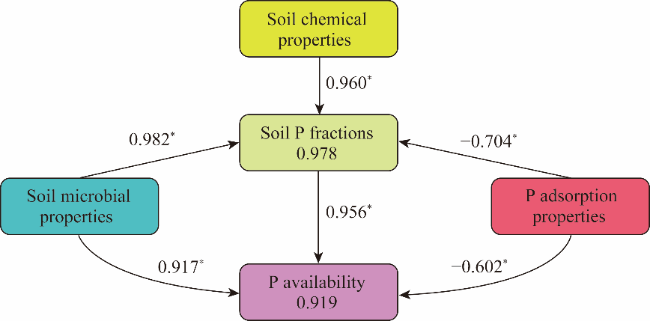
Fig. 5 Structural equation model illustrating the influence of microbial, soil chemical, and P adsorption properties on the distribution of soil P fractions and P availability. The numbers in frames represent the proportion of variance explained for the respective latent variable; while the numbers above arrows represent z-standardized path coefficients, of which, positive numbers represent positive relationship between two variables and negative numbers represent negative relationship between two variables. *, P<0.05 level.

4 Discussion

4.1 Effects of different land systems on soil chemical property and nutrient availability

The soil pH decreased in FS because of the leaching of base-forming cations beyond the sampled depths and also draining into streams by accelerated erosion (Yegna et al., 2024). In contrast, a gradual base release and deposition over time in tree- and grass-based restoration systems increased pH (Nyameasem et al., 2020). Higher pH values might reduce P fixation by preventing the development of insoluble P compounds in Fe and Al oxide rich soils (Johan et al., 2021). Slightly acidic to neutral pH could support microbial activity and phosphatase production, enhancing organic P mineralization. Conversely, low microbial activity and enzyme efficiency in acidic FS could restrict P cycling. Thus, land restoration systems that improved pH could minimize P fixation and support microbial driven P turnover. Furthermore, the land restoration systems showed higher EC than FS due to soil organic matter (SOM) mineralization (Meena et al., 2023). Tree-based restoration systems had more litterfall and denser rhizosphere networks, promoted SOC buildup (Berhongaray et al., 2019). The SCS showed the highest SOC due to greater rhizodeposition, litter, and root biomass. Higher SOC in restoration systems was attributed to organic matter inputs that stabilizing C (Singhal et al., 2025). Restoration practices promoted microbial activity, forming recalcitrant C and microbial organic matter while interactions with clay further protected SOC (Roy et al., 2025). Additionally, SOM boosted the AP content by gradually releasing P via microbial mineralization. Leaf litter decomposition also increased bioavailable N (Yan et al., 2022). The SCS and SPS contributed biologically fixed N in root zone (Smercina et al., 2019). Higher N availability promoted microbial activity, facilitating P mineralization and solubilization (Luo et al., 2020). The AK decreased across soil depth under restoration practices, possibly due to uptake from deeper soil depths and return via litterfall (Kaur et al., 2021; Phillips and Courtney, 2022).

4.2 Impact of restoration practices on soil microbial property

The DHA activity was higher in SCS than in FS, may be due to higher organic substrate availability (Li et al., 2024), consistent with previous findings from Meena and Rao (2021), in which DHA activity was higher in forest soil than in agricultural soil under a semi-arid climate. The N-rich leaf litter in SCS and SPS promoted mineralization, stimulating microbial activity (Brkljača et al., 2019). Increased DHA activity contributed to P availability by producing organic acids that can increase P desorption and reduce P adsorption. Phosphatase activity (both ACP and ALP) was also higher in tree-based restoration practices than in FS due to a greater supply of organic P from leaf litter (Bai et al., 2021). The SCS exhibited the highest phosphatase activity, both ACP and ALP, because of its extensive root system, mycorrhizal relationships, N fixation capacity, and rapid biomass production ability (Azene et al., 2023). Phosphatase enzymes could improve P availability by converting organic P into plant-available forms. Increased MBC content in restoration systems was driven by organic matter inputs from diverse tree species through litter breakdown (Agbeshie et al., 2020). The MBC, with its rapid turnover, could serve as a nutrient reservoir, releasing P during microbial decomposition. Previous studies reported the highest MBC content under mixed forests over agricultural and horticultural lands in semi-arid area (Kumar et al., 2018; Meena and Rao, 2021). The SCS exhibited the highest MBP content, which might be associated with increased SOC and TP.

4.3 Impact of restoration practices on P availability

The increased Sal-P in SCS across soil depths than FS is likely due to enhanced biological recycling via greater litter input (Wei et al., 2022). The continuous decomposition of organic matter can provide a steady supply of AP. Higher Fe-P and Al-P fractions in tree-based restoration systems were attributed to litterfall, rhizodeposition, and subsequent decomposition, which release Fe2+ and Al3+ into the soil solution (Karadihalli Thammaiah et al., 2023). Increased P availability promoted more interactions with Fe and Al ions, increasing P fractions (Wang et al., 2021). The moderately available fractions, i.e., Fe-P and Al-P, serve as long-term P sources through desorption, dissolution, and microbial breakdown. Similarly, Res-P, which is strongly associated with Fe and Al oxides, increased in restoration systems than FS and could be mobilized during wetting events (Martinengo, 2024). The FS exhibited the lowest Ca-P due to low pH and low Ca content (Ren et al., 2021). In contrast, tree- and grass-based restoration systems showed higher Ca-P, likely due to reduced leaching from canopy cover and Ca recycling from deeper layers (Velescu et al., 2021). The Ca-P, being soluble in acidic conditions under organic matter decomposition, contributes to P supply (Tian et al., 2021). Higher TP in restoration practices might be linked to extensive root networks drawing P from deeper layers and returning it to the surface via rhizodeposition and litterfall. The organic P increased due to inputs from litter and root exudates (Niederberger et al., 2019). The organic P plays a key role in long-term P availability through microbial mineralization (Chen et al., 2020). The AP increased under restoration strategies due to organic matter decomposition from leaf litter, root exudates, and rhizodeposition, which release P and organic acids (Ma et al., 2022), the solubilization of mineral P (Wang et al., 2023), and overall rise in inorganic and organic P fractions (Zhang et al., 2021).
In vegetation-based restoration practices (i.e., including NGS), phoshporus binding affinity declined as SOC increased, indicating weaker P binding (Yang et al., 2019). The maximum phoshporus adsorption capacity declined under restoration practices. The reduction might result from: (1) organic anions from organic matter mineralization competing with P for adsorption sites (Mabagala and Mng'ong'o, 2022); (2) interaction between organic matter and Fe and Al oxides reducing phoshporus binding affinity (Yang et al., 2022); and (3) organic matter forming a surface barrier that inhibited P adsorption (Wang et al., 2023). The changes allowed more P to remain in the soil solution. In SCS, significantly lower maximum phoshporus adsorption capacity and phoshporus binding affinity were correlated with greater P desorption and soil solution P, improving bioavailability. The FS showed higher P adsorption due to higher Fe and Al oxides (Ayenew et al., 2018). The number of phoshporus adsorption sites, decreased with organic matter addition in restoration practices (Yu et al., 2013). The lower values of the number of phoshporus adsorption sites and phosphorus bonding energy in SCS suggested higher desorption potential. The maximum phoshporus buffering capacity, an inverse indicator of P availability, was reduced under vegetation- based restoration practices due to declines in maximum phoshporus adsorption capacity and phoshporus binding affinity (Modak et al., 2024). The P desorption was limited in FS due to its higher contents of Fe and Al oxides and lower organic matter content (Roy et al., 2025). In contrast, increased P desorption observed in the restoration practices might due to higher content of litter and root biomass derived organic matter and enhanced microbial activity (Wang et al., 2017). Furthermore, the restoration practices contained lower amounts of Fe and Al oxides than FS, which help in increasing P availability by minimizing P fixation (Roy et al., 2025).

5 Conclusions

This study comprehensively evaluated the impact of different restoration practices, particularly N-fixing and high litter-producing tree species, on P dynamics in the semi-arid degraded soils in India. The findings demonstrated that tree-based restoration practices, specially SCS and SPS, significantly improved soil P availability by enhancing organic P mineralization and inorganic P solubilization. The implementation of tree-based restoration practices significantly altered P fractions. Also, the vegetation-based restoration practices changed the P adsorption behavior, including reduced phosphorus binding affinity, decreased maximum phosphorus adsorption capacity, and lowered the number of phosphorus adsorption sites. Tree-based restoration practices can directly influence soil phosphorus availability by altering adsorption-desorption behavior and enhancing microbial-mediated P mineralization in Fe- and Al-rich soils in the semi-arid areas in India. By identifying specific tree species (i.e., L. leucocephala and A. nilotica) that promote favorable changes in soil chemical and microbial properties, this study contributes to the design of site-adapted restoration practices. The findings can supplement the ongoing global efforts in climate-resilient and sustainable land management in nutrient-limited ecosystems. However, instead of focusing on a specific agroecological zone, further multi-regional research to test the generality and robustness of restoration practices is necessary. Future investigations should adopt an integrated approach combining microbial ecology, biogeochemistry, and restoration science to better understand soil-plant-microbe interactions.

Conflict of interests

The authors declare that they have no known competing financial interests or personal relationships that could have appeared to influence the work reported in this paper.

Acknowledgements

The authors appreciated the Director of Indian Council of Agricultural Research (ICAR)-Indian Grassland and Fodder Research Institute (IGFRI), Dr. Amaresh CHANDRA, for granting the use of the restoration lands. We also gratefully acknowledged the Division of Soil Science and Agricultural Chemistry, Indian Agricultural Research Institute, New Delhi, for providing necessary facilities. The first author Jyotirmay ROY acknowledged the MSc programme funded by Indian Council of Agricultural Research, Ministry of Agriculture and Farmers Welfare, India (AGRIL.EDN/1/1/2022-EXAM CELL).

Author contributions

Investigation: Jyotirmay ROY; Formal analysis: Jyotirmay ROY, Biraj Bandhu BASAK, Avijit GHOSH; Conceptualization: Dipak Ranjan BISWAS, Avijit GHOSH; Supervision: Dipak Ranjan BISWAS; Methodology: Ranjan BHATTACHARYYA, Shrila DAS, Sunanda BISWAS, Renu SINGH; Visualization: Dipak Ranjan BISWAS; Writing - original draft preparation: Jyotirmay ROY, Avijit GHOSH; Writing - review and editing: Jyotirmay ROY, Avijit GHOSH. All authors approved the manuscript.
[1]
Agbeshie A A, Abugre S, Adjei R, et al. 2020. Impact of land use types and seasonal variations on soil physico-chemical properties and microbial biomass dynamics in a tropical climate, Ghana. Advances in Research, 21(1): 34-49.

[2]
Anderson J M, Ingram J S I. 1993. Tropical Soil Biology and Fertility: A Handbook of Methods (2nd ed.). Wallingford: CAB International, 22-27.

[3]
Ayenew B, Tadesse A M, Kibret K, et al. 2018. Phosphorous status and adsorption characteristics of acid soils from Cheha and Dinsho districts, southern highlands of Ethiopia. Environmental Systems Research, 7: 17, doi: 10.1186/s40068-018-0121-1.

[4]
Azene B, Zhu R H, Pan K W, et al. 2023. Land use change alters phosphatase enzyme activity and phosphatase-harboring microbial abundance in the subalpine ecosystem of southeastern Qinghai-Tibet Plateau, China. Ecological Indicators, 153: 110416, doi: 10.1016/j.ecolind.2023.110416.

[5]
Bai X J, Dippold M A, An S S, et al. 2021. Extracellular enzyme activity and stoichiometry: The effect of soil microbial element limitation during leaf litter decomposition. Ecological Indicators, 121: 107200, doi: 10.1016/j.ecolind.2020.107200.

[6]
Bandyopadhyay S, Maiti S K. 2022. Steering restoration of coal mining degraded ecosystem to achieve sustainable development goal-13 (climate action): United Nations decade of ecosystem restoration (2021-2030). Environmental Science and Pollution Research, 29(59): 88383-88409.

[7]
Baradwal H, Ghosh A, Kumar A, et al. 2022. Ecological restoration of degraded lands with alternate land use systems improves soil functionality in semiarid tropical India. Land Degradation & Development, 33(7): 1076-1087.

[8]
Baradwal H, Ghosh A, Singh A K, et al. 2023. Soil nutrient dynamics under silviculture, silvipasture and hortipasture as alternate land-use systems in semi-arid environment. Forests, 14(1): 125, doi: 10.3390/f14010125.

[9]
Bardgett R D, Bullock J M, Lavorel S, et al. 2021. Combatting global grassland degradation. Nature Reviews Earth and Environment, 2(10): 720-735.

[10]
Barrow N J. 1980. Evaluation and utilization of residual phosphorus in soils. In: KhasawnehF E, SampleE C, KamprathE J. The Role of Phosphorus in Agriculture. Madison: American Society of Agronomy, 333-359.

[11]
Berhongaray G, Cotrufo F M, Janssens I A, et al. 2019. Below-ground carbon inputs contribute more than above-ground inputs to soil carbon accrual in a bioenergy poplar plantation. Plant and Soil, 434: 363-378.

[12]
Bohm W. 1979. Methods of Studying Root Systems. Berlin: Springer, 39-47.

[13]
Borggaard O K, Jdrgensen S S, Moberg J P, et al. 1990. Influence of organic matter on phosphate adsorption by aluminium and iron oxides in sandy soils. Journal of Soil Science, 41(3): 443-449.

[14]
Bray R H, Kurtz L T. 1945. Determination of total, organic, and available forms of phosphorus in soils. Soil Science, 59(1): 39-45.

[15]
Brkljača M, Kulišić K, Andersen B. 2019. Soil dehydrogenase activity and organic carbon as affected by management system. Agriculturae Conspectus Scientificus, 84(2): 135-142.

[16]
Brookes P C, Powlson D S, Jenkinson D S. 1982. Measurement of microbial biomass phosphorus in soil. Soil Biology and Biochemistry, 14(4): 319-329.

[17]
Casida Jr L E, Klein D A, Santoro T. 1964. Soil dehydrogenase activity. Soil Science, 98(6): 371-376.

[18]
Chakraborty D, Prasad R. 2023. Phosphorus management for agriculture and the environment. In: RouachedH B, SatbhaiS. PlantPhosphorus Nutrition. Boca Raton: CRC Press, 1-17.

[19]
Chave J, Réjou-Méchain M, Búrquez A, et al. 2014. Improved allometric models to estimate the aboveground biomass of tropical trees. Global Change Biology, 20(10): 3177-3190.

[20]
Chen J, van Groenigen K J, Hungate B A, et al. 2020. Long-term nitrogen loading alleviates phosphorus limitation in terrestrial ecosystems. Global Change Biology, 26(9): 5077-5086.

[21]
Chen L H, Dörsch P, Chen R S, et al. 2024. Contrasts in phosphorus speciation and supply across aggregates in subtropical forest soils with different lithology. Authorea Preprints, doi: 10.22541/au.172530519.91937079/v1.

[22]
Chen X D, Condron L M, Dunfield K E, et al. 2021. Impact of grassland afforestation with contrasting tree species on soil phosphorus fractions and alkaline phosphatase gene communities. Soil Biology and Biochemistry, 159: 108274, doi: 10.1016/j.soilbio.2021.108274.

[23]
Cui Y X, Fang L C, Guo X B, et al. 2019. Natural grassland as the optimal pattern of vegetation restoration in arid and semi-arid regions: Evidence from nutrient limitation of soil microbes. Science of the Total Environment, 648: 388-397.

[24]
Dai Z M, Liu G F, Chen H H, et al. 2020. Long-term nutrient inputs shift soil microbial functional profiles of phosphorus cycling in diverse agroecosystems. The ISME Journal, 14(3): 757-770.

[25]
Ferreira A C F, Andrade F V, Mendonça E D S, et al. 2022. Land use and altitude: How do they influence the phosphorus fractions? Acta Scientiarum: Agronomy, 44(1): e54801, doi: 10.4025/actasciagron.v44i1.54801.

[26]
Freundlich H M F. 1907. Uber die adsorption in Lösungen. Zeitschrift für Physikalische Chemie, 57(1): 385-470. (in German)

[27]
Fu D G, Wu X N, Duan C Q, et al. 2020. Response of soil phosphorus fractions and fluxes to different vegetation restoration types in a subtropical mountain ecosystem. CATENA, 193: 104663, doi: 10.1016/j.catena.2020.104663.

[28]
Guan X H, Shang C, Chen G H. 2006. Competitive adsorption of organic matter with phosphate on aluminum hydroxide. Journal of Colloid and Interface Science, 296(1): 51-58.

[29]
Hairiah K, Sitompul S M, van Noordwijk M, et al. 2001. Methods for sampling carbon stocks above and below ground. In: ASBLecture Note 4B. International Centre for Research in Agroforestry (ICRAF).Bogor, Indonesia,1-23.

[30]
Hanway J J, Heidal H. 1952. Soil analysis methods as used in Iowa State College Soil Testing Laboratory. Iowa State College of Agriculture Bulletin, 57(1): 1-31.

[31]
Hu L N, Li Q, Yan J H, et al. 2022. Vegetation restoration facilitates belowground microbial network complexity and recalcitrant soil organic carbon storage in Southwest China karst region. Science of the Total Environment, 820: 153137, doi: 10.1016/j.scitotenv.2022.153137.

[32]
Jackson M L. 1973. Soil Chemical Analysis. New Delhi: Prentice Hall of India Private Limited, 38-56.

[33]
Jackson R B, Canadell J, Ehleringer J R, et al. 1997. A global analysis of root distributions for terrestrial biomes. Oecologia, 108(3): 389-411.

[34]
Jin Z, Luo D, Yu Y L, et al. 2022. Soil pH changes in a small catchment on the Chinese Loess Plateau after long-term vegetation rehabilitation. Ecological Engineering, 175: 106503, doi: 10.1016/j.ecoleng.2021.106503.

[35]
Johan P D, Ahmed O H, Omar L, et al. 2021. Phosphorus transformation in soils following co-application of charcoal and wood ash. Agronomy, 11(10): 2010, doi: 10.3390/agronomy11102010.

[36]
Karadihalli Thammaiah M, Pandey R N, Purakayastha T J, et al. 2023. Impact of low molecular weight organic acids on soil Olsen phosphorus and its phyto-availability to soybean (Glycine max). Journal of Plant Nutrition, 46(5): 765-781.

[37]
Kaur T, Sehgal S K, Singh S, et al. 2021. Assessment of seasonal variability in soil nutrients and its impact on soil quality under different land use systems of lower Shiwalik foothills of Himalaya, India. Sustainability, 13(3): 1398, doi: 10.3390/su13031398.

[38]
Kumar P, Mishra A K, Chaudhari S K, et al. 2018. Carbon pools and nutrient dynamics under Eucalyptus-based agroforestry system in semi-arid region of north-west India. Journal of the Indian Society of Soil Science, 66(2): 188-199.

[39]
Kuo S. 1996. Phosphorus. In: SparksD L. Methodsof Soil Analysis.Part 3: Chemical Methods. Madison: ACSESS, 869-919.

[40]
Langmuir I. 1918. The adsorption of gases on plane surfaces of glass, mica and platinum. Journal of the American Chemical Society, 40(9): 1361-1403.

[41]
Li H Y, Chang L, Liu H J, et al. 2024. Diverse factors influence the amounts of carbon input to soils via rhizodeposition in plants: A review. Science of the Total Environment, 948: 174858, doi: 10.1016/j.scitotenv.2024.174858.

[42]
Li Y, Niu S L, Yu G R. 2016. Aggravated phosphorus limitation on biomass production under increasing nitrogen loading: a meta-analysis. Global Change Biology, 22(2): 934-943.

[43]
Luo G W, Xue C, Jiang Q H, et al. 2020. Soil carbon, nitrogen, and phosphorus cycling microbial populations and their resistance to global change depend on soil C:N:P stoichiometry. mSystems, 5(3): 00162-20, doi: 10.1128/msystems.00162-20.

[44]
Luo X Z, Hou E Q, Zhang L L, et al. 2023. Altered soil microbial properties and functions after afforestation increase soil carbon and nitrogen but not phosphorus accumulation. Biology and Fertility of Soils, 59(6): 645-658.

[45]
Ma W M, Tang S H, Dengzeng Z M, et al. 2022. Root exudates contribute to belowground ecosystem hotspots: A review. Frontiers in Microbiology, 13: 937940, doi: 10.3389/fmicb.2022.937940.

[46]
Mabagala F S, Mng'ong'o M E. 2022. On the tropical soils; The influence of organic matter (OM) on phosphate bioavailability. Saudi Journal of Biological Sciences, 29(5): 3635-3641.

[47]
Margenot A J, Singh B R, Rao I M, et al. 2016. Phosphorus fertilization and management in soils of Sub-Saharan Africa. In: LalR, StewartB A. SoilPhosphorus. Boca Raton: CRC Press, 151-208.

[48]
Martinengo S. 2024. Rhizosphere processes driving phosphorus cycling in rice systems. PhD Dissertation. Turin: University of Turin.

[49]
Meena A, Rao K S. 2021. Assessment of soil microbial and enzyme activity in the rhizosphere zone under different land use/cover of a semiarid region, India. Ecological Processes, 10: 16, doi: 10.1186/s13717-021-00288-3.

[50]
Meena G L, Sethy B K, Meena H R, et al. 2023. Quantification of impact of land use systems on runoff and soil loss from ravine ecosystem of western India. Agriculture, 13(4): 773, doi: 10.3390/agriculture13040773.

[51]
Modak K, Biswas D R, Bhattacharyya R, et al. 2024. Phosphorus adsorption and desorption as affected by long-term fertilization under rice-rice cropping system in an acidic Inceptisol. Journal of the Indian Society of Soil Science, 72(1): 56-65.

[52]
Murphy J, Riley J P. 1962. A modified single solution method for the determination of phosphate in natural waters. Analytica Chimica Acta, 27: 31-36.

[53]
Neffar S, Beddiar A, Menasria T, et al. 2022. Planting prickly pears as a sustainable alternative and restoration tool for rehabilitating degraded soils in dry steppe rangelands. Arabian Journal of Geosciences, 15: 287, doi: 10.1007/s12517-022-09579-1.

[54]
Niederberger J, Kohler M, Bauhus J. 2019. Distribution of phosphorus fractions with different plant availability in German forest soils and their relationship with common soil properties and foliar P contents. Soil, 5(2): 189-204.

[55]
Nyameasem J K, Reinsch T, Taube F, et al. 2020. Nitrogen availability determines the long-term impact of land use change on soil carbon stocks in grasslands of southern Ghana. Soil, 6(2): 523-539.

[56]
Padalia K, Bargali S S, Bargali K, et al. 2022. Soil microbial biomass phosphorus under different land use systems of Central Himalaya. Tropical Ecology, 63(1): 30-48.

[57]
Page A L, Miller R H, Keeney D R. 1982. Methods of Soil Analysis: Part 2 Chemical and Microbiological Properties (2nd ed.). Madison: American Society of Agronomy, 404-406.

[58]
Phillips I R, Courtney R. 2022. Long term field trials demonstrate sustainable nutrient supply and uptake in rehabilitated bauxite residue. Science of the Total Environment, 804: 150134, doi: 10.1016/j.scitotenv.2021.150134.

[59]
Ren C, Li Y F, Zhou Q, et al. 2021. Phosphate uptake by calcite: Constraints of concentration and pH on the formation of calcium phosphate precipitates. Chemical Geology, 579: 120365, doi: 10.1016/j.chemgeo.2021.120365.

[60]
Roy J, Biswas D R, Basak B B, et al. 2025. Long-term impact of silviculture systems on phosphorus transformation and adsorption behaviour in semi-arid restored lands. Agriculture, Ecosystems & Environment, 381: 109449, doi: 10.1016/j.agee.2024.109449.

[61]
Schaap K J, Fuchslueger L, Hoosbeek M R, et al. 2021. Litter inputs and phosphatase activity affect the temporal variability of organic phosphorus in a tropical forest soil in the Central Amazon. Plant and Soil, 469: 423-441.

[62]
Schofield R K, Taylor A W. 1955. The measurement of soil pH. Soil Science Society of America Journal, 19(2): 164-167.

[63]
Singhal V K, Ghosh A, Singh A K, et al. 2025. How grasses stabilize soil organic carbon in aggregates of semi-arid ecologically restored land: Evidence from 13C natural abundance. CATENA, 249: 108627, doi: 10.1016/j.catena.2024.108627.

[64]
Smercina D N, Evans S E, Friesen M L, et al. 2019. To fix or not to fix: controls on free-living nitrogen fixation in the rhizosphere. Applied and Environmental Microbiology, 85(6): e0254618, doi: 10.1128/AEM.02546-18.

[65]
Sun X D, Ye Y Q, Ma Q X, et al. 2021. Variation in enzyme activities involved in carbon and nitrogen cycling in rhizosphere and bulk soil after organic mulching. Rhizosphere, 19: 100376, doi: 10.1016/j.rhisph.2021.100376.

[66]
Tabatabai M A. 1994. Soil enzymes. Methods of Soil Analysis: Part 2 Microbiological and Biochemical Properties. Madison: American Society of Agronomy, 775-833.

[67]
Tian J, Ge F, Zhang D Y, et al. 2021. Roles of phosphate solubilizing microorganisms from managing soil phosphorus deficiency to mediating biogeochemical P cycle. Biology, 10(2): 158, doi: 10.3390/biology10020158.

[68]
Tuyishime J M, Adediran G A, Olsson B A, et al. 2022. Phosphorus abundance and speciation in acid forest podzols—Effect of postglacial weathering. Geoderma, 406: 115500, doi: 10.1016/j.geoderma.2021.115500.

[69]
Vance E D, Brookes P C, Jenkinson D S. 1987. An extraction method for measuring soil microbial biomass C. Soil Biology and Biochemistry, 19(6): 703-707.

[70]
Velescu A, Homeier J, Bendix J, et al. 2021. Response of water-bound fluxes of potassium, calcium, magnesium and sodium to nutrient additions in an Ecuadorian tropical montane forest. Forest Ecology and Management, 501: 119661, doi: 10.1016/j.foreco.2021.119661.

[71]
Walkley A, Black I A. 1934. An examination of the Degtjareff method for determining soil organic matter, and a proposed modification of the chromic acid titration method. Soil Science, 37(1): 29-38.

[72]
Wang B, Sun J S, Liu H, et al. 2017. The characteristics of phosphorus adsorption and desorption in gray desert soil of Xinjiang, China. IOP Conference Series: Earth and Environmental Science, 77: 012020, doi: 10.1088/1755-1315/77/1/012020.

[73]
Wang Q P, Liao Z Y, Yao D X, et al. 2021. Phosphorus immobilization in water and sediment using iron-based materials: a review. Science of the Total Environment, 767: 144246, doi: 10.1016/j.scitotenv.2020.144246.

[74]
Wang Y Y, Luo D H, Xiong Z Y, et al. 2023. Changes in rhizosphere phosphorus fractions and phosphate-mineralizing microbial populations in acid soil as influenced by organic acid exudation. Soil and Tillage Research, 225: 105543, doi: 10.1016/j.still.2022.105543.

[75]
Wei Y Q, Xiong X, Ryo M, et al. 2022. Repeated litter inputs promoted stable soil organic carbon formation by increasing fungal dominance and carbon use efficiency. Biology and Fertility of Soils, 58(6): 619-631.

[76]
Yan J L, Jiang T, Yao Y, et al. 2016. Preliminary investigation of phosphorus adsorption onto two types of iron oxide-organic matter complexes. Journal of Environmental Sciences, 42: 152-162.

[77]
Yan W D, Farooq T H, Chen Y, et al. 2022. Soil nitrogen transformation process influenced by litterfall manipulation in two subtropical forest types. Frontiers in Plant Science, 13: 923410, doi: 10.3389/fpls.2022.923410.

[78]
Yang S B, Feng C, Ma Y H, et al. 2021. Transition from N to P limited soil nutrients over time since restoration in degraded subtropical broadleaved mixed forests. Forest Ecology and Management, 494: 119298, doi: 10.1016/j.foreco.2021.119298.

[79]
Yang W L, Xiang W, Bao Z Y, et al. 2022. Phosphorus sorption capacity of various iron-organic matter associations in peat soils. Environmental Science and Pollution Research, 29(51): 77580-77592.

[80]
Yang X Y, Chen X W, Yang X T. 2019. Effect of organic matter on phosphorus adsorption and desorption in a black soil from Northeast China. Soil and Tillage Research, 187: 85-91.

[81]
Yegna E, Shiferaw W, Gochera A. 2024. The effects of various land use types on particular physicochemical characteristics of the soil in Mante Watershed, South Regional Government of Ethiopia. Applied and Environmental Soil Science, 2024(1): 1415819, doi: 10.1155/2024/1415819.

[82]
Yu W, Ding X, Xue S, et al. 2013. Effects of organic-matter application on phosphorus adsorption of three soil parent materials. Journal of Soil Science and Plant Nutrition, 13(4): 1003-1017.

[83]
Zhang H L, Kovar J L. 2009. Phosphorus fractionation. In: PierzynskiG M. Methods of Phosphorus Analysis for Soils, Sediments, Residualsand Waters. SouthernCooperative Series Bulletin No.396. Raleigh: North Carolina State University, 50-59.

[84]
Zhang Y Q, Finn D, Bhattacharyya R, et al. 2021. Long-term changes in land use influence phosphorus concentrations, speciation, and cycling within subtropical soils. Geoderma, 393: 115010, doi: 10.1016/j.geoderma.2021.115010.

[85]
Zhong H T, Smith C, Robinson B, et al. 2021. Soil phosphorus dynamics along a short‐term ecological restoration trajectory of a coastal sandplain forest in New Zealand. Land Degradation & Development, 32(3): 1250-1261.

[86]
Zhu H, Bing H J, Wu Y H, et al. 2021. Low molecular weight organic acids regulate soil phosphorus availability in the soils of subalpine forests, eastern Tibetan Plateau. CATENA, 203: 105328, doi: 10.1016/j.catena.2021.105328.

Outlines

/