Research article

Spatiotemporal distribution characteristics of clear-sky downward surface shortwave radiation in Xinjiang

  • HUANG Guan 1 ,
  • CHEN Yonghang 2 ,
  • WANG Pengtao , 1, * ,
  • FAN Ting 1 ,
  • HE Qing 3 ,
  • SHAO Weiling 4 ,
  • SUN Linlin 2
Expand
  • 1College of Tourism, Xi'an International Studies University, Xi'an 710128, China
  • 2College of Environmental Science and Engineering, Donghua University, Shanghai 201620, China
  • 3Taklimakan Desert Meteorology Field Experiment Station of CMA, Institute of Desert Meteorology, China Meteorological Administration (CMA), Urumqi 830002, China
  • 4Xinjiang Climate Center, Urumqi 830002, China
*WANG Pengtao (E-mail: )

Received date: 2025-01-04

  Revised date: 2025-04-07

  Accepted date: 2025-04-09

  Online published: 2025-08-13

Abstract

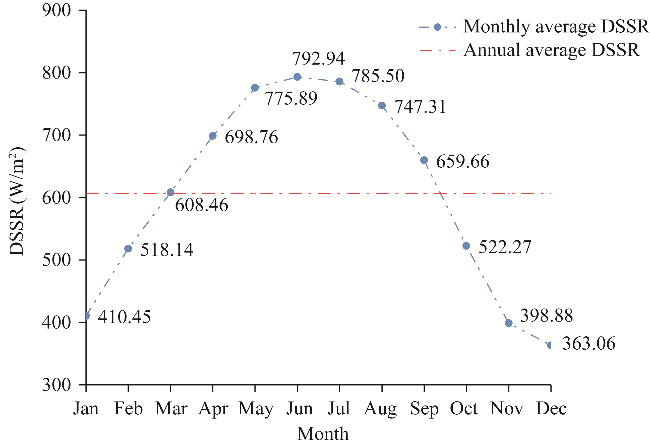
Given that Xinjiang Uygur Autonomous Region of China possesses exceptionally abundant solar radiation resources that can be harnessed to develop clean energy, accurately characterizing their spatiotemporal distribution is crucial. This study investigated the applicability of the Clouds and the Earth's Radiant Energy System (CERES) Single Scanner Footprint TOA/Surface Fluxes and Clouds (SSF) product downward surface shortwave radiation dataset (DSSRCER) under clear-sky conditions in Xinjiang. By integrating multi-source data and utilizing techniques like multivariate fitting and model simulation, we established a two-layer aerosol model and developed a clear-sky downward surface shortwave radiation (DSSR) retrieval model specific to Xinjiang using the Santa Barbara Discrete Atmospheric Radiative Transfer (SBDART) model. We further explored the spatiotemporal distribution characteristics of DSSR under clear-sky conditions in Xinjiang from 2017 to 2019 based on the localized DSSR retrieval model. Our findings revealed a significant discrepancy in DSSRCER under clear-sky conditions at the Xiaotang station in Xinjiang. By comparing, screening, and correcting core input parameters while incorporating the two-layer aerosol model, we achieved a more accurate SBDART simulated DSSR (DSSRSBD) compared to DSSRCER. The annual mean DSSR exhibited a distinct distribution pattern with high values in mountainous regions such as the Altay Mountains, Kunlun Mountains, and Tianshan Mountains and significantly lower values in adjacent lowland areas, including the Tarim River Basin and Junggar Basin. In the four typical administrative regions in northern Xinjiang, the annual mean DSSR (ranging from 551.60 to 586.09 W/m2) was lower than that in the five typical administrative regions in southern Xinjiang (ranging from 522.10 to 623.62 W/m2). These spatial variations stem from a complex interplay of factors, including latitude, altitude, solar altitude angle, and sunshine duration. The variations in seasonal average DSSR aligned closely with variations in the solar altitude angle, with summer (774.76 W/m2) exhibiting the highest values, followed by spring (684.86 W/m2), autumn (544.76 W/m2), and winter (422.74 W/m2). The monthly average DSSR showed a unimodal distribution, peaking in June (792.94 W/m2) and reaching its lowest level in December (363.06 W/m2). Overall, our study findings enhance the current understanding of the spatiotemporal distribution characteristics of DSSR in Xinjiang and provide certain references for the management of clean energy development in this region.

Cite this article

HUANG Guan , CHEN Yonghang , WANG Pengtao , FAN Ting , HE Qing , SHAO Weiling , SUN Linlin . Spatiotemporal distribution characteristics of clear-sky downward surface shortwave radiation in Xinjiang[J]. Journal of Arid Land, 2025 , 17(6) : 772 -790 . DOI: 10.1007/s40333-025-0081-z

1 Introduction

Global climate change presents a significant challenge to achieving sustainable development in the 21st century. The World Meteorological Organization confirmed 2023 as the hottest year on record, with a global average temperature 1.45°C (±0.12°C) higher than pre-industrial levels, exceeding prior records (WMO, 2024). Beyond rising temperatures, other key indicators—atmospheric greenhouse gas concentrations, ocean heat content, sea level, and sea ice extent—have reached unprecedented levels (Deng, 2024). Climate change further intensifies the threat to human societies through increased extreme weather events and heightened ecosystem vulnerability, becoming one of the world's most pressing issues (Smith et al., 2021; Luo et al., 2024). Carbon emissions from fossil fuel combustion have been recognized as the primary driver of global warming. In the context of global sustainable development and carbon neutral targets, adjusting the energy structure and developing clean energy sources represent the most effective means of reducing carbon emissions.
Shortwave radiation, a crucial energy source for Earth's ecosystems and a key driver of Earth's atmosphere and climate change, is increasingly seen as a vital component of green, low-carbon, renewable energy solutions compared to polluting fossil fuels like coal and oil. Xinjiang Uygur Autonomous Region, a traditional energy region with abundant sunshine and minimal cloud cover, boasts one of the regions with the highest annual shortwave radiation in China and presents significant potential for development (Gu et al., 2021). Accordingly, obtaining an accurate distribution of shortwave radiation in space and time is critical for effective utilization of solar energy resources, promoting production capacity cooperation within Xinjiang and surrounding Belt and Road regions, and predicting weather, climate, and environmental changes.
Ground-based observation offers the advantage of highly accurate and time-resolved surface shortwave radiation (SSR) data. This makes it an essential foundation for verifying other radiation datasets and for related application research. However, the limited number and uneven distribution of ground stations capable of radiation observation hinder the generation of spatially and temporally continuous SSR data (Liu, 2015; Huang et al., 2020b). Accordingly, a quantitative assessment of SSR over large areas and the analysis of its spatial characteristics have become challenging (Bao et al., 2019; Huang et al., 2023). Due to its wide-ranging spatial coverage and rather high resolution, satellite remote sensing technology overcomes these limitations. It enables comprehensive and large-scale monitoring, effectively counterbalancing the lack of ground stations, particularly in challenging locations (Huang et al., 2020a; Letu et al., 2020). However, due to the vast territory, complex underlying surface with mountains, snow, and deserts, and limited data availability over large areas in Xinjiang, it remains difficult for remote-sensing data to fully capture the spatiotemporal variations and trends of SSR in this region (Huang et al., 2020b; Yang and Bright, 2020; Li et al., 2021; Tang et al., 2021; Wang et al., 2021).
Reanalysis data, such as European Centre for Medium-Range Weather Forecasts (ECMWF) Reanalysis v5 (ERA5) and Modern-Era Retrospective Analysis for Research and Application, v2 (MERRA-2), leverage atmospheric modeling and assimilate multi-source data (ground observations and satellite remote sensing) to refine dynamic models, resulting in continuously improved accuracy and coverage (Betts et al., 2006). Compared to ground-based and remote sensing methods, reanalysis data offer a significant advantage in generating long and high-quality time series (Wang and Dickinson, 2013). However, uncertainties in data sources, assimilation schemes, and numerical prediction processes can introduce systematic errors into reanalysis data (Zhang et al., 2016; Meng et al., 2018; Urraca et al., 2018; Zhang et al., 2018; Wang, 2020; Tang et al., 2021). Overall, the limitations of all three methods (sparse ground observations, biases in satellite products, and uncertainties in reanalysis data) hinder a comprehensive and accurate understanding of the spatiotemporal distribution of solar radiation resources. Besides, the lack of high-quality data restricts our ability to fully capture the spatiotemporal variations of shortwave radiation (Sun et al., 2018), thereby restricting the utilization rate of solar energy.
Numerical simulation remains the most common method for obtaining high spatial and temporal resolution SSR data (Wei et al., 2019). This approach not only reveals the spatiotemporal distribution characteristics of SSR but also allows for studying the interaction and influence mechanisms between environmental meteorological elements (aerosols, temperature, and humidity) and SSR. This capability addresses and complements the limitations of the methods previously discussed. Research has shown the accuracy of radiative transfer models in simulating SSR, especially under clear-sky conditions (Li et al., 2017a; Shao et al., 2017; Qiao et al., 2019). However, most existing research relies on ground observation and satellite remote sensing data as inputs for the radiative transfer model to simulate SSR. During this process, the spatiotemporal variability of input parameters and their inherent errors, especially regarding the accuracy of aerosol characterization and vertical distribution, can affect the model simulation results to some extent (Huang et al., 2020b; Tana et al., 2023; Tang et al., 2023). Uncertainties in aerosol parameters retrieved from satellite remote sensing and the lack of comprehensive global data on aerosol vertical profiles make it particularly challenging to acquire accurate aerosol characteristics and simulate SSR in Xinjiang (Tao et al., 2017; Huang et al., 2020a).
Therefore, to obtain a more comprehensive downward surface shortwave radiation (DSSR) dataset and analyze its spatiotemporal distribution characteristics under clear-sky conditions in Xinjiang, this study investigated the key factors influencing DSSR retrieval based on the Clouds and the Earth's Radiant Energy System (CERES) Single Scanner Footprint TOA/Surface Fluxes and Clouds (SSF) Langley Parameterized Shortwave Algorithm (LPSA). Considering the exceptional weather conditions, underlying surface peculiarities, and environment-meteorology background in Xinjiang, we leveraged multi-source data and employed the Santa Barbara Discrete Atmospheric Radiative Transfer (SBDART) plane-parallel radiative transfer model to develop a region-specific clear-sky DSSR retrieval model for Xinjiang. Our approach addresses the limitations of scarce surface observations and error-prone satellite data and enhances our comprehension of the spatiotemporal distribution characteristics of SSR in Xinjiang.

2 Materials and methods

2.1 Overview of the research area

Xinjiang, situated deep within the Eurasian continent, experiences a classic temperate continental arid climate due to its distance from the sea (Yang et al., 2024). The region's topography (Fig. 1) is characterized by an alternating arrangement of mountains and basins, a pattern often described as "three mountains and two basins" (Yao et al., 2022). To the north is the Altay Mountains, to the south is the Kunlun Mountains, and the Tianshan Mountains lie across the middle, sandwiching the Tarim Basin and the Junggar Basin. Solar energy resources represent a significant portion of Xinjiang's technically recoverable renewable energy potential, accounting for 40.00%. This abundance of solar resources positions Xinjiang as the leading region in China for technically recoverable solar energy resources (Pomegranate Cloud/Xinjiang Daily News, 2025). The Gobi desert region of Xinjiang, classified as a Class I solar energy resource area, presents significant potential for large-scale solar power projects.
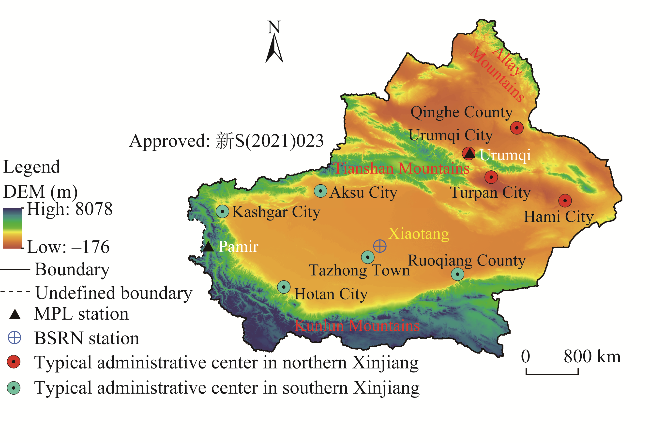
Fig. 1 Overview of Xinjiang Uygur Autonomous Region of China based on the digital elevation model (DEM) and geographical locations of ground observation stations. Noted that the figure is based on the standard map (No. 新S(2021)023) of the Xinjiang Uygur Autonomous Region Platform for Common Geospatial Information Services (https://xinjiang.tianditu.gov.cn/bzdt_code/bzdt.html#) marked by the Department of Natural Resources of Xinjiang Uygur Autonomous Region, and the boundary of the base map has not been modified. MPL, Micro Pulse Lidar; BSRN, Baseline Surface Radiation Network.
The Tianshan Mountains, which lie across the middle of Xinjiang, are the geographical "backbone" of Xinjiang and divide the natural geography of Xinjiang into two major regions, northern Xinjiang and southern Xinjiang. Nine administrative regions were selected for this study and they were categorized into southern and northern Xinjiang for analysis. The five administrative regions located in southern Xinjiang are Kashgar City, Hotan City, Ruoqiang County, Aksu City, and Tazhong Town. The four administrative regions in northern Xinjiang are Urumqi City, Turpan City, Qinghe County, and Hami City (Fig. 1).

2.2 Data

2.2.1 In situ observation data

Considering the accessibility of the observational data, this study utilized the measured DSSR data acquired from the Xiaotang radiation station, Xinjiang (Fig. 1). This station is a component of the Baseline Surface Radiation Network (BSRN). Ground-based observational DSSR (DSSRBSRN) data from Xiaotang station for the year 2017 were chosen for the validation and analysis of the CERES SSF LPSA based DSSR (DSSRCER), SBDART simulated DSSR (DSSRSBD), and ERA5-derived DSSR (DSSRERA5). The temporal resolution of DSSRBSRN is approximately 30 min.
Micro Pulse Lidar (MPL) measurements were employed to compare and validate regional planetary boundary layer height (PBLH) and aerosol layer height (ALH) (Huang et al., 2024b). Observations were conducted at two distinct geographical locations. The first station, Urumqi, provided MPL data spanning from 1 March to 19 April, 2017. The second station, Pamir, yielded MPL data from 15 August to 30 September, 2017. The geographical locations of both the BSRN and MPL stations are illustrated in Figure 1.

2.2.2 Satellite remote sensing data

This study utilized the "CERES downward SW surface flux-Model B" dataset (https://search. earthdata.nasa.gov/search) with a spatial resolution of approximately 20 km to develop and compare with a localized DSSR retrieval model. The key algorithm for this dataset is the LPSA (Gupta et al., 2001; Kratz et al., 2010, 2020), which has shown to be highly accurate and applicable in Xinjiang (Yang, 2019). More detailed information is available in the CERES_SSF_Terra-Aqua_Edition4A data instruction document and the study conducted by Huang et al. (2020b).
Besides, to build a localized radiative transfer model and acquire the DSSR of Xinjiang, we employed the "Deep_Blue_Aerosol_Optical_Depth_550_Land_Best_Estimate" dataset from Moderate Resolution Imaging Spectroradiometer (MODIS) Aqua satellite (Collection 6.1) at a resolution of 10 km (http://ladsweb.nascom.nasa.gov/datalsearch.html).
Owing to the deficiency of a more precise dataset regarding the calculation of the clear-sky surface albedo (AS), the LPSA algorithm currently employs the method put forward by Darnell et al. (1992), as shown in Equation 1:
${{A}_{S}}=1.3{{A}_{Tclr}}-0.07$,
where ATclr represents the top of atmosphere (TOA) albedo in clear-sky circumstances. In this study, the "Observed clear-sky TOA Albedo" dataset from the CER_SYN1deg-1Hour_Terra- Aqua-MODIS_Edition4A product (https://search.earthdata.nasa.gov/search) was employed as ATclr for calculating AS.
Furthermore, the "Clear area percent coverage at subpixel resolution" dataset (https://search. earthdata.nasa.gov/search) provided information on clear-sky conditions. Specifically, gridded radiation observation values were considered clear-sky observations when the cloud cover was zero.

2.2.3 Reanalysis data

This study utilized the reanalysis datasets from the MERRA-2 and ERA5. The total aerosol scattering aerosol optical depth (AOD) (TOTSCATAU) and total aerosol extinction AOD (TOTEXTTAU) datasets from the MERRA-2 tavg1_2d_aer_Nx product, featuring a 1-h temporal resolution, were used to calculate the Single Scattering Albedo (SSA) at 550 nm (Buchard et al., 2017; Randles et al., 2017). The Total Column Water Vapor (TCWV) dataset used for the LPSA algorithm was derived from the MERRA-2 tavg1_2d_slv_Nx product with the temporal resolution of 1 h.
ERA5 also contributed other hourly datasets: (1) mean surface downward shortwave radiation flux (spatial resolution of 0.250°×0.250°), used for comparison with satellite remote sensing data and model simulations; (2) boundary layer height (spatial resolution of 0.125°×0.125°); (3) atmospheric profiles including geopotential energy (z), temperature, relative humidity, horizontal wind speed (u, v), and vertical velocity (w), all with a spatial resolution of 0.125°×0.125°. The atmospheric profiles encompass pressure layers from 1000 to 1 hPa and were further divided into 37 layers for retrieving ALH. This ALH information, along with PBLH data, was used for constructing the aerosol model for Xinjiang. More details on these multiplatform datasets are provided in Table 1.
Table 1 Summary of data used in this study
Type Product Scientific dataset Spatial resolution Temporal resolution
In situ observation
data
- Measured DSSR from the Xiaotang
station
- 30 min
- MPL data acquired from Urumqi
and Pamir stations
- 60 min
Satellite remote
sensing data
CER_SSF_Aqua-FM3-
MODIS_Edition4A
CERES downward SW surface
flux-Model B
20 km -
Clear area percent coverage at subpixel
resolution
- -
CER_SYN1deg-1Hour_
Terra-Aqua-MODIS_Edition4A
Observed clear-sky TOA Albedo 1.000°×1.000° Hourly
C6.1 MYD04_L2 Deep_Blue_Aerosol_Optical_
Depth_550_Land_Best_Estimate
10 km -
Reanalysis data MERRA-2 tavg1_2d_aer_Nx TOTSCATAU; TOTEXTTAU 0.500°×0.625° Hourly
MERRA-2 tavg1_2d_slv_Nx TCWV 0.500°×0.625° Hourly
ERA5 hourly data on single
levels from 1979 to present
Mean surface downward shortwave
radiation flux
0.250°×0.250° Hourly
Boundary layer height 0.125°×0.125° Hourly
ERA5 hourly data on pressure levels from 1979 to present z; T; RH; u, v; w 0.125°×0.125° Hourly

Note: DSSR, downward surface shortwave radiation; MPL, Micro Pulse Lidar; CERES, Clouds and the Earth's Radiant Energy System; MERRA-2, Modern-Era Retrospective analysis for Research and Applications, Version 2; ERA5, European Centre for Medium-Range Weather Forecasts (ECMWF) Reanalysis v5; TOA, top of atmosphere; TOTSCATAU, total aerosol scattering aerosol optical depth (AOD); TOTEXTTAU, total aerosol extinction AOD; TCWV, Total Column Water Vapor; z, geopotential energy; T, temperature; RH, relative humidity; u, v, horizontal wind speed; w, vertical velocity. "-" means that this item has no content.

2.3 SBDART model

The SBDART radiative transfer model, relying on the assumption of a plane-parallel atmosphere and capable of calculating the radiation conditions of the atmosphere, and the surface under clear-sky and cloudy conditions (Huang et al., 2020b), was utilized as the foundation for simulating clear-sky DSSR across Xinjiang in our research. Table 2 displays the key input parameters required to run the SBDART model, which included location data (longitude and latitude) and time for calculating sun position and aerosol optical parameters at 550 nm. The aerosol data incorporated the AOD from MODIS, along with SSA, either from MERRA-2 or a fixed value of 0.92. The asymmetry (ASY) parameter was set to a fixed value of 0.60 or 0.59. Surface albedo data were drawn from CERES. To account for atmospheric effects, the model utilized TCWV, PBLH, and ALH obtained from reanalysis data. Default values within were employed for atmospheric profile (2), lower wavelength limit (0.250 μm), upper wavelength limit (4.000 μm), and wavelength step size (-0.005 μm) in the model.
Table 2 Key input parameters of SBDART
Parameter Meaning Unit Parameter Meaning Unit
iday Day of the year - wlbaer Wavelength (550 nm) nm
time UTC time in decimal hours - tbaer AOD (from MODIS) -
alat Latitude ° wbaer SSA (0.92 or calculated from MERRA-2) -
alon East longitude ° gbaer ASY (0.60 or 0.59) -
albcon Surface albedo (calculated using TOA albedo from CERES) - pbl PBLH (from ERA5) km
uw TCWV g/cm2 zbaer ALH (calculated from ERA5) km
iaer Aerosol model (user-defined) -

Note: SBDART, Santa Barbara Discrete Atmospheric Radiative Transfer; UTC, universal time coordinated; MODIS, Moderate Resolution Imaging Spectroradiometer; SSA, Single Scattering Albedo; ASY, asymmetry; PBLH, planetary boundary layer height; ALH, aerosol layer height. "-" means dimensionless.

2.4 Methods

2.4.1 Retrieval of gridded ALH

The vertical distribution of atmospheric aerosols is one of the key factors in assessing aerosol radiative forcing and evaluating climate effects (Yi et al., 2017). Influenced by emission sources, geographical environment, meteorological conditions, and other factors, the atmospheric thermal structure and aerosol optical properties can exert varying impacts depending on differences in aerosol vertical distribution, thereby affecting radiative balance and regional climate effects. Uncertainties in aerosol vertical distribution can introduce approximately 10.00%-30.00% errors in radiative effects (Loeb and Su, 2010; Zarzycki and Bond, 2010), while in regions dominated by absorbing aerosols, such errors may even exceed 70.00% (Samset et al., 2013). Besides, the vertical distribution of aerosols reflects the height and structural characteristics of the atmospheric boundary layer (Li et al., 2017b; Chu et al., 2019; Miao et al., 2019) and plays a significant role in studies of DSSR. This demonstrates that obtaining precise vertical distribution information of aerosols is crucial for the effective implementation of DSSR simulations.
In this study, the vertical distribution of aerosols was based on the assumption of a two-layer vertical structure of aerosols. Specifically, aerosols were assumed to be uniformly distributed below the atmospheric boundary layer, while above the boundary layer, the aerosol extinction coefficient (AEC) decreased exponentially with increasing altitude. From this, the AOD was calculated by integrating the AEC between the surface and the upper-level aerosol-free layer, and the height at which the AEC above the boundary layer was reduced to 1/e (approximately 37.00%) of its initial value was considered as the ALH corresponding to the MPL observation (He et al., 2008). This highlights that accurate knowledge of PBLH and ALH is crucial for understanding the vertical distribution of aerosols. For large-scale gridded PBLH data, existing datasets (i.e., MERRA-2, ERA5) are readily available. However, ALH must be derived through retrieval calculations.
Therefore, this study compared the vertical profiles of collocated MPL_ALH data with corresponding meteorological parameters from ERA5 reanalysis data. Our analysis revealed that relative humidity and the temperature gradient above the atmospheric boundary layer are key factors influencing ALH. By establishing discriminant factors and an automated retrieval method, ALH retrieval across the study area was achieved. Figure 2 presents the flowchart for the automated ALH retrieval algorithm developed for Xinjiang. The thresholds for each parameter were determined based on all MPL observations and corresponding meteorological data collected during the study period (Huang et al., 2024b).
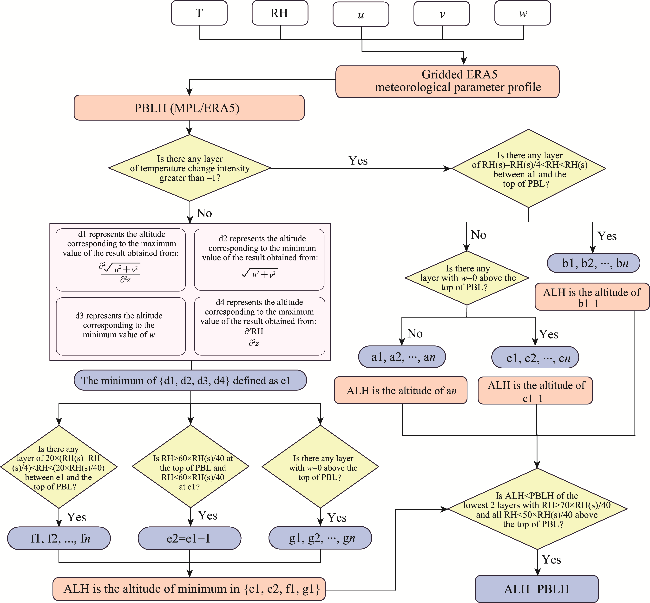
Fig. 2 Automatic flow chart algorithm for ALH retrieval based on ERA5 meteorological parameters. ALH, aerosol layer height; ERA5, European Centre for Medium-Range Weather Forecasts (ECMWF) Reanalysis v5; MPL, Micro Pulse Lidar; PBLH, planetary boundary layer height; PBL, planetary boundary layer; z, geopotential energy; T, temperature; RH, relative humidity; u, v, horizontal wind speed; w, vertical velocity; RH(s), the relative humidity of the lowest layer near the ground at the corresponding time and grid point; a1-an, the atmospheric layers at which the vertical temperature change intensity exceeds -1 (1-n are arranged in ascending order of altitude, the subsequent parameters adopt the same numbering pattern); b1-bn, the atmospheric layers between a1 and the top of the PBL, which meets temperature variation conditions and the judgment condition of RH; c1-cn, the atmospheric layers that with w=0 although the RH condition is not met; f1-fn, the atmospheric layers between e1 and the top of the PBL, which meets the judgment condition of RH; g1-gn, the atmospheric layers above the top of the PBL that with w=0.

2.4.2 Parameter matching and evaluation method

The data used in this study exhibited differences in both spatial and temporal scales, as highlighted in section 2.2. This necessitated spatiotemporal matching and unification of each parameter. To address this in the process of correcting the DSSRCER and establishing a localized DSSR transfer model, on the spatial scale, we selected the MODIS AOD and DSSRCER within a 30 km×30 km window centered on the Xiaotang station, and calculated the average of all non-zero values corresponding to the two parameters within the window. Other required datasets were interpolated to match the spatial resolution of MODIS AOD and DSSRCER (30 km×30 km). Temporally, DSSRBSRN data were extracted within a 10-min window before and after the Aqua satellite overpass time. Other parameters were matched temporally by averaging according to their inherent temporal resolutions.
Spatially, DSSRERA5 data within a 0.125° radius centered on the Xiaotang station were read and averaged to match the resolution of DSSRBSRN data. Temporally, DSSRERA5 data were selected based on the specific minute of the satellite overpass time. When the minutes fell between 41 and 20 (i.e., 14:45 and 15:12 (LST)), the nearest preceding whole hour DSSRERA5 data point was chosen. For minutes between 21 and 40 (i.e., 15:28 and 15:39), the average of the two closest whole-hour DSSRERA5 data points was used. This processed DSSRERA5 dataset was subsequently compared and analyzed in contrast to the DSSRSBD.
To simulate radiation data on a unified 0.100° grid across the Xinjiang region, all input parameters were spatially averaged at 0.100° resolution for DSSR simulation. Temporally, parameters were extracted within 30 min of the Aqua satellite's overpass time and averaged for matching purposes.
A statistical evaluation model was established to quantify the accuracy of the various research parameters. This model incorporated the linear correlation coefficient (r), relative mean bias (RMB), root mean square error (RMSE), and mean absolute error (MAE), along with the number of valid samples (n) remaining after matching. The formulas are as follows:
$r=\frac{\sum\nolimits_{i=1}^{n}{\left( {{S}_{i}}-\overline{S} \right)\left( {{O}_{i}}-\overline{O} \right)}}{\sqrt{\sum\nolimits_{i=1}^{n}{{{\left( {{S}_{i}}-\overline{S} \right)}^{2}}}}\sqrt{\sum\nolimits_{i=1}^{n}{{{\left( {{O}_{i}}-\overline{O} \right)}^{2}}}}}$,
$\text{RMB}={\overline{S}}/{\overline{O}}\;$,
$\text{RMSE}=\sqrt{\frac{1}{n}\sum\limits_{i=1}^{n}{{{\left( {{S}_{i}}-{{O}_{i}} \right)}^{2}}}}$,
$\text{MAE}=\frac{1}{n}\sum\limits_{i=1}^{n}{\left| {{S}_{i}}-{{O}_{i}} \right|}$,
where $\overline{S}$ and $\overline{O}$ denotes the average value of dependent variable and independent variable, respectively; and Si and Oi denotes the value of dependent variable and independent variable for the ith sample, respectively. The dependent variables primarily originated from the CERES, ERA5 reanalysis data, and radiative transfer model, such as DSSRCER (W/m2), DSSRSBD (W/m2), DSSRERA5 (W/m2), ERA5_PBLH (m), and ERA5_ALH (m). The independent variables were all ground-based observational results, such as DSSRBSRN (W/m2), MPL_PBLH (m), and MPL_ALH (m).

3 Results and discussion

3.1 Comparison between DSSRCER and DSSRSBD

This study used cloud cover and meteorological data to select the clear-sky cases at the Xiaotang station in 2017. Figure 3a presents the comparison results between DSSRCER and DSSRBSRN, with a notable discrepancy in the results produced by DSSRCER at the Xiaotang station. Under clear-sky conditions, the primary factors influencing the retrieval accuracy of DSSRCER, aside from the total ozone column content and surface pressure, comprised the following input parameters: AS, AOD, SSA, ASY, and TCWV (Gupta et al., 2001; Alexandri et al., 2017; Kratz et al., 2020). Yang (2019) showed that the accuracy of DSSRCER was greatly influenced by the aerosol optical parameters required for retrieval. To facilitate comparison, AS, AOD, SSA, ASY, and TCWV were used as inputs for SBDART model (with all other parameters set to default values). As shown in Figure 3b, DSSRSBD yielded slightly higher accuracy compared to DSSRCER. Although the correlation coefficient between DSSRCER and DSSRBSRN was higher than that between DSSRSBD and DSSRBSRN, both the slope and RMB of the DSSRSBD fitting line were closer to 1. Moreover, the intercept, MAE, and RMSE of the DSSRSBD fitting line were all lower than those of the DSSRCER fitting line.
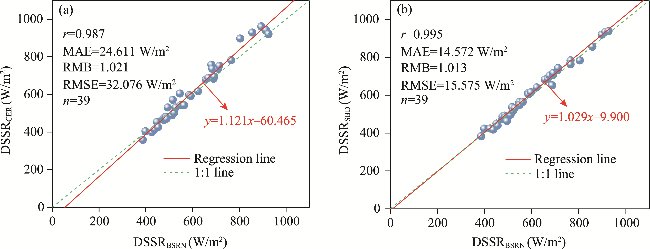
Fig. 3 Linear fitting results of DSSRCER (a) and DSSRSBD with initial parameter combination (b) under clear-sky conditions against DSSRBSRN at the Xiaotang station in 2017. DSSRCER, downward surface shortwave radiation (DSSR) retrieval using the Clouds and the Earth's Radiant Energy System (CERES) Single Scanner Footprint TOA/Surface Fluxes and Clouds (SSF) Langley Parameterized Shortwave Algorithm (LPSA); DSSRSBD, DSSR retrieval in the Santa Barbara Discrete Atmospheric Radiative Transfer (SBDART); DSSRBSRN, ground-based observational DSSR; r, correlation coefficient, MAE, mean absolute error; RMB, relative mean bias; RMSE, root mean square error.
These differences likely stemmed from variations in the types, versions, and temporal averaging ranges of the input parameters used by the two algorithms (Huang et al., 2020b). In this respect, the DSSRSBD simulation process involves more parameters, with the vertical distribution characteristics of aerosols and other atmospheric components considered in more detail (Xu et al., 2023). Besides, compared with DSSRCER, the DSSRSBD simulation utilized MODIS AOD data of a more recent version with higher accuracy (Huang et al., 2020a). Additionally, the SBDART model employed input parameters with a higher temporal resolution, predominantly averaged on an hourly basis.

3.2 Input parameter optimization and localized DSSR retrieval model construction

3.2.1 Sensitivity tests, comparison, and correction of parameters

Although DSSRSBD exhibited relatively high accuracy under clear-sky conditions, errors were observed. Our previous studies investigated the sensitivity of DSSRSBD to its key input parameters (SSA, ASY, AOD, TCWV, and AS) by varying each parameter individually by 100.00% while maintaining all others constant. The results showed that the change in retrieved values caused by varying each parameter were: 26.61% for SSA, 6.78% for ASY, -6.01% for AOD, -3.80% for TCWV, and 3.14% for AS. Among them, SSA yielded the greatest impact on DSSRSBD, followed by ASY and AOD. At the same time, we found that SSA, ASY, and AS inputs into the model were overestimated, while AOD and TCWV were underestimated (Huang et al., 2020b).
Therefore, to enhance the accuracy of DSSRSBD simulations, it is essential to improve the accuracy of critical input parameters. In this regard, when simulating DSSRSBD using SSA from MERRA-2 data, applying a regression coefficient correction (y=0.990x, where y denotes the corrected SSA and x represents the initial MERRA-2 SSA) yielded more accurate results compared to using a fixed value of 0.920. Similarly, selecting corrected AOD (y=1.030x, where y indicates the corrected AOD and x is the MODIS AOD) along with ASY=0.590 as model input parameters led to superior simulation outcomes relative to those based on the original inputs (Huang et al., 2020b). Table 3 details the individual fitting results after selectively choosing, comparing, and correcting these key input parameters.
Table 3 Fitting results of DSSRSBD and DSSRBSRN under different inputs at the Xiaotang station
Input r k b MAE (W/m2) RMB RMSE (W/m2)
Initial combination 0.995 1.029 -9.900 14.572 1.013 15.575
SSA after substitution and correction 0.995 1.028 -9.600 14.382 1.012 15.443
ASY after correction 0.995 1.027 -9.238 14.477 1.012 15.767
AOD after correction 0.995 1.026 -8.981 14.451 1.011 15.931
TCWV after substitution 0.995 1.041 -16.923 16.018 1.013 16.699
AS after substitution 0.995 1.032 -12.781 14.237 1.010 15.988

Note: DSSRSBD, SBDART simulated DSSR; DSSRBSRN, ground-based observational DSSR; AS, clear-sky surface albedo; r, correlation coefficient, MAE, mean absolute error; RMB, relative mean bias; RMSE, root mean square error. k is the slope of the fitting equation between DSSRSBD and DSSRBSRN; b is the intercept of the fitting equation between DSSRSBD and DSSRBSRN.

3.2.2 Construction and validation of the aerosol model

Figure 4 depicts the fitting results of MPL_PBLH and ERA5_PBLH at Urumqi and Pamir stations. Combined with results in Figure 4 and previous studies (Huang et al., 2024b), it was inferred that the gridded ERA5_PBLH dataset exhibited relatively high accuracy in the Xinjiang region. Accordingly, we selected the gridded ERA5_PBLH dataset as the core parameter of the aerosol model and used it to simulate the DSSRSBD with higher simulation accuracy.
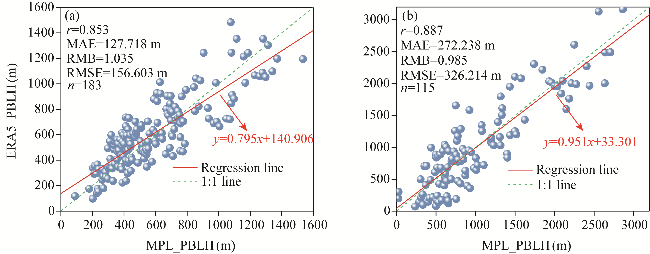
Fig. 4 Linear fitting results of MPL_PBLH and ERA5_PBLH at the Urumqi (a) and Pamir (b) stations
An automated workflow (Fig. 2) utilizing five meteorological parameters effectively retrieved ALH, with the retrieved ERA5_ALH demonstrating a good fit with MPL_ALH observations (Fig. 5). This workflow-derived ERA5_ALH product exhibited high applicability within the study area and could be used to represent the characteristic vertical distribution of gridded aerosols and further simulate DSSRSBD with higher precision.
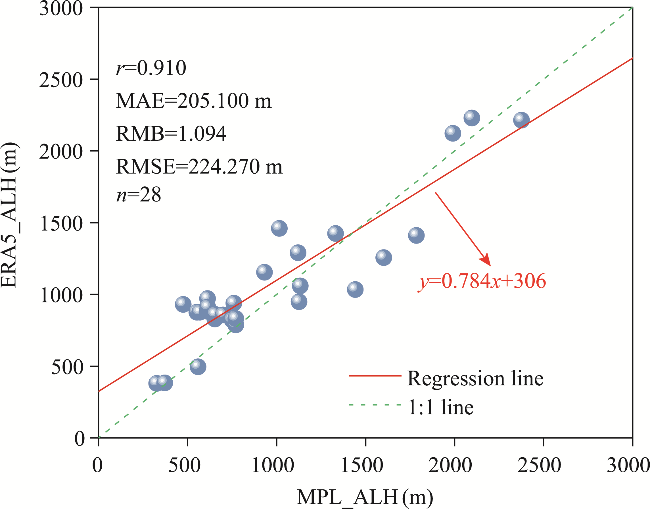
Fig. 5 Linear fitting results of MPL_ALH and ERA5_ALH at the Urumqi station

3.2.3 Establishment of the localized DSSR retrieval model

Following a process of screening, comparison, and correction, this study identified a set of optimal input parameters for model simulation based on their performance. These parameters, along with ERA5_PBLH data and ERA5_ALH retrieved using the workflow in Figure 2 (which incorporated temperature, relative humidity, u, v, and w), were entered into the SBDART. The input variables are detailed in Table 4.
Table 4 Optimal combination of SBDART inputs
Parameter Optimum dataset Parameter Optimum dataset
SSA MERRA-2 SSA after substitution and correction AS AS (same as the dataset used by CERES SSF LPSA)
ASY 0.590 (fixed value) PBLH ERA5_PBLH
AOD MODIS AOD after correction ALH ERA5_ALH (based on ERA5 meteorological parameters)
TCWV TCWV (same as the dataset used by CERES SSF LPSA)

Note: SSF, Single Scanner Footprint TOA/Surface Fluxes and Clouds; LPSA, Langley Parameterized Shortwave Algorithm.

Leveraging this optimal parameter combination, this study established a localized DSSR retrieval model. As shown in Table 5, all metrics for the clear-sky DSSR simulated by the optimized SBDART model (DSSRSBD_optimal) exhibited significant improvement compared to the DSSRCER at the Xiaotang station (r improved by 0.91%, MAE dropped by 49.56%, RMB decreased 1.18%, and RMSE reduced by 58.38%), indicating a substantial increase in retrieval accuracy and strongly supporting the feasibility of the research method.
Table 5 Linear fitting results of DSSRCER, DSSRSBD, and DSSRSBD_optimal with DSSRBSRN under clear-sky conditions at the Xiaotang station
DSSR source r k b MAE (W/m2) RMB RMSE (W/m2)
DSSRCER 0.987 1.121 -60.470 24.611 1.021 32.076
DSSRSBD 0.995 1.029 -9.900 14.572 1.013 15.575
DSSRSBD_optimal 0.996 1.023 -8.190 12.413 1.009 13.351

Note: DSSRCER, DSSR retrieval using the CERES SSF LPSA; DSSRSBD_optimal, DSSR retrieval based on the optimized SBDART model (namely the localized DSSR retrieval model).

To further confirm the significance of the localized DSSR retrieval model established in this study, the DSSRSBD_optimal was compared with the DSSRERA5 dataset (at 0.25°×0.25° resolution), whose estimations were correlated well with ground observations (Jiang et al., 2020). Figure 6 shows the comparison results of the accuracy between DSSRSBD_optimal and DSSRERA5. This comparison revealed that DSSRSBD_optimal not only surpassed the accuracy of DSSRCER in Xinjiang but also demonstrated significantly better performance than DSSRERA5. In general, the DSSRSBD_optimal dataset outperformed the commonly used DSSR datasets (including satellite remote sensing and reanalysis data) in terms of both accuracy and spatial resolution.
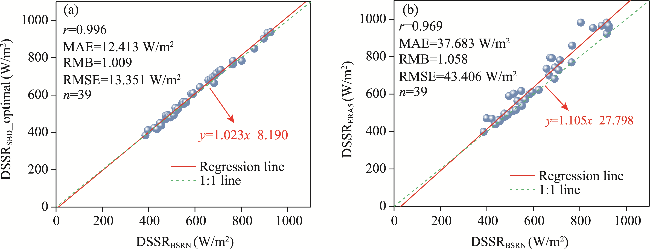
Fig. 6 Linear fitting results of DSSRSBD_optimal (a) and DSSRERA5 (b) with DSSRBSRN under clear-sky conditions at the Xiaotang station in 2017. DSSRSBD_optimal, DSSR retrieval based on the optimized SBDART model (namely the localized DSSR retrieval model); DSSRERA5, ERA5-derived DSSR.

3.3 Seasonal spatial characteristics of DSSR in Xinjiang

A recent study highlighted the limited spatial coverage of DSSRCER product as a key constraint (Huang et al., 2024b). Achieving 100.00% coverage was challenging, particularly in areas with complex underlying surfaces like high-altitude, snow-capped mountains. Satellite retrieval efforts in these areas were hampered by inherent difficulties, resulting in more frequent data gaps. In contrast, numerical simulation technology offers distinct advantages, not only in comprehensively depicting the spatiotemporal distribution characteristics of DSSR, but also in facilitating the investigation of how environmental and meteorological factors, such as aerosols, temperature, and humidity, interact with and influence DSSR (Zhao et al., 2017; Xu et al., 2023). This capability offered valuable supplementary information that complements satellite remote sensing products.
This study derived the seasonal distribution of DSSR under clear-sky conditions in Xinjiang during 2017-2019 from the DSSRSBD_optimal dataset (Fig. 7). Across all seasons, the DSSR exhibited high values in the mountainous regions and low values in the basin regions across the Xinjiang, likely due to the interplay of factors such as latitude, altitude, underlying surface properties, and climatic conditions.
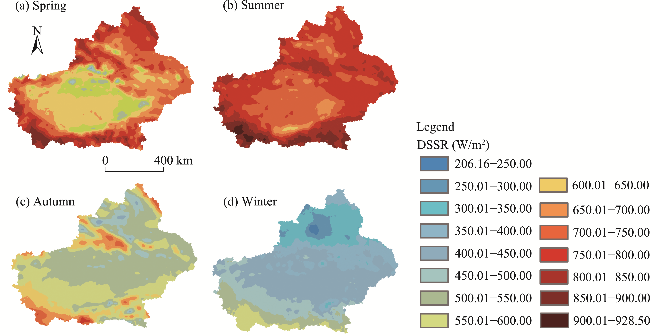
Fig. 7 Seasonal distribution of DSSR under clear-sky conditions in Xinjiang during 2017-2019. (a), spring; (b), summer; (c), autumn; (d), winter.
As shown in Figure 7, a significant seasonal variation in DSSR was observed across the Xinjiang. DSSR exhibited a clear pattern across the four seasons, decreasing in the order of summer, spring, autumn, and winter. This trend aligned with the seasonal variation in the solar altitude angle. In summer with the highest solar altitude angle, DSSR reached its peak. The overall average DSSR in the study area for summer was 774.76 W/m2, with gridded mean values ranging from 630.28 to 928.50 W/m2. In spring and autumn, DSSR values were in the ranges of 436.63-896.54 and 401.64-800.00 W/m2, respectively. The corresponding overall average DSSR for spring and autumn in the study area were 684.86 and 544.76 W/m2, respectively. In winter with the lowest solar altitude angle, the average DSSR reached its lowest level. The gridded mean values ranged from 206.16 to 603.30 W/m2, and the overall average DSSR in the study area was 422.74 W/m2.
Spring DSSR exhibited a distinct spatial distribution (Fig. 7a). The highest value (896.54 W/m2) occurred at the eastern end of the Kunlun Mountains, while the lowest values were concentrated in lake and river areas like the Ruoqiang River, Tarim River, and Lop Nur. In these areas, the spring average DSSR fell below 450.00 W/m2. Conversely, high DSSR values (over 750.00 W/m2) were documented in high-altitude mountainous regions such as the central and western Kunlun Mountains, Altay Mountains, and parts of northern Xinjiang (Tacheng Prefecture, Altay Prefecture, and Changji Hui Autonomous Prefecture). The Turpan Basin, Baijitan area, Kumtag Desert, Hami Basin (all in northern Xinjiang), and most of southern Xinjiang had spring average DSSR ranging from 550.00 to 650.00 W/m2.
Summer DSSR across Xinjiang was generally high (Fig. 7b). The peak value (928.50 W/m2) was observed in the southwest corner (western Kunlun Mountains), while the lowest value (630.28 W/m2) was found in the Bosten River area bordering the Hotan Prefecture and Bayingol Mongolian Autonomous Prefecture. The summer average DSSR for the Tarim Basin, Junggar Basin, Turpan Basin, and Hami Basin ranged from 650 to 750 W/m2. Most other regions exhibited even higher DSSR values, between 750 and 800 W/m2.
Autumn DSSR in Xinjiang revealed high-value areas (>700.00 W/m2) in high-altitude mountainous regions, such as the western Kunlun Mountains, the western and southern ridges of the Tianshan Mountains, and the northern edge of the Altay Mountains (Fig. 7c). Low-value areas (<500.00 W/m2) were scattered throughout the region, including the Burqin River and Ertix River, the Junggar Basin, the Tianshan North Slope Economic Belt (Karamay City, Shihezi City, Changji City, Urumqi City, etc.), the Turpan Basin and Hami Basin in northern Xinjiang, and the Bosten Lake Basin, Tarim River Basin, and Qiemo River Basin in southern Xinjiang. Most of the study area (over 68.00%) exhibited an autumn DSSR between 500.00 and 600.00 W/m2.
Winter DSSR across Xinjiang was very low and exhibited a clear latitudinal trend, decreasing gradually from south to north (Fig. 7d). The overall winter average DSSR in the study area was just 422.74 W/m2, only 54.56% of the summer value. The lowest gridded mean value (206.16 W/m2) was found in the Junggar Basin of northern Xinjiang. Only the southern end of the region (southern foothills of the Kunlun Mountains) had a higher winter DSSR (>600.0 W/m2). The winter DSSR fell between 300.00 and 500.00 W/m2 across more than 85.00% of the study area.
The primary driver of these seasonal variations is the solar altitude angle. Starting in March, DSSR in the Northern Hemisphere (including Xinjiang) increases with solar altitude angle. DSSR reaches its peak in summer, typically between June and July. As the solar altitude angle decreases throughout the rest of the year, the amount of DSSR reaching the ground diminishes accordingly. Climate, aerosol characteristics, and seasonal variations in aerosol load also influence DSSR. Summer typically has the lowest aerosol load among the four seasons. Spring and autumn are drier in Xinjiang, leading to frequent dust and sandstorms, which further increase the concentration of coarse particles and the overall aerosol load (Huang et al., 2020a), reducing surface solar radiation compared to summer. In autumn, higher water vapor content and greater vegetation cover on the underlying surface further weaken solar radiation compared to spring (Huang et al., 2024a). Winter heating contributes to higher anthropogenic aerosol content (Xiao et al., 2015), which also weakens the solar radiation reaching the ground. Daylight duration, solar altitude angle, and atmospheric transparency also play a role in the seasonal variations of DSSR in Xinjiang (Xie et al., 2019).

3.4 Monthly variations of DSSR in Xinjiang

Figure 8 depicts the variation in monthly average DSSR across Xinjiang from 2017 to 2019. The monthly DSSR fluctuated between 363.06 and 792.94 W/m2, with a three-year average of 606.78 W/m2. A notable monthly variation was observed, with the multi-year average DSSR approximating a unimodal, near-normal distribution. The maximum value was recorded in June (792.94 W/m2), with a gradual decline observed towards the minimum value in December (363.06 W/m2) on either side of this peak. As expected, in the Northern Hemisphere, DSSR primarily reflects changes in the solar altitude angle. From March onwards, the increasing solar altitude angle leads to a corresponding rise in solar radiation reaching the ground. After September, the decreasing solar altitude angle results in diminishing ground-level solar radiation. Therefore, the monthly DSSR variations in Xinjiang were largely driven by the solar altitude angle. Overall, the monthly average DSSR from March to September was higher than the annual average, while the remaining five months fell below the annual average value. This distinct seasonal cycle aligned with the seasonal analysis presented earlier.
Fig. 8 Monthly variation of DSSR in Xinjiang
The temporal variations in DSSR for typical administrative regions are illustrated in Figure 9. As shown in Figure 9a and Table 6, the annual average DSSR in the four administrative regions in northern Xinjiang ranged from 551.60 to 586.09 W/m2. Qinghe County in the Altay Prefecture exhibited the highest annual average DSSR (586.09 W/m2), particularly during the April-August period. The monthly average DSSR in Qinghe County during these months (743.39-828.17 W/m2) was significantly higher than the monthly average DSSR in the other three administrative regions. The monthly average DSSR in Qinghe County exhibited an almost symmetrical normal distribution, with a peak in June and a gradual decrease on either side. Besides, Qinghe County exhibited the highest monthly DSSR range (539.85 W/m2) compared to the other three administrative regions. This metric, representing the dispersion of monthly DSSR values, indicated a wider fluctuation in Qinghe County compared to the other three administrative regions. The larger range for Qinghe County highlighted a lower degree of concentration of monthly average DSSR values. The highest monthly average DSSR in this region occurred in June (828.17 W/m2), while the lowest monthly DSSR was found in January (296.62 W/m2) and December (288.32 W/m2), both below 300.00 W/m2.
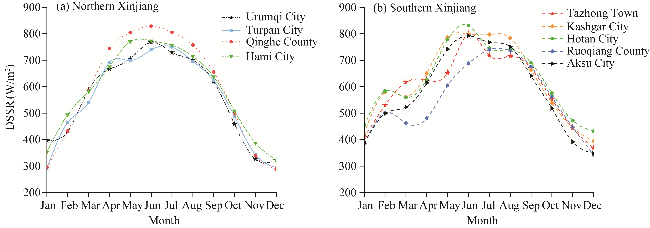
Fig. 9 Monthly DSSR variations of typical administrative regions in northern Xinjiang (a) and southern Xinjiang (b) during 2017-2019
Table 6 Statistics of DSSR of typical administrative regions in Xinjiang
Region Administrative region Annual average DSSR (W/m2) Maximum monthly
average DSSR (W/m2)
Minimum monthly average DSSR (W/m2) Range of monthly
average DSSR (W/m2)
Xinjiang - 606.78 792.94 363.06 429.88
Northern Xinjiang Urumqi City 559.21 767.66 321.72 445.94
Turpan City 551.60 749.87 292.43 457.44
Qinghe County 586.09 828.17 288.32 539.85
Hami City 581.20 772.91 321.85 451.06
Southern Xinjiang Kashgar City 618.64 798.88 393.99 404.89
Hotan City 623.62 830.66 431.17 399.49
Ruoqiang County 522.10 740.13 342.06 398.07
Aksu City 581.11 792.07 348.04 444.03
Tazhong Town 591.59 799.68 367.59 432.09

Note: "-" means that this item has no content.

Among the four administrative regions in northern Xinjiang, Turpan City exhibited the lowest annual average DSSR (551.60 W/m2). The highest monthly average DSSR occurred in July (749.87 W/m2), while the lowest was in January (292.43 W/m2). Turpan's average DSSR in December also fell below 300.00 W/m2. As shown in Figure 9a, Turpan City was the only region where the peak monthly DSSR occurred in July. In contrast, the monthly DSSR in the other three administrative regions peaked in June, with a gradual decrease on either side of the peak. The monthly DSSR variations in Urumqi City and Hami City aligned with the overall trend observed across Xinjiang. Both cities exhibited a unimodal distribution that closely resembled a normal curve. The peak monthly DSSR occurred in June (767.66 W/m2 for Urumqi City and 772.90 W/m2 for Hami City), followed by a gradual decrease on either side to reach minimum values in December (321.72 W/m2 for Urumqi City and 321.85 W/m2 for Hami City). The monthly DSSR ranges for Urumqi City and Hami City were 445.94 and 451.06 W/m2, respectively.
The four administrative regions in northern Xinjiang exhibited similar DSSR trends, with well-balanced patterns of increase and decrease throughout the year. The rates of increase in DSSR during the first half of the year (from January to April) were comparable to the rates of decrease in the second half (from September to December). Urumqi City, Turpan City, Qinghe County, and Hami City all showed a significant increase in DSSR from January to April. The average monthly increases for these regions were 89.54, 132.90, 149.26, and 106.99 W/m2, respectively. The change in DSSR from May to August was more moderate, particularly for Turpan City and Qinghe County, with total increases of only 4.34 and 13.50 W/m2, respectively. In contrast, Urumqi City and Hami City experienced larger increases of 34.60 and 39.87 W/m2, respectively, between May and August. Following the peak in May or June, all four administrative regions exhibited a decreasing trend, with average monthly decreases of 124.79 W/m2 in Urumqi City, 117.46 W/m2 in Turpan City, 139.24 W/m2 in Qinghe County, and 109.08 W/m2 in Hami City.
As shown in Figure 9b and Table 6, southern Xinjiang experienced a higher overall annual average DSSR compared to northern Xinjiang. The annual averages for the five administrative regions in southern Xinjiang ranged from 522.10 to 623.62 W/m2. Hotan City stood out with the highest annual average DSSR (623.62 W/m2). The highest monthly DSSR and lowest monthly DSSR were higher than those of the other four administrative regions in southern Xinjiang and exceeded the corresponding values (averages and maxima) observed in the four administrative regions in northern Xinjiang. Hotan's higher DSSR may be attributed to its southern location (37.08°N in latitude), leading to a greater solar altitude angle, longer sunshine duration, and relatively high altitude (approximately 1400 m). Among the five administrative regions, Ruoqiang County exhibited the lowest annual average DSSR (522.10 W/m2). Its monthly average DSSR from March to June was significantly lower than the other four administrative regions, attributed to its lower altitude (894 m) and the presence of rivers in the surrounding area. The range of monthly average DSSR for the five administrative regions in southern Xinjiang (398.07-444.03 W/m2) was lower than that observed in the four administrative regions in northern Xinjiang. This indicated a higher degree of concentration of monthly average DSSR values in the five administrative regions in southern Xinjiang.
The five administrative regions in southern Xinjiang exhibited a unique pattern in monthly DSSR distribution compared to Xinjiang as a whole and the four administrative regions in northern Xinjiang. In contrast to the typical "gradual decrease from the peak month on either side" pattern, four out of five administrative regions in southern Xinjiang (Kashgar City, Hotan City, Aksu City, and Tazhong Town) experienced their highest monthly DSSR in June. However, Ruoqiang County deviated from this trend, with the peak occurring in July. Furthermore, Kashgar City, Hotan City, and Ruoqiang County exhibited a bimodal monthly DSSR distribution, unlike the unimodal pattern observed elsewhere. This difference could be attributed to unstable weather conditions in southern Xinjiang in March. Frequent cold air outbreaks and strong winds, particularly within the Taklimakan Desert, contribute to dust and sandstorms. The resulting aerosols accumulate along the Kunlun Mountains, leading to lower DSSR values in these three regions in March.

4 Conclusions

Xinjiang boasts exceptional solar energy resources, presenting immense potential for development. To obtain refined spatiotemporal DSSR distributions under clear-sky conditions across Xinjiang, this study adopted a two-step approach. First, a two-layer aerosol model for Xinjiang was established on the basis of the ground observation data, satellite remote sensing products and reanalysis data. Second, a local clear-sky DSSR retrieval model for Xinjiang, which considered the environmental-meteorological background and atmospheric boundary layer conditions, was developed using the SBDART model.
Our findings suggested that DSSRCER exhibited significant errors under clear-sky conditions in Xinjiang. In contrast, the DSSRSBD demonstrated higher accuracy under the same input conditions. Sequential comparison, screening, and correction of five key input parameters (AOD, SSA, ASY, TCWV, and AS), as well as integrating the two-layer aerosol model, further enhanced the accuracy of DSSRSBD. For the distribution of seasonal mean DSSR within the study area, higher values were observed in the mountains and lower values were found in the basins. Southern Xinjiang exhibited a higher overall seasonal mean DSSR compared to northern Xinjiang. Seasonal variations in DSSR exhibited a strong correlation with solar altitude angle, with the highest average DSSR recorded in summer, followed by spring, autumn, and winter. Monthly DSSR in Xinjiang exhibited a unimodal distribution approximating a normal curve.
The results above provide valuable insights for optimizing regional energy infrastructure and facilitating solar energy site assessment. Furthermore, they offer theoretical data support and scientific evidence for the development of a clean, low-carbon, safe, and efficient energy system in Xinjiang and surrounding Belt and Road regions. However, the DSSR retrieval model was only developed under clear-sky conditions, emphasizing the need for more studies under different weather conditions, while simultaneously expanding the existing research framework to explore spatiotemporal DSSR distribution across Central Asia.

Conflict of interest

The authors declare that they have no known competing financial interests or personal relationships that could have appeared to influence the work reported in this paper.

Acknowledgements

This research was supported by the Science and Technology Planning Program of Xinjiang, China (2022E01047), the Natural Science Basic Research Program of Shaanxi (2025JC-YBQN-404), the 2025 Shaanxi Special Research Project of Philosophy and Social Sciences (2025QN0573), the Scientific Research Program Funded by Education Department of Shaanxi Provincial Government (23JK0625), and the National Natural Science Foundation of China (42030612). We are grateful to National Aeronautics and Space Administration (NASA) for providing Clouds and the Earth's Radiant Energy System (CERES), Moderate Resolution Imaging Spectroradiometer (MODIS), and Modern-Era Retrospective analysis for Research and Applications, Version 2 (MERRA-2) data, and express our gratitude to all the staffs in Xinjiang Uygur Autonomous Region Meteorological Service for establishing and maintaining the meteorological station. Besides, the principal investigators of the Baseline Surface Radiation Network site are appreciated for providing data on radiation.

Author contributions

Conceptualization: HUANG Guan, CHEN Yonghang; Methodology: HUANG Guan, CHEN Yonghang; Data curation: SHAO Weiling, FAN Ting; Validation: HUANG Guan; Formal analysis: HUANG Guan, SUN Linlin; Writing - original draft preparation: HUANG Guan; Writing - review and editing: HUANG Guan, WANG Pengtao, FAN Ting; Funding acquisition: HUANG Guan, CHEN Yonghang, HE Qing; Resources: HE Qing, SHAO Weiling; Supervision: CHEN Yonghang, WANG Pengtao. All authors approved the manuscript.
[1]
Alexandri G, Georgoulias A K, Meleti C, et al. 2017. A high resolution satellite view of surface solar radiation over the climatically sensitive region of Eastern Mediterranean. Atmospheric Research, 188: 107-121.

[2]
Bao S H, Letu H, Zhao C F, et al. 2019. Spatiotemporal distributions of cloud parameters and the temperature response over the Mongolian Plateau during 2006-2015 based on MODIS data. IEEE Journal of Selected Topics in Applied Earth Observations and Remote Sensing, 12(2): 549-558.

[3]
Betts A K, Zhao M, Dirmeyer P A, et al. 2006. Comparison of ERA40 and NCEP/DOE near-surface data sets with other ISLSCP-II data sets. Journal of Geophysical Research: Atmospheres, 111(D22): D22S04, doi: 10.1029/2006JD007174.

[4]
Buchard V, Randles C A, da Silva A M, et al. 2017. The MERRA-2 aerosol reanalysis, 1980 onward. Part II: evaluation and case studies. Journal of Climate, 30(17): 6851-6872.

[5]
Chu Y Q, Li J, Li C C, et al. 2019. Seasonal and diurnal variability of planetary boundary layer height in Beijing: Intercomparison between MPL and WRF results. Atmospheric Research, 227: 1-13.

[6]
Darnell W L, Staylor W F, Gupta S K, et al. 1992. Seasonal variation of surface radiation budget derived from international satellite cloud climatology project C 1 data. Journal of Geophysical Research: Atmospheres, 97(D14): 15741-15760.

[7]
Deng W F. 2024. Ocean warming and warning. Nature Climate Change, 14(2): 118-119.

[8]
Gu W, Guli J, Yi H M, et al. 2021. Spatial and temporal distribution characteristic and division research of solar energy resources in southern Xinjiang. Arid Land Geography, 44(6): 1665-1675. (in Chinese)

[9]
Gupta S K, Kratz D P, Stackhouse P W, et al. 2001. The Langley parameterized shortwave algorithm (LPSA) for surface radiation budget studies (version 1.0). In: NASA/TP-2001-211272. NASA Langley Research Center. Hampton, USA.

[10]
He Q S, Li C C, Mao J T, et al. 2008. Analysis of aerosol vertical distribution and variability in Hong Kong. Journal of Geophysical Research-Atmospheres, 113(D14): D14211, doi: 10.1029/2008JD009778.

[11]
Huang B C, Huang Y, Wu D, et al. 2024a. The influence of vegetation on climate elements in northwestern China. Atmosphere, 15(3): 325, doi: 10.3390/atmos15030325.

[12]
Huang G, Chen Y H, Li Z Q, et al. 2020a. Validation and accuracy analysis of the collection 6.1 MODIS aerosol optical depth over the Westernmost City in China based on the Sun-sky radiometer observations from SONET. Earth and Space Science, 7(3): e2019EA001041, doi: 10.1029/2019EA001041.

[13]
Huang G, Liu Q, Wang Y Y, et al. 2020b. The accuracy improvement of clear-sky surface shortwave radiation derived from CERES SSF dataset with a simulation analysis. Science of the Total Environment, 749: 141671, doi: 10.1016/j.scitotenv.2020.141671.

[14]
Huang G, Zhou Y M, Guo Z J, et al. 2023. The influence of dust aerosols on solar radiation and near-surface temperature during a severe duststorm transport episode. Frontiers in Environmental Science, 11: 1126302, doi: 10.3389/fenvs.2023.1126302.

[15]
Huang G, Chen Y H, Liu Q, et al. 2024b. Accurate shortwave radiation simulation with a two-layer aerosol model in Xinjiang region. Journal of Meteorological Research, 38(1): 69-87.

[16]
Jiang H, Yang Y P, Bai Y Q, et al. 2020. Evaluation of the total, direct, and diffuse solar radiations from the ERA 5 reanalysis data in China. IEEE Geoscience and Remote Sensing Letters, 17(1): 47-51.

[17]
Kratz D P, Gupta S K, Wilber A C, et al. 2010. Validation of the CERES edition 2B surface-only flux algorithms. Journal of Applied Meteorology and Climatology, 49(1): 164-180.

[18]
Kratz D P, Gupta S K, Wilber A C, et al. 2020. Validation of the CERES edition-4A surface-only flux algorithm. Journal of Applied Meteorology and Climatology, 59(2): 281-295.

[19]
Letu H S, Yang K, Nakajima T Y, et al. 2020. High-resolution retrieval of cloud microphysical properties and surface solar radiation using Himawari-8/AHI next-generation geostationary satellite. Remote Sensing of Environment, 239: 111583, doi: 10.1016/j.rse.2019.111583.

[20]
Li R H, Wang D D, Liang S L. 2021. Comprehensive assessment of five global daily downward shortwave radiation satellite products. Science of Remote Sensing, 4: 100028, doi: 10.1016/j.srs.2021.100028.

[21]
Li W W, Letu H S, Chen H B, et al. 2017a. Estimation of surface solar radiation using MODIS satellite data and RSTAR model. Remote Sensing Technology and Application, 32(4): 643-650. (in Chinese)

[22]
Li Z Q, Guo J P, Ding A J, et al. 2017b. Aerosol and boundary-layer interactions and impact on air quality. National Science Review, 4(6): 810-833.

[23]
Liu Y, Zhang X F, Li J, et al. 2015. Estimation and seasonal variation of solar radiation in Xinjiang based on a multi-sensor data approach. Journal of Arid Land Resources and Environment, 29(3): 161-165. (in Chinese)

[24]
Loeb N G, Su W Y. 2010. Direct aerosol radiative forcing uncertainty based on a radiative perturbation analysis. Journal of Climate, 23(19): 5288-5293.

[25]
Luo X, Zhang X Z, Xu Y, et al. 2024. Behavioral responses of intertidal clams to compound extreme weather and climate events. Marine Pollution Bulletin, 200: 116112, doi: 10.1016/j.marpolbul.2024.116112.

[26]
Meng X G, Guo J J, Han Y Q, et al. 2018. Preliminarily assessment of ERA 5 reanalysis data. Journal of Marine Meteorology, 38(1): 91-99. (in Chinese)

[27]
Miao Y C, Li J, Miao S G, et al. 2019. Interaction between planetary boundary layer and PM2.5 pollution in megacities in China: a review. Current Pollution Reports, 5(4): 261-271.

[28]
Pomegranate Cloud/Xinjiang Daily News. 2025. 2025 Xinjiang Two Sessions • In-Depth | How Xinjiang's wind and solar advantages can be transformed into a development edge? [2025-02-14].https://www.xjmty.com/yw/202501/t20250119_26282340_web.html. in Chinese)

[29]
Qiao Y, Zhang J, Xue W H, et al. 2019. Aerosol influence on surface solar radiation in China and Indian from 2011 to 2014 as judged by Fu-Liou model. Journal of Beijing Normal University (Natural Science), 55(1): 114-120. (in Chinese)

[30]
Randles C A, da Silva A M, Buchard V, et al. 2017. The MERRA-2 aerosol reanalysis, 1980-onward, part I: system description and data assimilation evaluation. Journal of Climate, 30(17): 6823-6850.

[31]
Samset B H, Myhre G, Schulz M, et al. 2013. Black carbon vertical profiles strongly affect its radiative forcing uncertainty. Atmospheric Chemistry and Physics, 13(5): 2423-2434.

[32]
Shao S Y, Zhang J, Zhou L H, et al. 2017. Aerosol effects on global surface solar radiation based on Fu-Liou modeling and satellite observations. Resources Science, 39(3): 513-521. (in Chinese)

[33]
Smith K E, Burrows M T, Hobday A J, et al. 2021. Socioeconomic impacts of marine heatwaves: global issues and opportunities. Science, 374(6566): eabj3593, doi: 10.1126/science.abj3593.

[34]
Sun D Z, Ji C D, Sun W X, et al. 2018. Accuracy assessment of three remote sensing shortwave radiation products in the Arctic. Atmospheric Research, 212: 296-308.

[35]
Tana G, Ri X, Shi C, et al. 2023. Retrieval of cloud microphysical properties from Himawari-8/AHI infrared channels and its application in surface shortwave downward radiation estimation in the sun glint region. Remote Sensing of Environment, 290: 113548, doi: 10.1016/j.rse.2023.113548.

[36]
Tang C Q, Shi C, Letu H S, et al. 2023. Evaluation and uncertainty analysis of Himawari-8 hourly aerosol product version 3.1 and its influence on surface solar radiation before and during the COVID-19 outbreak. Science of the Total Environment, 892: 164456, doi: 10.1016/j.scitotenv.2023.164456.

[37]
Tang W J, Qin J, Yang K, et al. 2021. Does ERA 5 outperform satellite products in estimating atmospheric downward longwave radiation at the surface? Atmospheric Research, 252: 105453, doi: 10.1016/j.atmosres.2021.105453.

[38]
Tao M H, Chen L F, Wang Z F, et al. 2017. Evaluation of MODIS deep blue aerosol algorithm in desert region of East Asia: Ground validation and intercomparison. Journal of Geophysical Research: Atmospheres, 122(19): 10357-10368.

[39]
Urraca R, Huld T, Gracia-Amillo A, et al. 2018. Evaluation of global horizontal irradiance estimates from ERA5 and COSMO-REA6 reanalyses using ground and satellite-based data. Solar Energy, 164: 339-354.

[40]
Wang G F, Wang T X, Xue H Z. 2021. Validation and comparison of surface shortwave and longwave radiation products over the three poles. International Journal of Applied Earth Observations and Geoinformation, 104: 102538, doi: 10.1016/j.jag. 2021.102538.

[41]
Wang H H. 2020. Estimation of downward radiation based on multi-source data fusion. MSc Thesis. Changchun: Jilin University. (in Chinese)

[42]
Wang K C, Dickinson R E. 2013. Global atmospheric downward longwave radiation at the surface from ground-based observations, satellite retrievals, and reanalysis. Reviews of Geophysics, 51(2): 150-185.

[43]
Wei Y, Zhang X T, Hou N, et al. 2019. Estimation of surface downward shortwave radiation over China from AVHRR data based on four machine learning methods. Solar Energy, 177: 32-46.

[44]
WMO (World Meteorological Organization). 2024. State of the Global Climate 2023. Geneva: WMO.

[45]
Xiao Q Y, Ma Z W, Li S S, et al. 2015. The impact of winter heating on air pollution in China. PLoS ONE, 10(1): e0117311, doi: 10.1371/journal.pone.0117311.

[46]
Xie Y, Wen J, Liu R, et al. 2019. An initial analysis of characteristics of radiation budget near ground in alpine wetland in source area of the Yellow River. Acta Energiae Solaris Sinica, 40(1): 1-10. (in Chinese)

[47]
Xu X F, Pan S X, Luo T Y, et al. 2023. Characteristics of optical properties and heating rates of dust aerosol over Taklimakan Desert and Tibetan Plateau in China based on CALIPSO and SBDART. Remote Sensing, 15(3): 607, doi: 10.3390/rs15030607.

[48]
Yang D Z, Bright J M. 2020. Worldwide validation of 8 satellite-derived and reanalysis solar radiation products: A preliminary evaluation and overall metrics for hourly data over 27 years. Solar Energy, 210: 3-19.

[49]
Yang F J. 2019. Study on errors of surface shortwave radiation from Aqua/CERES/SSF and its aerosol's influence under clear-sky in Xinjiang. MSc Thesis. Shanghai: Donghua University. (in Chinese)

[50]
Yang J H, Li Y Q, Zhou L, et al. 2024. Effects of temperature and precipitation on drought trends in Xinjiang, China. Journal of Arid Land, 16(8): 1098-1117.

[51]
Yao J Q, Chen Y N, Guan X F, et al. 2022. Recent climate and hydrological changes in a mountain-basin system in Xinjiang, China. Earth-Science Reviews, 226: 103957, doi: 10.1016/j.earscirev.2022.103957.

[52]
Yi N N, Zhang L, Liu W P, et al. 2017. Optical characteristics and radiative effects of atmospheric aerosol over Northwest China. Chinese Journal of Atmospheric Sciences, 41(2): 409-420. (in Chinese)

[53]
Zarzycki C M, Bond T C. 2010. How much can the vertical distribution of black carbon affect its global direct radiative forcing? Geophysical Research Letters, 37(20), doi: 10.1029/2010GL044555.

[54]
Zhang X T, Liang S L, Wang G X, et al. 2016. Evaluation of the reanalysis surface incident shortwave radiation products from NCEP, ECMWF, GSFC, and JMA using satellite and surface observations. Remote Sensing, 8(3): 225, doi: 10.3390/rs8030225.

[55]
Zhang X X, N, Yao L, et al. 2018. Error analysis of ECMWF surface solar radiation data in China. Journal of Geo-information Science, 20(2): 254-267. (in Chinese)

[56]
Zhao J, Yan G J, Jiao Z H, et al. 2017. Enhanced shortwave radiative transfer model based on SBDART. Journal of Remote Sensing, 21(6): 853-863. (in Chinese)

Outlines

/