Research article

Effects of temperature and precipitation on drought trends in Xinjiang, China

  • YANG Jianhua , 1, * ,
  • LI Yaqian 1 ,
  • ZHOU Lei 2 ,
  • ZHANG Zhenqing 1 ,
  • ZHOU Hongkui 3 ,
  • WU Jianjun 1, 4
Expand
  • 1Academy of Eco-civilization Development for Jing-Jin-Ji Megalopolis, Tianjin Normal University, Tianjin 300387, China
  • 2School of Geomatics and Urban Spatial Informatics, Beijing University of Civil Engineering and Architecture, Beijing 100044, China
  • 3Institute of Digital Agriculture, Zhejiang Academy of Agricultural Sciences, Hangzhou 310021, China
  • 4Faculty of Geographical Science, Beijing Normal University, Beijing 100875, China
*YANG Jianhua (E-mail: )

Received date: 2024-04-30

  Revised date: 2024-07-26

  Accepted date: 2024-07-30

  Online published: 2025-08-13

Abstract

The characteristics of drought in Xinjiang Uygur Autonomous Region (Xinjiang), China have changed due to changes in the spatiotemporal patterns of temperature and precipitation, however, the effects of temperature and precipitation—the two most important factors influencing drought—have not yet been thoroughly explored in this region. In this study, we first calculated the standard precipitation evapotranspiration index (SPEI) in Xinjiang from 1980 to 2020 based on the monthly precipitation and monthly average temperature. Then the spatiotemporal characteristics of temperature, precipitation, and drought in Xinjiang from 1980 to 2020 were analyzed using the Theil-Sen median trend analysis method and Mann-Kendall test. A series of SPEI-based scenario-setting experiments by combining the observed and detrended climatic factors were utilized to quantify the effects of individual climatic factor (i.e., temperature and precipitation). The results revealed that both temperature and precipitation had experienced increasing trends at most meteorological stations in Xinjiang from 1980 to 2020, especially the spring temperature and winter precipitation. Due to the influence of temperature, trends of intensifying drought have been observed at spring, summer, autumn, and annual scales. In addition, the drought trends in southern Xinjiang were more notable than those in northern Xinjiang. From 1980 to 2020, temperature trends exacerbated drought trends, but precipitation trends alleviated drought trends in Xinjiang. Most meteorological stations in Xinjiang exhibited temperature-dominated drought trend except in winter; in winter, most stations exhibited precipitation-dominated wetting trend. The findings of this study highlight the importance of the impact of temperature on drought in Xinjiang and deepen the understanding of the factors influencing drought.

Cite this article

YANG Jianhua , LI Yaqian , ZHOU Lei , ZHANG Zhenqing , ZHOU Hongkui , WU Jianjun . Effects of temperature and precipitation on drought trends in Xinjiang, China[J]. Journal of Arid Land, 2024 , 16(8) : 1098 -1117 . DOI: 10.1007/s40333-024-0105-0

1 Introduction

Drought is usually caused by precipitation persistently remaining below the normal condition or an imbalance between evapotranspiration and precipitation. Globally, the characteristics of drought have been altered in the context of climate change (He et al., 2015; Wang et al., 2017), and drought events have become more frequent and severe (Dai, 2013; Naumann et al., 2018; Wahl et al., 2022). Drought notably impacts agricultural, ecological, and socioeconomic security and stability (Ding et al., 2020; Hu et al., 2021b; Li et al., 2021; Chen et al., 2023; Fleming-Munoz et al., 2023), and the adverse effects of drought will increase further in the future. Understanding the characteristics of drought is necessary for regional management of drought disaster. Precipitation is a factor that directly influences drought, and temperature can also affect drought by influencing potential evapotranspiration (PET) (Wang et al., 2016b; Wu and Chen, 2019; Zhao et al., 2021; Wang et al., 2022a). In the context of climate change, increased PET due to rising temperature coupled with uncertainty relating to extreme precipitation (Easterling et al., 2007), influences the dynamics of drought (Wang et al., 2016b; Wang et al., 2022b).
A series of drought indices have been proposed for monitoring drought and assessing its impacts (Bachmair et al., 2016; Raposo et al., 2023). Among these, the standardized precipitation index (SPI), the standardized precipitation evapotranspiration index (SPEI), and the Palmer drought severity index (PDSI) have been widely applied at the regional and global scales (Leng et al., 2020; Li et al., 2020; Zhao and Jing, 2022; Han and Singh, 2023; Han et al., 2023; Kim et al., 2023). Unlike the SPI, the SPEI considers the influence of temperature on drought. Drought monitoring is generally based on the difference between precipitation and PET, thus the SPEI is particularly suitable for assessment of drought against the background of global climate change (Vicente-Serrano et al., 2010; Yao et al., 2018; Yao et al., 2021; Zhang et al., 2021; Bai et al., 2023). The SPEI was chosen as the drought index in this study also because it requires less data than the PDSI and it can be used to monitor drought at different time scales. Zhao et al. (2021) used 3-month-time scale SPEI in May, August, November, and February to represent the drought conditions in spring, summer, autumn, and winter, respectively, and used 12-month-time scale SPEI in December to represent the annual drought condition.
Extensive research has examined the spatiotemporal characteristics of drought and has provided references for the formulation of drought-adaptation policies. Some studies focused on the influences of meteorological factors such as precipitation and temperature on drought (Wu and Chen, 2019; Zhao et al., 2021; Wang et al., 2022a; Zhang et al., 2022) and found that the dominated influencing factors on drought vary in different regions. In general, increased precipitation can relieve the intensification of drought that results from increased temperature. It has been shown that the influence of temperature on drying-wetting trends is usually greater than that of precipitation in the Pearl River Basin (Wu and Chen, 2019) and the Songnen Plain (Zhao et al., 2021); however, on the Loess Plateau, precipitation rather than PET is still the dominant factor affecting the occurrence of drought (Wang et al., 2022b). Moreover, at the global scale, increases in both the duration and severity of drought can be attributed primarily to changes in precipitation patterns (Wang et al., 2022a). These studies have further deepened the understanding of the factors influencing the occurrence and development of drought, providing references for the formulation of drought-adaptation strategies.
The Xinjiang Uygur Autonomous Region (hereinafter referred to as Xinjiang), located in northwestern China, is a crucial area for the Silk Road Economic Belt and the China-Pakistan Economic Corridor. As a region highly susceptible to global climate change, the area affected by drought has expanded over the past few decades (Li et al., 2017; Yao et al., 2018; Zhang et al., 2019; An et al., 2020), and there has been extensive researches examining the spatiotemporal characteristics of drought in the region (Yao et al., 2018; An et al., 2020; Khan et al., 2021; Zhang et al., 2021; Zhang et al., 2023). These studies have provided important references for exploring drought patterns in Xinjiang. However, previous studies focused primarily on the spatiotemporal patterns of drought. Despite being the two most important factors influencing drought, the effects of temperature and precipitation have not been thoroughly studied in this region. Xinjiang, a typical arid area, is highly sensitive to climate change; against this backdrop, significant changes in temperature and precipitation have occurred there. Further research is needed to better understand how temperature and precipitation affect the drought characteristics in Xinjiang.
In this study, we explored the impacts of changes in temperature and precipitation on drought characteristics in Xinjiang. The main objectives of this study are: to analyze the variation trends in temperature, precipitation, and drought in Xinjiang from 1980 to 2020, and to quantify the influences of temperature and precipitation trends on drought in Xinjiang from 1980 to 2020. This study will help to deepen the understanding of the impacts of temperature and precipitation on drought in Xinjiang, providing a reference for the formulation of more targeted drought-adaptation strategies.

2 Materials and methods

2.1 Study area

Xinjiang (34°20′11″-49°10′55″N, 73°29′54″-96°23′03″E) is located in the midlatitude inland region of northwestern China. As shown in Figure 1, the Tianshan Mountains divide Xinjiang into two parts: southern Xinjiang and northern Xinjiang (Hu et al., 2021a). Due to its geographical location and topography, Xinjiang exhibits a typical temperate continental climate. It has an annual average temperature of approximately 9.72°C, and the precipitation concentrates in summer. The annual precipitation in northern Xinjiang generally varies between 150 and 200 mm, whereas in southern Xinjiang, it is less than 100 mm. Xinjiang is the core component of arid area in Central Asia, and drought is the main meteorological disaster in this region; droughts in the region tend to have long durations and severe impacts.

2.2 Data

The data used in this study included daily average temperature and daily precipitation data from 56 meteorological stations in Xinjiang (Fig. 1). The temperature and precipitation data were downloaded from the National Meteorological Science Data Center (https://data.cma.cn/); these data were subjected to quality control and inhomogeneity test. After quality control, we found that the proportion of missing values for most stations was less than 0.2%. We used data from adjacent dates of station to replace the missing values over periods of only 1-2 d, and replaced the remaining missing values by multiyear average from the same period (Kong et al., 2016). We calculated the monthly temperature and precipitation data on the basis of the daily data.
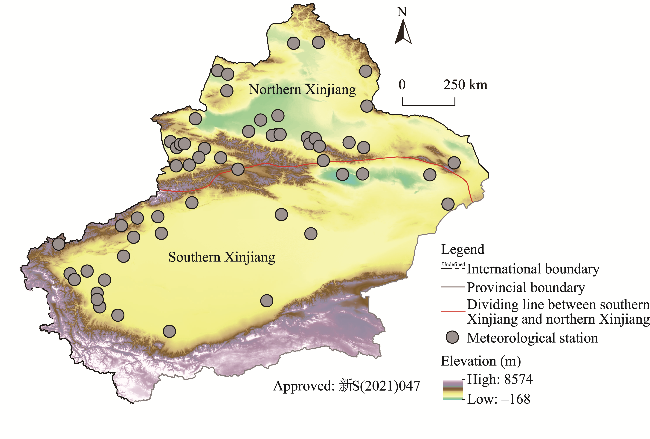
Fig. 1 Location of 56 meteorological stations adopted by this study in Xinjiang. Noted that the figure is based on the standard map (No. 新S(2021)047) of the Xinjiang Uygur Autonomous Region Platform for Common Geospatial Information Services (https://xinjiang.tianditu.gov.cn/main/bzdt.html) marked by the Department of Natural Resources of Xinjiang Uygur Autonomous Region, and the base map has not been modified.

2.3 Methods

2.3.1 SPEI calculation

The SPEI is a drought index based on the water balance between precipitation and PET (Vicente-Serrano et al., 2010); it considers the effects of temperature on the occurrence and development of drought. As such, the SPEI is more suitable for drought monitoring than the SPI against the background of global climate change (Chikabvumbwa et al., 2024). Moreover, the SPEI can be used to monitor drought over different time scales and has been widely applied in the assessment of the impacts of drought (Yang et al., 2020; Hamarash et al., 2022; Yao et al., 2022b; Zarei et al., 2023). The detailed methodology for the calculation of SPEI is as follows (Vicente-Serrano et al., 2010):
(1) Calculating PET
In this study, we adopted the Thornthwaite method to calculate PET, which has been widely used in similar studies due to its simple calculation progress and minimal data requirement (Yao et al., 2018; Zhang et al., 2021; Li et al., 2024).
$\mathrm{PET}_{i}=\left(\frac{2 u N}{45}\right)\left(\frac{10 T_{i}}{H}\right)\left(6.75 \times 10^{-7}\right) H^{3}-\left(7.71 \times 10^{-5}\right) H^{2}+\left(1.79 \times 10^{-2}\right) H+0.49$
$H=\left(\frac{T_{i}}{5}\right)^{1.514},$
where PETi is the PET in month i (mm); u is the monthly average daily sunshine hours in month i (h); N is the number of days in month i; Ti is the average temperature in month i (°C); and H is the heat index.
(2) Calculating water deficit
$D_{i}=P_{i}-\mathrm{PET}_{i},$
where Pi is the precipitation in month i (mm); and Di is the water deficit in month i (mm).
(3) Calculating the cumulative water deficit at different time scales
The calculated values of Di were aggregated at different time scales. The difference of water deficit for a given month i of year j is dependent on the selected time scale k. For instance, the accumulated difference for a specific month in year j, using a 12-month-time scale, is calculated as follows:
$X_{i, j}^{k}=\sum_{l=13-k+i}^{12} D_{j-1, l}+\sum_{l=1}^{i} D_{j, l} \quad(\text { if } i<k),$
$X_{i, j}^{k}=\sum_{l=i-k+1}^{i} D_{j, l} \quad(\text { if } i \geq k),$
where $X_{i, j}^{k}$ is the cumulative water deficit in month i of year j at the selected timescale k (mm); Dj1,l is the value of precipitation minus PET in month l of year j–1 (mm); and Dj,l is the value of precipitation minus PET in month l of year j (mm).
(4) Fitting the probability distribution of the cumulative water deficit to obtain the SPEI
We used a log-logistic probability density function to calculate the probability density of the cumulative water deficit.
$f(x)=\frac{\beta}{\alpha}\left(\frac{x-\gamma}{\alpha}\right)^{\beta-1}\left[1+\left(\frac{x-\gamma}{\alpha}\right)^{\beta}\right]^{-2},$
where f(x) is the probability density function of cumulative water deficit; x is the cumulative water deficit (mm); and α, β, and γ are the scale, shape, and location parameters, respectively. The latter three parameters are calculated as follows:
$\alpha=\frac{\left(w_{0}-2 w_{1}\right) \beta}{\Gamma(1+1 / \beta) \Gamma(1-1 / \beta)},$
$\beta=\frac{2 w_{1}-w_{0}}{6 w_{1}-w_{0}-6 w_{2}},$
$\gamma=w_{0}-\alpha \Gamma(1+1 / \beta) \Gamma(1-1 / \beta),$
where $\Gamma$ is a gamma function; and w0, w1, and w2 are the probability-weighted moments calculated by the method of Sheng and Hashino (2007). The probability-weighted moments are calculated by Equation 10.
$w_{r}=\frac{1}{n}\binom{n-1}{r}^{-1} \sum_{m=1}^{n-r}\binom{n-m}{r} x_{m}(r=0,1 \text {, and } 2),$
where wr is the rth probability-weighted moment; n is the sample size; and xm is the vector of mth observation arranged in descending order.
Thus, the probability distribution function of the log-logistic distribution can be expressed as follows:
$F(x)=\left[1+\left(\frac{\alpha}{x-\gamma}\right)^{\beta}\right]^{-1},$
where F(x) is the probability distribution function of cumulative water deficit.
Then, the probability distribution function (F(x)) of the cumulative water deficit of each month is normalized by Equation 12.
$Y=1-F(x),$
where Y is the probability of a definite value.
If Y≤0.5:
$W=\sqrt{-2 \ln (Y)},$
$\mathrm{SPEI}=W-\frac{\mathrm{c}_{0}+\mathrm{c}_{1} W+\mathrm{c}_{2} W^{2}}{1+\mathrm{d}_{1} W+\mathrm{d}_{2} W^{2}+\mathrm{d}_{3} W^{3}} ;$
if Y>0.5:
$W=\sqrt{-2 \ln (1-Y)},$
$\text { SPEI }=-\left(W-\frac{\mathrm{c}_{0}+\mathrm{c}_{1} W+\mathrm{c}_{2} W^{2}}{1+\mathrm{d}_{1} W+\mathrm{d}_{2} W^{2}+\mathrm{d}_{3} W^{3}}\right),$
where W is the standardized normal variable that reflects the cumulative probability of water deficit; and c0, c1, c2, d1, d2, and d3 are constants used in the polynomial approximation to accurately convert cumulative probabilities to values on the standard normal distribution (c0=2.515517, c1=0.802853 c2=0.010328, d1=1.432788, d2=0.189269, and d3=0.001308). Table 1 shows the classifications of drought based on SPEI value.
Table 1 Drought classification based on the value of standardized precipitation evapotranspiration index (SPEI)
Value Classification
SPEI< -2.00 Extreme drought
-2.00≤SPEI< -1.50 Severe drought
-1.50≤SPEI< -1.00 Moderate drought
-1.00≤SPEI< -0.50 Slight drought
-0.50≤SPEI≤0.50 Normal
SPEI>0.50 Wet

2.3.2 Trend analysis method

We used the Theil-Sen median method to calculate linear trends in the precipitation, temperature, and SPEI, and tested the significance of each change trend via the Mann‒Kendall method. These are both nonparametric analysis methods; they are not affected by outliers and have been widely used in long-time-series change trend analysis research (Sharma and Goyal, 2020; Alsubih et al., 2021). The calculation processes of the Theil-Sen and Mann-Kendall methods are as follows:
$\text { sen }=\operatorname{median}\left[\frac{\left(X_{b}-X_{a}\right)}{b-a}\right] \quad(1<a<b<q),$
$\operatorname{sgn}\left(X_{b}-X_{a}\right)=\left\{\begin{array}{ll} 1 & \left(X_{b}-X_{a}>0\right) \\ 0 & \left(X_{b}-X_{a}=0\right), \\ -1 & \left(X_{b}-X_{a}<0\right) \end{array}\right.$
$S=\sum_{a=1}^{q-1} \sum_{b=a+1}^{q} \operatorname{sgn}\left(X_{b}-X_{a}\right),$
$\operatorname{Var}(S)=\frac{q(q-1)(2 q+5)}{18},$
$Z=\left\{\begin{array}{ll} \frac{S-1}{\sqrt{\operatorname{Var}(S)}} & (S>0) \\ 0 & (S=0), \\ \frac{S+1}{\sqrt{\operatorname{Var}(S)}} & (S<0) \end{array}\right.$
where sen is the change trend of indicator; Xa is the observed value of the indicator in year a; and Xb is the observed value of the indicator in year b; q is the length of time series; S is the test statistic; Z is the standardized test statistic; and Var(S) is the variance in S. The value of sen>0 indicates that indicator (i.e., temperature, precipitation, and SPEI in this study) increased during the study period, and the value of sen<0 indicates that indicator decreased during the study period. In this study, the sen value was multiplied by ten to represent the change of temperature, precipitation, or SPEI per ten years. If |Z|>Z(1-α/2), the temperature, precipitation, or SPEI trend is significance at α=0.05 (or 0.01) level.

2.3.3 Determining the contributions of temperature and precipitation

To determine the contributions of temperature and precipitation trends to drought trends, we employed a linear-detrending method to remove the trends in temperature and precipitation. This approach has been widely applied for detrending of meteorological data (Wu and Chen, 2019; Wang et al., 2022a). The SPEI was subsequently calculated under three distinct scenarios (Table 2). Under scenario 1, we calculated the SPEI on the basis of the observed temperature and precipitation (SPEIObs); under scenario 2, we calculated the SPEI on the basis of the detrended temperature and observed precipitation (SPEIDtOp); and under scenario 3, we calculated the SPEI on the basis of the observed temperature and detrended precipitation (SPEIOtDp).
Table 2 Scenario setting
Scenario SPEI Description
Obs SPEIObs SPEI is calculated on the basis of the observed temperature and observed precipitation
DtOp SPEIDtOp SPEI is calculated on the basis of the detrended temperature and observed precipitation
OtDp SPEIOtDp SPEI is calculated on the basis of the observed temperature and detrended precipitation

Note: Obs, observed temperature and precipitation; DtOp, detrended temperature and observed precipitation; OtDp, observed temperature and detrended precipitation. SPEIObs, the SPEI value of scenario Obs; SPEIDtOp, the SPEI value of scenario DtOp; and SPEIOtDp, the SPEI value of scenario OtDp.

After calculating the SPEI under different scenarios, referring to previous research (Sun et al., 2019; Chen, 2021), we determined the contributions of temperature and precipitation trends to drought trends in Xinjiang using Equations 22 and 23, respectively:
$C r_{-} \text {tas }=\text { Slope _ } \mathrm{SPEI}_{\text {Obs }}-\text { Slope }_{-} \mathrm{SPEI}_{\text {Dtop }} \text {, }$
$C r \_p r e=\mathrm{Slope}_{-} \mathrm{SPEI}_{\mathrm{Obs}}-\mathrm{Slope}_{-} \mathrm{SPEI}_{\mathrm{OtDp}},$
where Cr_tas and Cr_pre are the contributions of temperature and precipitation trends to drought trends, respectively; and Slope_SPEIObs, Slope_SPEIDtOp, and Slope_SPEIOtDp are the linear trends in SPEIObs, SPEIDtOp, and SPEIOtDp, respectively. The negative trend of SPEI value means drought trend, and the positive trend of SPEI value means wet trend. When Cr_tas or Cr_pre is negative, the temperature or precipitation trends intensify drought trends, representing a negative contribution. In contrast, when Cr_tas or Cr_pre is positive, the temperature or precipitation trends lead to wetting trends, representing a positive contribution. The larger the absolute value of the contribution, the greater the contribution.
To explore the dominant factors influencing drought trends, we divided the 56 meteorological stations in Xinjiang into 4 types by comparing the absolute values of Cr_tas and Cr_pre: (Ⅰ) stations with a temperature-dominated drought trend; (Ⅱ) stations with a temperature-dominated wetting trend; (Ⅲ) stations with a precipitation-dominated drought trend; and (Ⅳ) stations with a precipitation-dominated wetting trend. The specific division criteria are shown in Table 3.
Table 3 Division rule for the dominant factors of drought and wetting trends
Dominant type Abbreviation Cr_tas Cr_pre Absolute value comparison
T_drought <0 <0 |Cr_tas|>|Cr_pre|
<0 >0 |Cr_tas|>|Cr_pre|
T_wet >0 >0 |Cr_tas|>|Cr_pre|
>0 <0 |Cr_tas|>|Cr_pre|
P_drought >0 <0 |Cr_tas|<|Cr_pre|
<0 <0 |Cr_tas|<|Cr_pre|
P_wet >0 >0 |Cr_tas|<|Cr_pre|
<0 >0 |Cr_tas|<|Cr_pre|

Note: Cr_tas, contribution of temperature trend to drought trend; Cr_pre, contribution of precipitation trend to drought trend; T_drought, temperature-dominated drought trend; T_wet, temperature-dominated wetting trend; P_drought, precipitation-dominated drought trend; P_wet, precipitation-dominated wetting trend.

3 Results

3.1 Trends in temperature and precipitation

From 1980 to 2020, the temperature in Xinjiang exhibited a statistically significant increase at interannual and seasonal scales, except in winter (Fig. 2). In spring, the temperature trends were greater than those in the other three seasons, with the temperature upward trends exceeding 0.50°C/10a at most stations (Fig. 2a). In winter, the temperature trends at most stations did not exceed 0.20°C/10a and were nonsignificant. The winter temperature at some stations in northern Xinjiang exhibited nonsignificant decreasing trend (Fig. 2d). At most stations, the temperature in summer significantly increased, with a slightly greater increase in northern Xinjiang than in southern Xinjiang (Fig. 2b). In autumn, the temperature at most stations in southern Xinjiang exhibited significant increase, whereas the stations in northern Xinjiang mostly showed nonsignificant increase, below 0.30°C/10a (Fig. 2c). At the annual scale, the temperature at most stations in Xinjiang significantly increased, and these increases were greater than 0.30°C/10a (Fig. 2e).
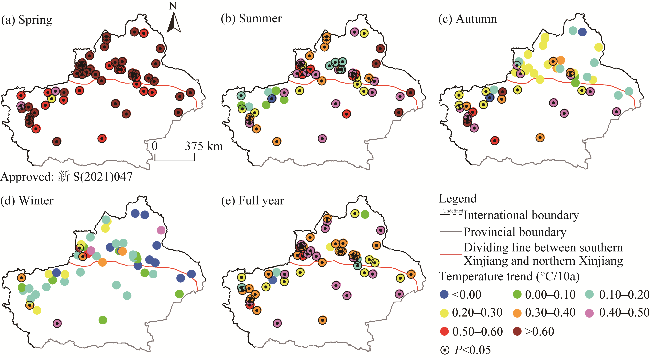
Fig. 2 Spatial distribution of temperature trends in Xinjiang at seasonal (a-d) and annual (e) scales from 1980 to 2020
A slight increase in precipitation was observed at most stations in Xinjiang from 1980 to 2020 (Fig. 3). In spring, the precipitation at most stations in northern Xinjiang slightly increased, whereas it exhibited a nonsignificant decreasing trend at most stations in southern Xinjiang (Fig. 3a). In summer, there was a nonsignificant increase in precipitation at most stations in both northern Xinjiang and southern Xinjiang, aside from for some stations in northern Xinjiang and the eastern area of southern Xinjiang (Fig. 3b). In autumn, the precipitation exhibited a nonsignificant increasing trend at most stations, although some stations in the northeast of southern Xinjiang showed a significant downward trend (Fig. 3c). In winter, there were significant increasing trends in precipitation at most stations in northern Xinjiang, while most stations in southern Xinjiang showed nonsignificant increasing trend in precipitation (Fig. 3d). At the annual scale, the precipitation at most stations exhibited nonsignificant increasing trend in Xinjiang as a whole, and the increases in precipitation in northern Xinjiang were slightly greater than those in southern Xinjiang (Fig. 3e).
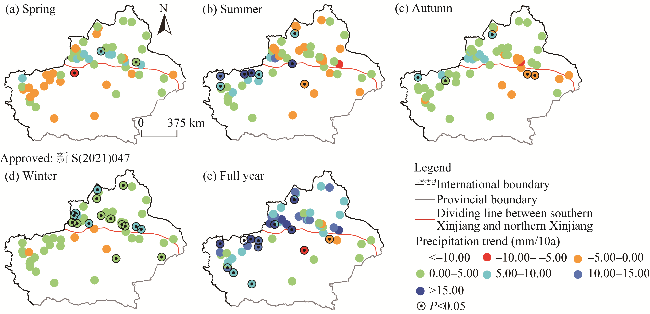
Fig. 3 Spatial distribution of precipitation trends in Xinjiang at seasonal (a-d) and annual (e) scales from 1980 to 2020
Figure 4 shows the change trends of temperature and precipitation of Xinjiang from 1980 to 2020 at interannual and seasonal scales. In general, at the annual scale, the trend in temperature was an increase of about 0.32°C/10a from 1980 to 2020 (Fig. 4m), and the temperature trends in northern Xinjiang and southern Xinjiang were similar (Fig. 4n and o). Regarding the different seasons, the spring temperature showed a greater increasing trend than those in the other three seasons, and the temperature increasing trend in winter was smaller than those in the other three seasons (Fig. 4a, d, g, and j). The temperature increases in northern Xinjiang were greater than those in southern Xinjiang in spring and summer (Fig. 4b, c, e, and f); in contrast, in autumn and winter, the temperature increases in northern Xinjiang were smaller than those in southern Xinjiang (Fig. 4h, i, k, and l).
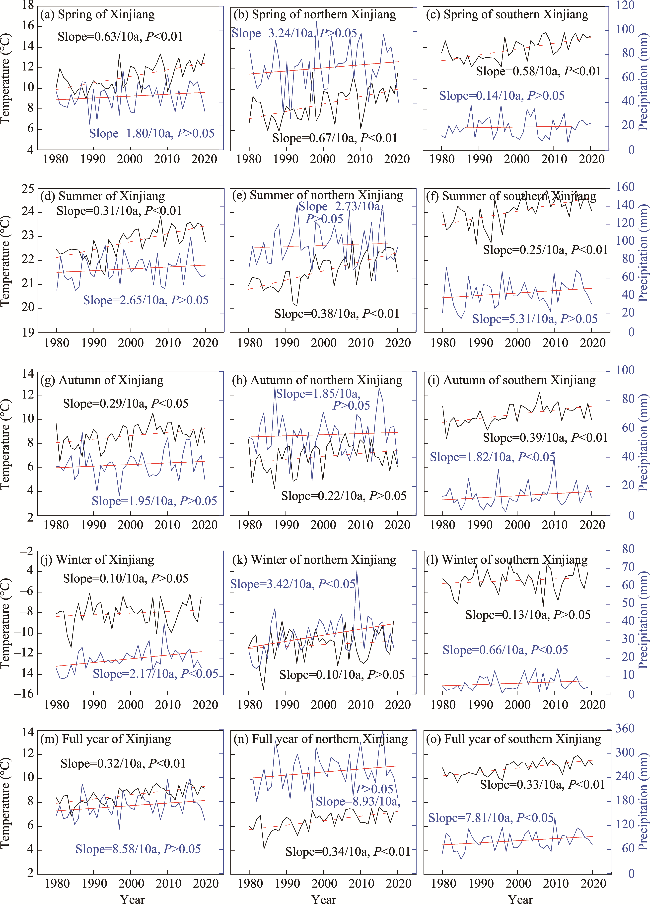
Fig. 4 Change trends of temperature and precipitation in Xinjiang (a, d, g, j, and m), northern Xinjiang (b, e, h, k, and n), and southern Xinjiang (c, f, i, l, and o) at seasonal and annual scales from 1980 to 2020
From 1980 to 2020, in general, the precipitation in Xinjiang showed a trend of increasing by 8.58 mm/10a at the annual scale (Fig. 4m). The increasing in annual precipitation in northern Xinjiang was slightly greater than that in southern Xinjiang (Fig. 4n and o). Regarding different seasons, the precipitation in winter increased significantly in the Xinjiang and its northern Xinjiang, with increasing trends of approximately 2.17 and 3.42 mm/10a, respectively (Fig. 4j and k). The increasing trends of precipitation in northern Xinjiang were greater than those in southern Xinjiang in all seasons except for summer (Fig. 4b, c, e, f, h, i, k, and l).

3.2 Drought trends in Xinjiang

From 1980 to 2020, at the annual scale, the drought conditions in Xinjiang intensified, with change in SPEI of approximately -0.21/10a (Table 4). There were differences in the drought trends between southern Xinjiang and northern Xinjiang; notably, the intensified drought trends in northern Xinjiang were not significant, but those in southern Xinjiang were significant. The levels of drought intensified in spring, summer, and autumn throughout Xinjiang, with SPEI trends of -0.26/10a, -0.20/10a, and -0.07/10a, respectively (Table 4). In spring and autumn, the increases in drought in southern Xinjiang were more obvious than those in northern Xinjiang. In contrast to drought trends in the other three seasons, the drought conditions eased in winter across all areas, with positive SPEI trends of 0.32/10a, 0.30/10a, and 0.15/10a, for the whole study area, northern Xinjiang, and southern Xinjiang, respectively, although the trend in southern Xinjiang was not significant (Table 4).
Table 4 Drought trends in Xinjiang at seasonal and annual scales from 1980 to 2020
Region SPEI trend (/10a)
Spring Summer Autumn Winter Full year
Xinjiang -0.26* -0.20 -0.07 0.32* -0.21
Northern Xinjiang -0.13 -0.20 -0.03 0.30* -0.14
Southern Xinjiang -0.38* -0.04 -0.20 0.15 -0.30*

Note: Positive value indicates an increasing trend, while negative value indicates a decreasing trend. *, significance at P<0.05 level.

There were variations in the drought trends among different stations in Xinjiang from 1980 to 2020. In spring, the stations in southern Xinjiang mainly exhibited significant drought trends, but the stations in northern Xinjiang mainly exhibited nonsignificant drought trends (Fig. 5a). In summer, most stations exhibited significant drought trends, whereas some stations in the northwestern part of southern Xinjiang exhibited nonsignificant wetting trends (Fig. 5b). In autumn, most stations in southern Xinjiang exhibited significant drought trends; however, the stations in northern Xinjiang mainly exhibited nonsignificant drought trends, and some stations in the southwestern part of northern Xinjiang exhibited nonsignificant wetting trends (Fig. 5c). In winter, most stations in northern Xinjiang exhibited significant wetting trends, while most stations in southern Xinjiang exhibited nonsignificant wetting trends (Fig. 5d). At the annual scale, the stations in southern Xinjiang mostly exhibited significant drought trends, whereas most stations in northern Xinjiang exhibited nonsignificant drought trends (Fig. 5e).
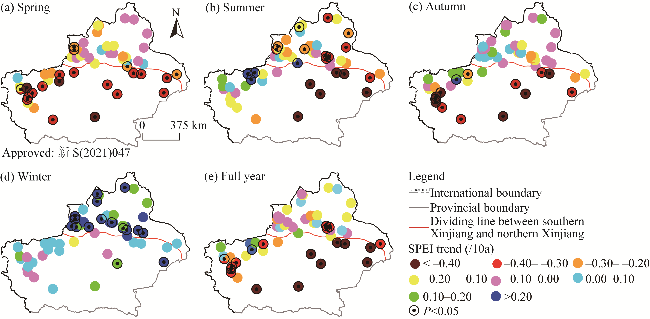
Fig. 5 Spatial distribution of drought trends in Xinjiang at seasonal (a-d) and annual (d) scales at from 1980 to 2020

3.3 Effects of temperature and precipitation trends on drought trends

We calculated the trends in SPEIObs, SPEIDtOp, and SPEIOtDp to analyze the impacts of temperature and precipitation trends on drought trends in Xinjiang. Compared with SPEIObs, SPEIDtOp demonstrated wetting trends at the different seasonal and annual scales in the whole study area, northern Xinjiang, and southern Xinjiang. Moreover, the wetting trends in winter throughout the whole study area and northern Xinjiang were significant (Table 5). This indicated that increasing temperature trends intensified drought conditions in Xinjiang. Conversely, according to SPEIOtDp, the drought trends in the whole study area, northern Xinjiang, and southern Xinjiang intensified at spring, summer, autumn, and annual scales, and the wetting trends in winter were likely to weaken, indicating that the precipitation trends could mitigate drought trends (Table 5).
Table 5 Drought trends in Xinjiang at seasonal and annual scales from 1980 to 2020 under different scenarios
Scenario Region SPEI trend (/10a)
Spring Summer Autumn Winter Full year
Obs Xinjiang −0.26* −0.20 −0.07 0.32* −0.21
Northern Xinjiang −0.13 −0.20 −0.03 0.30* −0.14
Southern Xinjiang −0.38* −0.04 −0.20 0.15 −0.30*
DtOp Xinjiang 0.12 0.16 0.14 0.32* 0.25
Northern Xinjiang 0.16 0.09 0.08 0.30* 0.15
Southern Xinjiang 0.02 0.24 0.19 0.16 0.17
OtDp Xinjiang −0.30* −0.32* −0.17 0.02 −0.28*
Northern Xinjiang −0.19 −0.26 −0.06 0.03 −0.25
Southern Xinjiang −0.39* −0.20 −0.39* 0.01 −0.43*

Note: Positive value indicates an increasing trend, while negative value indicates a decreasing trend. *, significance at P<0.05 level.

Figure 6 shows the SPEI trends at the 56 meteorological stations under the three simulating scenarios. Compared with the SPEI trends under the Obs scenario (Fig. 6a, d, g, j, and m), most stations in Xinjiang exhibited wetting trends under the DtOp scenario (Fig. 6b, e, h, k, and n),which indicated that temperature trends intensified drought at different stations. When temperature trends were removed and precipitation trends were retained, most stations in northern Xinjiang exhibited wetting trends, and approximately half of the stations in southern Xinjiang exhibited wetting trends in spring (Fig. 6b); for summer, most stations in the eastern part of Xinjiang showed nonsignificant drought trends, and the stations in the western part of Xinjiang mainly showed wetting trends (Fig. 6e); at autumn and annual scales, most stations in Xinjiang exhibited nonsignificant wetting trends (Fig. 6h and n); for winter, the stations in the southwestern part of southern Xinjiang changed from nonsignificant drought trends to nonsignificant wetting trends (Fig. 6j and k).
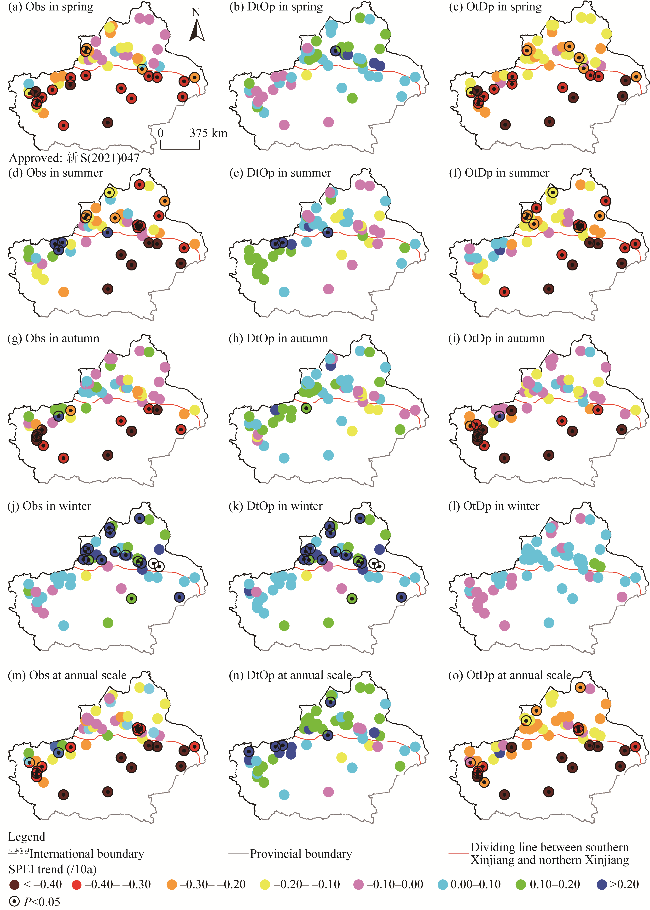
Fig. 6 Spatial distribution of drought trends in Xinjiang from 1980 to 2020 under the Obs (a, d, g, j, and m), DtOp (b, e, h, k, and n), and OtDp (c, f, i, l, and o) scenarios. Obs, observed temperature and precipitation; DtOp, detrended temperature and observed precipitation; OtDp, observed temperature and detrended precipitation.
Compared with the SPEI trends under the Obs scenario (Fig. 6a, d, g, j, and m), most stations in Xinjiang exhibited more severe drought trends under the OtDp scenario (Fig. 6c, f, i, l, and o), which indicated that precipitation trends mitigated drought trends at different stations. When precipitation trends were removed and temperature trends were retained, the number of stations with significant drought trends in northern Xinjiang increased, and the drought trend at each station in southern Xinjiang was also exacerbated in spring (Fig. 6c); this phenomenon was also observed in summer (Fig. 6f) and at the annual scale (Fig. 6o); for autumn, more stations in northern Xinjiang exhibited drought trends (Fig. 6i); for winter, most stations in northern Xinjiang changed from significant wetting trends to nonsignificant wetting trends, while the number of stations exhibiting nonsignificant drought trends in southern Xinjiang increased (Fig. 6k and l).

3.4 Contributions of temperature and precipitation trends to drought trends

Figure 7 shows the contributions of temperature and precipitation trends to drought trends in Xinjiang. Generally, the temperature trends at most stations in Xinjiang negatively contributed to drought trends, exacerbating drought conditions (Fig. 7a, d, g, j, and m). From 1980 to 2020, the contributions of temperature trends to drought trends at most stations were less than -0.10/10a except for those in winter and those in northern Xinjiang in autumn. The contributions of temperature trends to drought trends varied between -0.10/10a and 0.00/10a at most stations in winter (Fig. 7j). The same phenomenon was also observed in northern Xinjiang in autumn (Fig. 7g). There were differences in how temperature affected drought trends in southern Xinjiang and northern Xinjiang. At spring, autumn, and annual scales, the contributions of temperature trends to drought trends in southern Xinjiang were less than -0.30/10a, whereas the contributions to drought trends in northern Xinjiang mostly varied between -0.30/10a and -0.10/10a (Fig. 7c, i, and o). This indicated that the intensification effect of temperature trends on drought trends in southern Xinjiang was greater than that in northern Xinjiang. In summer, the negative contributions of temperature trends to drought trends were similar in northern Xinjiang and southern Xinjiang, at approximately -0.31/10a (Fig. 7f); however, the contributions of temperature trends to drought trends in northern Xinjiang and southern Xinjiang were relatively small in winter, ranging from -0.10/10a to 0.00/10a (Fig. 7l).
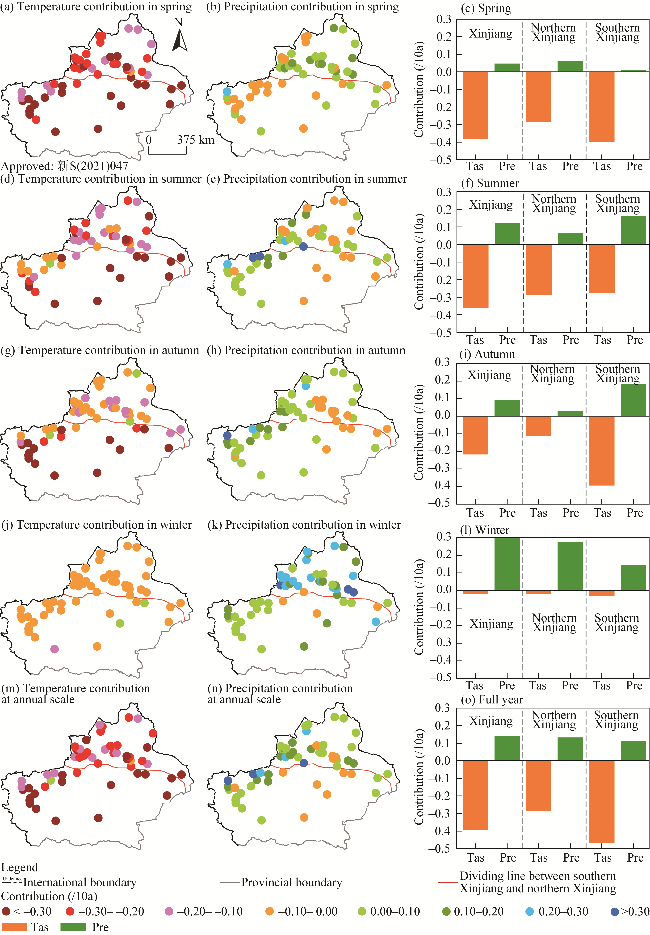
Fig. 7 Contribution of temperature and precipitation trends to drought trends at seasonal (a, b, c, d, e, f, h, i, j, k, and l) and annual (m, n, and o) scales in Xinjiang from 1980 to 2020. Tas, temperature; Pre, precipitation.
In general, at most stations in Xinjiang, precipitation trends contributed positively to drought trends, alleviating drought conditions (Fig. 7b, e, h, k, and n). In spring, the contributions of precipitation trends at most stations in northern Xinjiang ranged from 0.00/10a to 0.10/10a, alleviating the spring drought trends, although the contributions of precipitation trends at most stations in southern Xinjiang varied between -0.10/10a and 0.00/10a, tending to exacerbate the spring drought trends (Fig. 7b). In summer and autumn, the positive contributions of precipitation trends in southern Xinjiang were greater than those in northern Xinjiang (Fig. 7f and i). The contributions of summer precipitation trends at most stations in the western part of southern Xinjiang ranged from 0.00/10a to 0.20/10a, whereas those in the eastern part of southern Xinjiang ranged from -0.10/10a to 0.00/10a (Fig. 7e). In autumn, the positive contributions ranged from 0.00/10a to 0.20/10a at most stations, except for some in the southeastern part of northern Xinjiang and the northeastern part of southern Xinjiang (Fig. 7h). In winter and at the annual scale, the positive contributions of precipitation trends in northern Xinjiang were greater than those in southern Xinjiang (Fig. 7k and l). The positive contributions of winter precipitation at most stations in northern Xinjiang ranged from 0.10 to 0.30/10a, whereas those in southern Xinjiang mostly ranged from 0.00/10a to 0.10/10a (Fig. 7k). At the annual scale, the positive contributions of the annual precipitation trends at most stations in Xinjiang ranged from 0.00/10a to 0.20/10a, whereas negative contributions were found in the eastern part of southern Xinjiang (Fig. 7n).
By comparing the contributions of temperature and precipitation trends to drought trends from 1980 to 2020, we classified the meteorological stations into four categories: stations with temperature-dominated drought trend, precipitation-dominated drought trend, precipitation-dominated wetting trend, and temperature-dominated wetting trend (Fig. 8). Most meteorological stations in Xinjiang exhibited temperature-dominated drought trend in spring, whereas only few stations exhibited precipitation-dominated wetting trend (Fig. 8a). At summer, autumn, and annual scales, only some stations in the northwest of southern Xinjiang and west of northern Xinjiang demonstrated precipitation-dominated wetting trend, while the other stations demonstrated temperature-dominated drought trend (Fig. 8b, c, and e). In contrast with those during the other three seasons, most stations demonstrated precipitation-dominated wetting trend in winter, and only a few stations in the southwestern part of southern Xinjiang demonstrated temperature-dominated drought trend and temperature-dominated wetting trend (Fig. 8d).
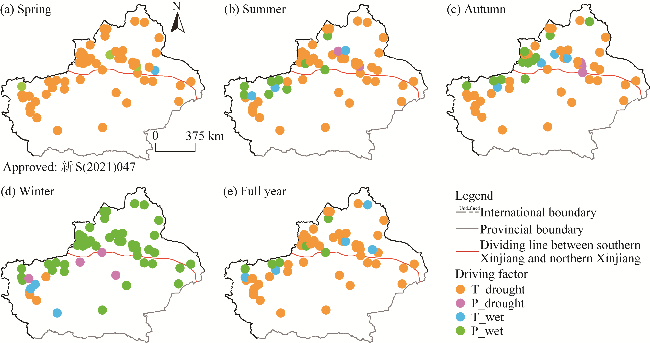
Fig. 8 Spatial distribution of dominant factors influencing the drought and wetting trends in Xinjiang at seasonal (a-d) and annual (e) scales from 1980 to 2020. T_drought, temperature-dominated drought trend; P_drought, precipitation-dominated drought trend; P_wet, precipitation-dominated wetting trend; T_wet, temperature-dominated wetting trend.

4 Discussion

Xinjiang is a region that is particularly sensitive to climate change, and some studies have explored the spatiotemporal characteristics of drought in this region (Yao et al., 2018, 2021; An et al., 2020; Cheng and Yin, 2021; Khan et al., 2021; Zhang et al., 2021). Although these studies used different drought indices, such as SPEI, PDSI, and SPI, all of them found intensified drought trends in Xinjiang at spring, summer, autumn, and annual scales and a wetting trend in winter, consistent with the findings of this study. Some studies have also explored the periodic characteristics of drought in Xinjiang. For example, Zhang et al. (2021) identified that the first main cycle of SPEI in northern Xinjiang is 11 a at spring, autumn, and winter scales. They also identified that in summer, the first main cycle is 28 a, and at the annual scale, the first main cycle of SPEI is 25 or 26 a. Zhang et al. (2023) also found that the first main cycle of the arid index in Xinjiang is 21 a. These studies provided valuable insights into the characteristics of drought cycles in Xinjiang and provided references for understanding the spatiotemporal patterns of drought. Nonetheless, few studies have paid attention to the factors influencing drought in this region, especially temperature and precipitation two critical factors that have altered significantly under global climate change background.
Distinct from previous studies, we explored the impacts of temperature and precipitation trends on drought trends in this region against the background of global climate change. We found that from 1980 to 2020, temperature trends have further exacerbated drought trends in Xinjiang, while precipitation trends have mainly mitigated drought trends. It was notable that the intensification of drought trends resulting from increasing temperature in southern Xinjiang was greater than that in northern Xinjiang. The alleviating effect of precipitation trends on drought trends in northern Xinjiang was greater than that in southern Xinjiang at spring, winter, and annual scales, while in summer and autumn, it was greater in southern Xinjiang. By comparing the contributions of temperature and precipitation trends to drought trends, we classified the meteorological stations into four categories and found that, aside from a few in western Tianshan Mountains, most stations in Xinjiang had temperature-dominated drought trend at spring, summer, autumn, and annual scales; however, in winter, most stations were classified as having precipitation-dominated wetting trend. These new findings further highlighted the critical role of temperature variations in determining drought dynamics in this region and underscored the need for an enhanced focus on the influences of temperature within drought management strategies.
Aside from in winter, temperature trends were the primary driver of the observed drought trends in Xinjiang. Against the background of global climate change, significant warming trends have been observed at spring, summer, autumn, and annual scales in Xinjiang; although precipitation also increased, this increase was not significant (Table 6). These findings may explain the dominance of temperature trends in driving drought trends in Xinjiang at spring, summer, autumn, and annual scales. There was a significant wetting trend in winter in Xinjiang, corresponding to a significant increasing trend in precipitation and a nonsignificant increasing trend in temperature in winter; similar phenomena were found in both southern Xinjiang and northern Xinjiang.
Table 6 Temperature and precipitation trends in Xinjiang from 1980 to 2020
Region Temperature trend (°C/10a) Precipitation trend (mm/10a)
Spring Summer Autumn Winter Full year Spring Summer Autumn Winter Full year
Xinjiang 0.63** 0.31** 0.29* 0.10 0.32** 1.80 2.65 1.95 2.17* 8.58
Northern Xinjiang 0.67** 0.38** 0.22 0.10 0.34** 3.24 2.73 1.85 3.42* 8.93
Southern Xinjiang 0.58** 0.25** 0.39** 0.13 0.33** 0.14 5.31 1.82* 0.66 7.81*

Note: Positive value indicates an increasing trend, while negative value indicates a decreasing trend. *, significance at P<0.05 level; **, significance at P<0.01 level.

There is a close relationship between atmospheric circulation anomalies and regional changes in climate change. A significant warming trend has been found in Xinjiang from 1980 to 2020, along with increase in precipitation. Yao et al. (2022a) found that the atmospheric circulation at mid-high latitudes of the Northern Hemisphere significantly impacts climate change in Xinjiang. The changes in the area and intensity of the Asian polar vortex are closely related to the temperature variation in Xinjiang. Yao et al. (2014) and Zhou et al. (2023) indicated that since 1980, the area and intensity of the Asian polar vortex decreased, and this may explain the trend of increasing temperature in Xinjiang. Xinjiang is located in a climate zone dominated by westerlies, in which precipitation is influenced by mid-latitude atmospheric circulation and the latitudinal wave propagation associated with the Atlantic Multidecadal Oscillation (Huang et al., 2015; Chen et al., 2019). Some studies indicated that changes in westerly circulation factors can greatly influence precipitation change in Xinjiang (Chen et al., 2011; Huang et al., 2017). The northern Xinjiang and western Tianshan Mountains are significantly affected by westerlies, leading to greater precipitation. This may explain why the trends toward increasing in precipitation were generally greater in northern Xinjiang than in southern Xinjiang. Mountain ranges and plateaus can influence moisture transport, and this in turn affects drought characteristics in Xinjiang. Overall, we found a trend of intensifying drought in Xinjiang from 1980 to 2020, and this has been more severe in southern Xinjiang than in northern Xinjiang. The southern Xinjiang is surrounded by mountains on three sides; the tectonic uplift of the Pamirs, Tianshan Mountains, and Kunlun Mountains, along with their mechanical diversion of westerly wind, has contributed to the more severe drought conditions in southern Xinjiang than in northern Xinjiang (Wang et al., 2020).
This study has some limitations and uncertainties. First, we used the Thornthwaite method to calculate PET and then determined the SPEI, while it has been found that the SPEI, which is based on the Thornthwaite method, may cause overestimation of drought trends (Guo et al., 2021). Second, the uneven distribution of meteorological stations in the study area may increase the uncertainties of the study (Shen et al., 2014, 2018; Wang et al., 2016a). Third, only precipitation and average temperature were considered in the Thornthwaite method; however, other factors, such as wind speed, humidity, and solar radiation, also influence drought trends (Wang et al., 2022a; Guo et al., 2023). Hence, it is necessary to analyze the impacts of these factors on drought trends in future studies.

5 Conclusions

In this study, we systematically analyzed the trends in temperature, precipitation, and drought in Xinjiang from 1980 to 2020. Moreover, we analyzed the influences of temperature and precipitation trends on drought trends using a scenario-simulation method. It was found that both temperature and precipitation exhibited increasing trends in Xinjiang from 1980 to 2020. In spring and summer, the increases in temperature in northern Xinjiang exceeded those observed in southern Xinjiang; conversely, in autumn and winter, the warming trends in northern Xinjiang were less than those in southern Xinjiang. Additionally, trends toward greater increase in precipitation were found in northern Xinjiang than in southern Xinjiang across all seasons except for summer. Trends of drought intensification were observed in Xinjiang at spring, summer, autumn, and annual scales; notably, the drought trends in northern Xinjiang were nonsignificant, whereas they were significant in southern Xinjiang. Conversely, wetting trends were found in winter, with significant wetting trends in northern Xinjiang and nonsignificant wetting trends in southern Xinjiang. It was found that temperature negatively contributed to the drought trends at most stations, indicating that increasing temperature exacerbated drought. In northern Xinjiang, the adverse effects of increasing temperature on drought trends were less pronounced than those in southern Xinjiang, conversely, the precipitation mainly contributed positively to drought, indicating that precipitation alleviated drought trends. The alleviating effects of precipitation on drought trends were slightly greater in northern Xinjiang than in southern Xinjiang. Generally, most stations in Xinjiang were classified as having temperature-dominated drought trend at spring, summer, autumn, and annual scales; however, in winter, most stations were classified as having precipitation-dominated wetting trend. This study deepens the understanding of the influences of temperature and precipitation on drought in Xinjiang, and the results highlight the critical role of temperature in determining the drought dynamics in this region. This could provide a reference for the formulation of more targeted drought-adaptation strategies.

Conflict of interest

The authors declare that they have no known competing financial interests or personal relationships that could have appeared to influence the work reported in this paper.

Acknowledgements

This work has been supported by the Third Xinjiang Scientific Expedition Program (2022xjkk0600).

Author contributions

Conceptualization: YANG Jianhua; Methodology: YANG Jianhua, LI Yaqian; Formal analysis: ZHOU Lei, ZHANG Zhenqing, WU Jianjun; Writing - original draft preparation: YANG Jianhua, ZHOU Hongkui; Writing - review and editing: YANG Jianhua, ZHOU Hongkui; Funding acquisition: WU Jianjun. All authors approved the manuscript.
[1]
Alsubih M, Mallick J, Talukdar S, et al. 2021. An investigation of the short-term meteorological drought variability over Asir Region of Saudi Arabia. Theoretical and Applied Climatology, 145: 597-617.

[2]
An Q, He H X, Gao J J, et al. 2020. Analysis of temporal-spatial variation characteristics of drought: a case study from Xinjiang, China. Water, 12(3): 741, doi: 10.3390/w12030741.

[3]
Bachmair S, Stahl K, Collins K, et al. 2016. Drought indicators revisited: the need for a wider consideration of environment and society. Wiley Interdisciplinary Reviews-Water, 3(4): 516-536.

[4]
Bai M, Li Z L, Huo P Y, et al. 2023. Propagation characteristics from meteorological drought to agricultural drought over the Heihe River Basin, Northwest China. Journal of Arid Land, 15(5): 523-544.

[5]
Chen F H, Huang W, Jin L Y, et al. 2011. Spatiotemporal precipitation variations in the arid Central Asia in the context of global warming. Science China Earth Sciences, 54(12): 1812-1821.

[6]
Chen F H, Chen J H, Huang W, et al. 2019. Westerlies Asia and monsoonal Asia: Spatiotemporal differences in climate change and possible mechanisms on decadal to sub-orbital timescales. Earth-Science Reviews, 192: 337-354.

[7]
Chen H X, Wang Q F, Bento V A, et al. 2023. Vegetation drought risk assessment based on the multi-weight methods in Northwest China. Environmental Monitoring and Assessment, 195(10): 1148, doi: 10.1007/s10661-023-11747-z.

[8]
Chen L Q. 2021. The spatiotemporal changes and impacts of drought in China based on CMIP6 multiple models. MSc Thesis. Nanjing: Nanjing University of Information Science & Technology. (in Chinese)

[9]
Cheng J Q, Yin S Y. 2021. Analysis of drought characteristics and its effects on crop yield in Xinjiang in recent 60 years. Sustainability, 13(24): 13833, doi: 10.3390/su132413833.

[10]
Chikabvumbwa S R, Salehnia N, Gholami A, et al. 2024. Characterization of hydro-meteorological droughts based on dynamic future scenarios and effective rainfall over Central Malawi. Theoretical and Applied Climatology, 155(3): 1959-1975.

[11]
Dai A G. 2013. Increasing drought under global warming in observations and models. Nature Climate Change, 3(2): 52-58.

[12]
Ding Y B, Xu J T, Wang X W, et al. 2020. Spatial and temporal effects of drought on Chinese vegetation under different coverage levels. Science of the Total Environment, 716: 137166, doi: 10.1016/j.scitotenv.2020.137166.

[13]
Easterling D R, Wallis T W R, Lawrimore J H, et al. 2007. Effects of temperature and precipitation trends on U.S. drought. Geophysical Research Letters, 34(20): L20709, doi: 10.1029/2007GL031541.

[14]
Fleming-Munoz D A, Whitten S, Bonnett G D. 2023. The economics of drought: A review of impacts and costs. Australian Journal of Agricultural and Resource Economics, 67(4): 501-503.

[15]
Guo M Y, She D X, Zhang L P, et al. 2021. Attribution of trends in meteorological drought during 1960-2016 over the Loess Plateau, China. Journal of Geographical Sciences, 31(8): 1123-1139.

[16]
Guo W W, Huang S Z, Zhao Y, et al. 2023. Quantifying the effects of nonlinear trends of meteorological factors on drought dynamics. Natural Hazards, 117(3): 2505-2526.

[17]
Hamarash H, Hamad R, Rasul A. 2022. Meteorological drought in semi-arid regions: A case study of Iran. Journal of Arid Land, 14(11): 1212-1233.

[18]
Han J, Singh V P. 2023. A review of widely used drought indices and the challenges of drought assessment under climate change. Environmental Monitoring and Assessment, 195(12): 1438, doi: 10.1007/s10661-023-12062-3.

[19]
Han W Q, Guan J Y, Zheng J H, et al. 2023. Probabilistic assessment of drought stress vulnerability in grasslands of Xinjiang, China. Frontiers in Plant Science, 14: 1143863, doi: 10.3389/fpls.2023.1143863.

[20]
He Y, Ye J Y, Yang X Y. 2015. Analysis of the spatio-temporal patterns of dry and wet conditions in the Huai River Basin using the standardized precipitation index. Atmospheric Research, 166: 120-128.

[21]
Hu Q, Zhao Y, Huang A, et al. 2021a. Moisture transport and sources of the extreme precipitation over northern and southern Xinjiang in the summer half-year during 1979-2018. Frontiers in Earth Science, 9: 770877, doi: 10.3389/feart.2021.770877.

[22]
Hu Z H, Wu Z R, Zhang Y X, et al. 2021b. Risk assessment of drought disaster in summer maize cultivated areas of the Huang-Huai-Hai plain, eastern China. Environmental Monitoring and Assessment, 193(7): 441, doi: 10.1007/s10661-021-09224-6.

[23]
Huang W, Chen J H, Zhang X J, et al. 2015. Definition of the core zone of the "westerlies-dominated climatic regime", and its controlling factors during the instrumental period. Science China Earth Sciences, 58: 676-684.

[24]
Huang W, Chang S Q, Xie C L, et al. 2017. Moisture sources of extreme summer precipitation events in North Xinjiang and their relationship with atmospheric circulation. Advances in Climate Change Research, 8(1): 12-17.

[25]
Khan A A, Zhao Y J, Khan J, et al. 2021. Spatial and temporal analysis of rainfall and drought condition in Southwest Xinjiang in Northwest China, using various climate indices. Earth Systems and Environment, 5(2): 201-216.

[26]
Kim W, Park E, Jo H W, et al. 2023. A meta-analytic review on the spatial and climatic distribution of meteorological drought indices. Environmental Reviews, 31(1): 95-110.

[27]
Kong D D, Zhang Q, Gu X H, et al. 2016. Vegetation responses to drought at different time scales in China. Acta Ecologica Sinica, 36(24): 7908-7918. (in Chinese)

[28]
Leng X X, Liu X G, Gao Y L, et al. 2020. Drought assessment of southwestern China based on HadGEM2-ES model under representative concentration pathway 4.5 scenario. Natural Hazards, 102(1): 307-334.

[29]
Li H W, Li Y P, Huang G H, et al. 2021. Probabilistic assessment of crop yield loss to drought time-scales in Xinjiang, China. International Journal of Climatology, 41(8): 4077-4094.

[30]
Li L C, She D X, Zheng H, et al. 2020. Elucidating diverse drought characteristics from two meteorological drought indices (SPI and SPEI) in China. Journal of Hydrometeorology, 21(7): 1513-1530.

[31]
Li Q, Liu Y, Luo L Y, et al. 2024. Spatiotemporal drought characteristics during growing seasons of the winter wheat and summer maize in the North China Plain. Frontiers in Earth Science, 11: 1358987, doi: 10.3389/feart.2023.1358987.

[32]
Li Y, Chen C Y, Sun C F. 2017. Drought severity and change in Xinjiang, China, over 1961-2013. Hydrology Research, 48(5): 1343-1362.

[33]
Naumann G, Alfieri L, Wyser K, et al. 2018. Global changes in drought conditions under different levels of warming. Geophysical Research Letters, 45(7): 3285-3296.

[34]
Raposo V D M B, Costa V A F, Rodrigues A F. 2023. A review of recent developments on drought characterization, propagation, and influential factors. Science of the Total Environment, 898: 165550, doi: 10.1016/j.scitotenv.2023.165550.

[35]
Sharma A, Goyal M K. 2020. Assessment of drought trend and variability in India using wavelet transform. Hydrological Sciences Journal, 65(9): 1539-1554.

[36]
Shen X J, Liu B H, Li G D, et al. 2014. Spatiotemporal change of diurnal temperature range and its relationship with sunshine duration and precipitation in China. Journal of Geophysical Research: Atmospheres, 119(23): 13163-13179.

[37]
Shen X J, Liu B H, Lu X G. 2018. Weak cooling of cold extremes versus continued warming of hot extremes in China during the recent global surface warming hiatus. Journal of Geophysical Research-Atmospheres, 123(8): 4073-4087.

[38]
Sheng Y, Hashino M. 2007. Probability distribution of annual, seasonal and monthly precipitation in Japan. Hydrological Sciences Journal, 52(5): 863-877.

[39]
Sun S L, Li Q Q, Li J J, et al. 2019. Revisiting the evolution of the 2009-2011 meteorological drought over Southwest China. Journal of Hydrology, 568: 385-402.

[40]
Vicente-Serrano S M, Begueria S, Lopez-Moreno J I. 2010. A multiscalar drought index sensitive to global warming: the standardized precipitation evapotranspiration index. Journal of Climate, 23(7): 1696-1718.

[41]
Wahl E R, Zorita E, Diaz H F, et al. 2022. Southwestern United States drought of the 21st century presages drier conditions into the future. Communications Earth & Environment, 3(1): 202, doi: 10.1038/s43247-022-00532-4.

[42]
Wang R, Chen J Y, Chen X W, et al. 2017. Variability of precipitation extremes and dryness/wetness over the southeast coastal region of China, 1960-2014. International Journal of Climatology, 37(13): 4656-4669.

[43]
Wang R, Li L H, Chen L J, et al. 2022a. Respective contributions of precipitation and potential evapotranspiration to long-term changes in global drought duration and intensity. International Journal of Climatology, 42(16): 10126-10137.

[44]
Wang W, Lu H, Yang D W, et al. 2016a. Modelling hydrologic processes in the Mekong River Basin using a distributed model driven by satellite precipitation and rain gauge observations. PLoS ONE, 11(3): e0152229, doi: 10.1371/journal.pone.0152229.

[45]
Wang X, Carrapa B, Sun Y C, et al. 2020. The role of the westerlies and orography in Asian hydroclimate since the late Oligocene. Geology, 48(7): 728-732.

[46]
Wang Y F, Xu Y P, Lei C G, et al. 2016b. Spatio-temporal characteristics of precipitation and dryness/wetness in Yangtze River Delta, eastern China, during 1960-2012. Atmospheric Research, 172-173: 196-205.

[47]
Wang Y P, Wang S, Zhao W W, et al. 2022b. The increasing contribution of potential evapotranspiration to severe droughts in the Yellow River basin. Journal of Hydrology, 605: 127310, doi: 10.1016/j.jhydrol.2021.127310.

[48]
Wu J F, Chen X H. 2019. Spatiotemporal trends of dryness/wetness duration and severity: The respective contribution of precipitation and temperature. Atmospheric Research, 216: 176-185.

[49]
Yang J H, Wu J J, Liu L Z, et al. 2020. Responses of winter wheat yield to drought in the North China Plain: Spatial-temporal patterns and climatic drivers. Water, 12(11): 3094, doi: 10.3390/w12113094.

[50]
Yao J Q, Liu Z H, Yang Q, et al. 2014. Temperature variability and its possible causes in the typical basins of the arid Central Asia in recent 130 years. Acta Geographica Sinica, 69(3): 291-302. (in Chinese)

[51]
Yao J Q, Zhao Y, Chen Y N, et al. 2018. Multi-scale assessments of droughts: A case study in Xinjiang, China. Science of the Total Environment, 630: 444-452.

[52]
Yao J Q, Mao W Y, Chen J, et al. 2021. Recent signal and impact of wet-to-dry climatic shift in Xinjiang, China. Journal of Geographical Sciences, 31(9): 1283-1298.

[53]
Yao J Q, Chen Y N, Guan X F, et al. 2022a. Recent climate and hydrological changes in a mountain-basin system in Xinjiang, China. Earth-Science Reviews, 226: 103957, doi: 10.1016/j.earscirev.2022.103957.

[54]
Yao N, Li Y, Liu Q Z, et al. 2022b. Response of wheat and maize growth-yields to meteorological and agricultural droughts based on standardized precipitation evapotranspiration indexes and soil moisture deficit indexes. Agricultural Water Management, 266: 107566, doi: 10.1016/j.agwat.2022.107566.

[55]
Zarei A R, Mahmoudi M R, Moghimi M M. 2023. Determining the most appropriate drought index using the random forest algorithm with an emphasis on agricultural drought. Natural Hazards, 115(1): 923-946.

[56]
Zhang H W, Song J, Wang G, et al. 2021. Spatiotemporal characteristic and forecast of drought in northern Xinjiang, China. Ecological Indicators, 127: 107712, doi: 10.1016/j.ecolind.2021.107712.

[57]
Zhang J M, Wu R G, Jia X J, et al. 2022. Contribution of precipitation and temperature to multiscale drought variations over Asia: Dependence on the time scale. International Journal of Climatology, 42(16): 8804-8821.

[58]
Zhang Y H, Xie P, Pu X, et al. 2019. Spatial and temporal variability of drought and precipitation using cluster analysis in Xinjiang, Northwest China. Asia-Pacific Journal of Atmospheric Sciences, 55(2): 155-164.

[59]
Zhang Y L, Long A H, T B, et al. 2023. Trends, cycles, and spatial distribution of the precipitation, potential evapotranspiration and aridity index in Xinjiang, China. Water, 15(1): 62, doi: 10.3390/w15010062.

[60]
Zhao R X, Wang H X, Chen J, et al. 2021. Quantitative analysis of nonlinear climate change impact on drought based on the standardized precipitation and evapotranspiration index. Ecological Indicators, 121: 107107, doi: 10.1016/j.ecolind.2020.107107.

[61]
Zhao W K, Jing C Q. 2022. Response of the natural grassland vegetation change to meteorological drought in Xinjiang from 1982 to 2015. Frontiers in Environmental Science, 10: 1047818, doi: 10.3389/fenvs.2022.1047818.

[62]
Zhou G X, Chen Y N, Yao J Q. 2023. Variations in precipitation and temperature in Xinjiang (Northwest China) and their connection to atmospheric circulation. Frontiers in Environmental Science, 10: 1082713, doi: 10.3389/fenvs.2022.1082713.

Outlines

/