
Impact of climate and human activity on NDVI of various vegetation types in the Three-River Source Region, China
Received date: 2024-04-10
Revised date: 2024-07-14
Accepted date: 2024-07-18
Online published: 2025-08-13
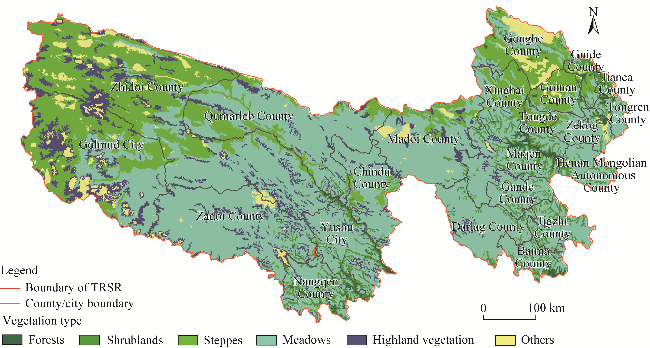
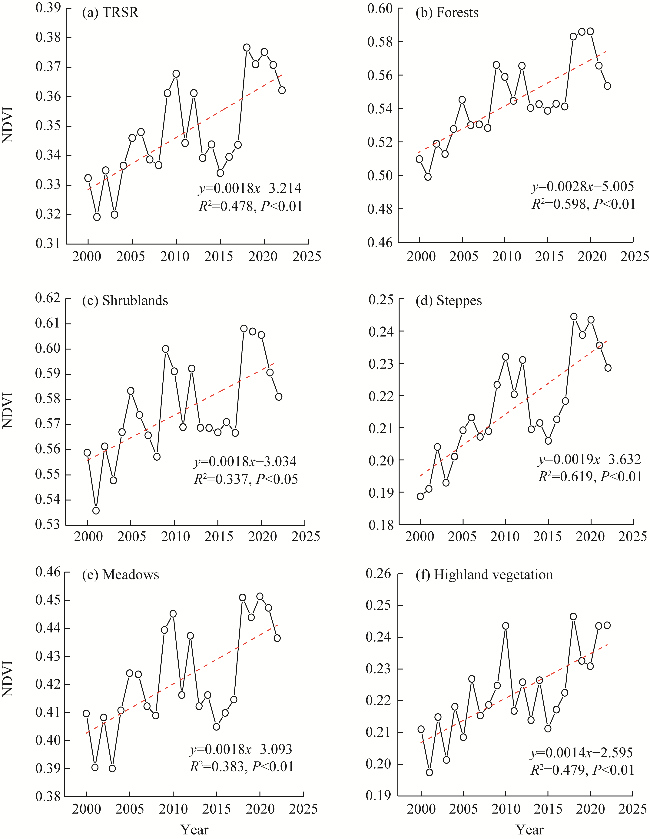
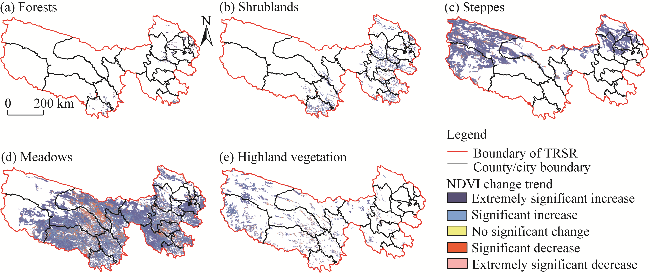
The Three-River Source Region (TRSR) in China holds a vital position and exhibits an irreplaceable strategic importance in ecological preservation at the national level. On the basis of an in-depth study of the vegetation evolution in the TRSR from 2000 to 2022, we conducted a detailed analysis of the feedback mechanism of vegetation growth to climate change and human activity for different vegetation types. During the growing season, the spatiotemporal variations of normalized difference vegetation index (NDVI) for different vegetation types in the TRSR were analyzed using the Moderate Resolution Imaging Spectroradiometer (MODIS)-NDVI data and meteorological data from 2000 to 2022. In addition, the response characteristics of vegetation to temperature, precipitation, and human activity were assessed using trend analysis, partial correlation analysis, and residual analysis. Results indicated that, after in-depth research, from 2000 to 2022, the TRSR's average NDVI during the growing season was 0.3482. The preliminary ranking of the average NDVI for different vegetation types was as follows: shrubland (0.5762)>forest (0.5443)>meadow (0.4219)>highland vegetation (0.2223)>steppe (0.2159). The NDVI during the growing season exhibited a fluctuating growth trend, with an average growth rate of 0.0018/10a (P<0.01). Notably, forests displayed a significant development trend throughout the growing season, possessing the fastest rate of change in NDVI (0.0028/10a). Moreover, the upward trends in NDVI for forests and steppes exhibited extensive spatial distributions, with significant increases accounting for 95.23% and 93.80%, respectively. The sensitivity to precipitation was significantly enhanced in other vegetation types other than highland vegetation. By contrast, steppes, meadows, and highland vegetation demonstrated relatively high vulnerability to temperature fluctuations. A further detailed analysis revealed that climate change had a significant positive impact on the TRSR from 2000 to 2022, particularly in its northwestern areas, accounting for 85.05% of the total area. Meanwhile, human activity played a notable positive role in the southwestern and southeastern areas of the TRSR, covering 62.65% of the total area. Therefore, climate change had a significantly higher impact on NDVI during the growing season in the TRSR than human activity.
LU Qing , KANG Haili , ZHANG Fuqing , XIA Yuanping , YAN Bing . Impact of climate and human activity on NDVI of various vegetation types in the Three-River Source Region, China[J]. Journal of Arid Land, 2024 , 16(8) : 1080 -1097 . DOI: 10.1007/s40333-024-0104-1
Fig. 1 Spatial distribution of different vegetation types in the Three-River Source Region (TRSR) |
Table 1 Relative contribution of climate change and human activity to normalized difference vegetation index (NDVI) variations under various scenarios |
| Category | Scenario | Slope | Relative contribution rate (%) | ||
|---|---|---|---|---|---|
| NDVICC | NDVIHA | NDVICC | NDVIHA | ||
| Area of vegetation increase | Scenario 1 | >0 | >0 | $\frac{\left|\Delta \mathrm{NDVI}_{\mathrm{CC}}\right|}{\left|\Delta \mathrm{NDVI}_{\mathrm{CC}}\right|+\left|\Delta \mathrm{NDVI}_{\mathrm{HA}}\right|} \times 100 \%$ | $\frac{\left|\Delta \mathrm{NDVI}_{\mathrm{HA}}\right|}{\left|\Delta \mathrm{NDVI}_{\mathrm{CC}}\right|+\left|\Delta \mathrm{NDVI}_{\mathrm{HA}}\right|} \times 100 \%$ |
| Scenario 2 | >0 | <0 | 100.00 | 0.00 | |
| Scenario 3 | <0 | >0 | 0.00 | 100.00 | |
| Area of vegetation decrease | Scenario 1 | <0 | <0 | $\frac{\left|\Delta \mathrm{NDVI}_{\mathrm{CC}}\right|}{\left|\Delta \mathrm{NDVI}_{\mathrm{CC}}\right|+\left|\Delta \mathrm{NDVI}_{\mathrm{HA}}\right|} \times 100 \%$ | $\frac{\left|\Delta \mathrm{NDVI}_{\mathrm{CC}}\right|}{\left|\Delta \mathrm{NDVI}_{\mathrm{CC}}\right|+\left|\Delta \mathrm{NDVI}_{\mathrm{HA}}\right|} \times 100 \%$ |
| Scenario 2 | <0 | >0 | 100.00 | 0.00 | |
| Scenario 3 | >0 | <0 | 0.00 | 100.00 | |
Note: NDVICC is the potential impact trend of climate changes on NDVI variations during the growing season; NDVIHA is the impact trend of human activities on NDVI variations; ΔNDVICC is the variations in NDVI predicted by climate changes alone at time t+j compared with NDVI at time t, of which j is the incremental time; ΔNDVIHA is the difference in the variation of NDVI residual under human activities compared with that without human activity disturbance. |
Fig. 2 Interannual change in normalized difference vegetation index (NDVI) of the TRSR (a) and different vegetation types (b-f) during the growing season from 2000 to 2022 |
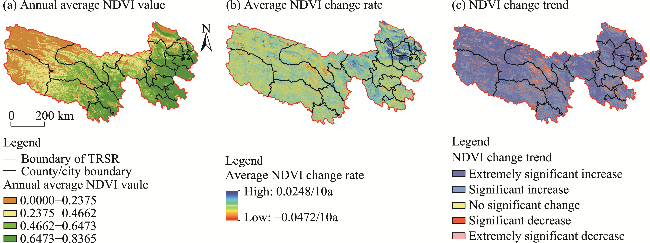
Fig. 3 Spatial distribution of NDVI variations in the TRSR during the growing season from 2000 to 2022. (a), annual average NDVI; (b), change rate of average NDVI; (c), change trend of average NDVI. |
Fig. 4 Spatial change trend of NDVI of different vegetation types in the TRSR during the growing season from 2000 to 2022. (a), forests; (b), shrublands; (c), steppes; (d), meadows; (e), highland vegetation. |
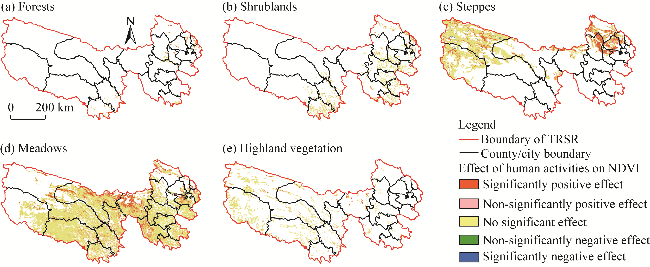
Fig. 5 Spatial distribution of human activity contribution to NDVI variations of different vegetation types in the TRSR during the growing season from 2000 to 2022. (a), forests; (b), shrublands; (c), steppes; (d), meadows; (e), highland vegetation. |
Table 2 Proportion of area contributed by climate change and human activity to NDVI variations in the TRSR from 2000 to 2022 |
| Relative contribution rate (%) | Proportion of area (%) | |
|---|---|---|
| Climate change | Human activity | |
| < -20.00 | 1.17 | 8.74 |
| -20.00-0.00 | 13.78 | 28.61 |
| 0.00-20.00 | 9.64 | 14.56 |
| 20.00-40.00 | 19.16 | 10.23 |
| 40.00-60.00 | 19.11 | 12.59 |
| 60.00-80.00 | 17.02 | 9.69 |
| ≥80.00 | 20.12 | 15.58 |
Table 3 Proportion of area contributed by climate change and human activity to NDVI variations in different vegetation types in the TRSR from 2000 to 2022 |
| Relative contribution rate (%) | Proportion of area (%) | |||||||||
|---|---|---|---|---|---|---|---|---|---|---|
| Climate change | Human activity | |||||||||
| Forest | Shrubland | Steppe | Meadow | Highland vegetation | Forest | Shrubland | Steppe | Meadow | Highland vegetation | |
| < -20.00 | 1.02 | 0.92 | 0.36 | 0.38 | 1.12 | 1.92 | 1.84 | 1.24 | 1.26 | 2.11 |
| -20.00-0.00 | 5.64 | 8.83 | 6.58 | 9.58 | 12.77 | 8.65 | 17.64 | 4.45 | 16.09 | 10.46 |
| 0.00-20.00 | 9.84 | 7.75 | 36.95 | 8.84 | 28.16 | 8.17 | 11.35 | 2.12 | 9.33 | 5.18 |
| 20.00-40.00 | 23.90 | 15.61 | 25.97 | 17.61 | 19.78 | 16.34 | 17.89 | 6.30 | 16.51 | 9.24 |
| 40.00-60.00 | 27.24 | 20.79 | 18.07 | 22.46 | 14.09 | 27.24 | 20.79 | 18.07 | 22.46 | 14.09 |
| 60.00-80.00 | 16.34 | 17.89 | 6.30 | 16.51 | 9.24 | 23.02 | 14.73 | 25.09 | 16.73 | 18.82 |
| ≥80.00 | 16.02 | 28.19 | 5.77 | 24.62 | 14.84 | 14.68 | 15.79 | 42.73 | 17.62 | 40.10 |
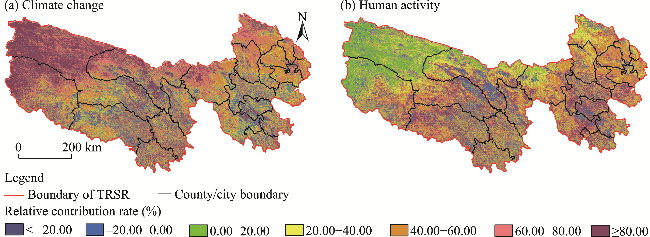
Fig. 6 Spatial distribution of relative contribution of climate change (a) and human activity (b) to NDVI variations in the TRSR from 2000 to 2022 |
Table 4 Correlation between average precipitation of the growing season and NDVI of different vegetation types in the TRSR from 2000 to 2022 |
| Vegetation type | Partial correlation coefficient | P |
|---|---|---|
| Forests | 0.65 | 0.001 |
| Shrublands | 0.54 | 0.010 |
| Steppes | 0.56 | 0.007 |
| Meadows | 0.52 | 0.014 |
| Highland vegetation | 0.37 | 0.091 |
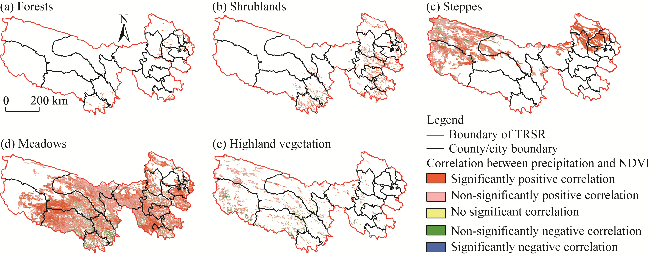
Fig. 7 Spatial distribution of correlation between average precipitation and NDVI of different vegetation types in the TRSR from 2000 to 2022. (a), forests; (b), shrublands; (c), steppes; (d), meadows; (e), highland vegetation. |
Table 5 Proportion of area occupied by different correlation levels between precipitation and NDVI of different vegetation types in the TRSR from 2000 to 2022 |
| Correlation level | Proportion of area (%) | ||||
|---|---|---|---|---|---|
| Forests | Shrublands | Steppes | Meadows | Highland vegetation | |
| Significantly positive correlation | 46.23 | 40.31 | 43.48 | 37.63 | 15.83 |
| Non-significantly positive correlation | 43.51 | 49.46 | 49.62 | 53.10 | 61.25 |
| No significant correlation | 0.36 | 0.29 | 0.18 | 0.12 | 0.55 |
| Significantly negative correlation | 0.73 | 0.37 | 0.25 | 0.32 | 0.88 |
| Non-significantly negative correlation | 9.19 | 9.58 | 6.47 | 8.85 | 21.47 |
Table 6 Correlation between average temperature of the growing season and the NDVI of different vegetation types in the TRSR from 2000 to 2022 |
| Vegetation type | Partial correlation coefficient | P |
|---|---|---|
| Forests | 0.12 | 0.594 |
| Shrublands | 0.27 | 0.225 |
| Steppes | 0.42 | 0.049 |
| Meadows | 0.52 | 0.014 |
| Highland vegetation | 0.61 | 0.002 |
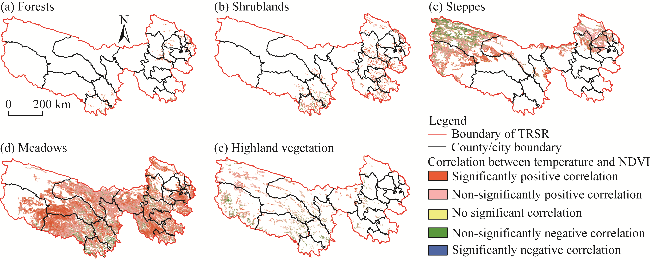
Fig. 8 Spatial distribution of correlation between temperature and NDVI of different vegetation types in the TRSR from 2000 to 2022. (a), forests; (b), shrublands; (c), steppes; (d), meadows; (e), highland vegetation. |
Table 7 Proportion of area occupied by different correlation levels between temperature and the NDVI of different vegetation types in the TRSR from 2000 to 2022 |
| Correlation level | Proportion of area (%) | ||||
|---|---|---|---|---|---|
| Forests | Shrublands | Steppes | Meadows | Highland vegetation | |
| Significantly positive correlation | 27.41 | 30.98 | 21.27 | 44.07 | 28.08 |
| Non-significantly positive correlation | 57.01 | 55.45 | 57.55 | 47.34 | 49.14 |
| No significant correlation | 0.36 | 0.29 | 0.18 | 0.12 | 0.54 |
| Significantly negative correlation | 0.89 | 0.53 | 0.55 | 0.26 | 0.82 |
| Non-significantly negative correlation | 14.34 | 12.76 | 20.46 | 8.21 | 21.42 |
| [1] |
|
| [2] |
|
| [3] |
|
| [4] |
|
| [5] |
|
| [6] |
|
| [7] |
|
| [8] |
|
| [9] |
|
| [10] |
|
| [11] |
|
| [12] |
|
| [13] |
|
| [14] |
|
| [15] |
|
| [16] |
|
| [17] |
|
| [18] |
|
| [19] |
|
| [20] |
|
| [21] |
|
| [22] |
|
| [23] |
|
| [24] |
|
| [25] |
|
| [26] |
|
| [27] |
|
| [28] |
|
| [29] |
|
| [30] |
|
| [31] |
|
| [32] |
|
| [33] |
|
| [34] |
|
| [35] |
|
| [36] |
|
| [37] |
|
| [38] |
|
| [39] |
|
| [40] |
|
| [41] |
|
| [42] |
|
| [43] |
|
| [44] |
|
| [45] |
|
| [46] |
|
| [47] |
|
| [48] |
|
| [49] |
|
| [50] |
|
| [51] |
|
| [52] |
|
| [53] |
|
| [54] |
|
| [55] |
|
| [56] |
|
| [57] |
|
| [58] |
|
| [59] |
|
| [60] |
|
| [61] |
|
| [62] |
|
/
| 〈 |
|
〉 |