
Spatiotemporal variation and driving factors of vegetation net primary productivity in the Guanzhong Plain Urban Agglomeration, China from 2001 to 2020
Received date: 2024-07-26
Revised date: 2024-11-10
Accepted date: 2024-11-14
Online published: 2025-08-13
Studying the spatiotemporal variation and driving mechanisms of vegetation net primary productivity (NPP) in the Guanzhong Plain Urban Agglomeration (GPUA) of China is highly important for regional green and low-carbon development. This study used the Theil-Sen trend analysis, Mann-Kendall trend test, coefficient of variation, Hurst index, and machine learning method (eXtreme Gradient Boosting and SHapley Additive exPlanations (XGBoost-SHAP)) to analyze the spatiotemporal variation of NPP in the GPUA from 2001 to 2020 and reveal its response to climate change and human activities. The results found that during 2001-2020, the averageNPP in the GPUA showed a significant upward trend, with an annual growth rate of 10.84 g C/(m2•a). The multi-year average NPP in the GPUA was 484.83 g C/(m2•a), with higher values in the southwestern Qinling Mountains and lower values in the central and northeastern cropland and built-up areas. The average coefficient of variation of NPP in the GPUA was 0.14, indicating a relatively stable state overall, but 72.72% of the study area showed weak anti-persistence, suggesting that NPP in most areas may have declined in the short term. According to XGBoost-SHAP analyses, elevation, land use type and precipitation were identified as the main driving factors of NPP. Appropriate precipitation and higher temperatures promote NPP growth, whereas extreme climates, high population density, and nighttime lighting inhibit NPP. This study has important theoretical and practical significance for achieving regional sustainable development, offers a scientific basis for formulating effective ecological protection and restoration strategies, and promotes green, coordinated, and sustainable development in the GPUA.
LIU Yuke , HUANG Chenlu , YANG Chun , CHEN Chen . Spatiotemporal variation and driving factors of vegetation net primary productivity in the Guanzhong Plain Urban Agglomeration, China from 2001 to 2020[J]. Journal of Arid Land, 2025 , 17(1) : 74 -92 . DOI: 10.1007/s40333-025-0070-2
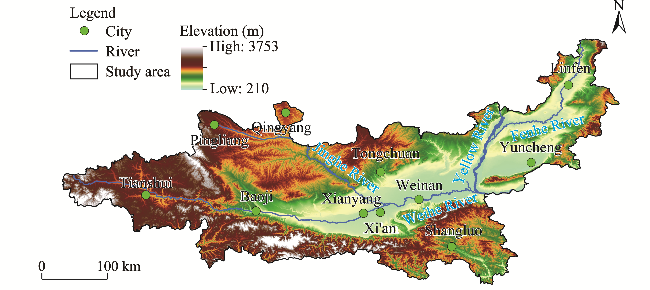
Fig. 1 Overview of the Guanzhong Plain Urban Agglomeration (GPUA) based on the digital elevation model (DEM) |
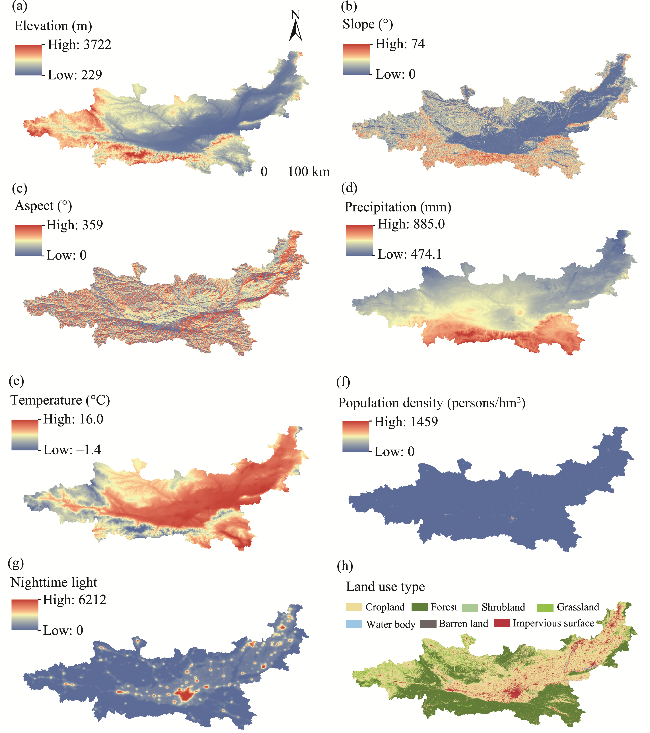
Fig. 2 Spatial distribution of driving factors affecting net primary productivity (NPP) changes during 2001-2020. (a), elevation; (b), slope; (c), aspect; (d), precipitation; (e), temperature; (f), population density; (g), nighttime light; (h), land use type. |
Table 1 Classification criteria for the change trends of net primary productivity |
| Sen's slope | P | Change trend | Sen's slope | P | Change trend |
|---|---|---|---|---|---|
| >0 | <0.01 | Highly significant increase | <0 | ≥0.05 | Non-significant decrease |
| >0 | 0.01-0.05 | Significant increase | <0 | 0.01-0.05 | Significant decrease |
| >0 | ≥0.05 | Non-significant increase | <0 | <0.01 | Highly significant decrease |
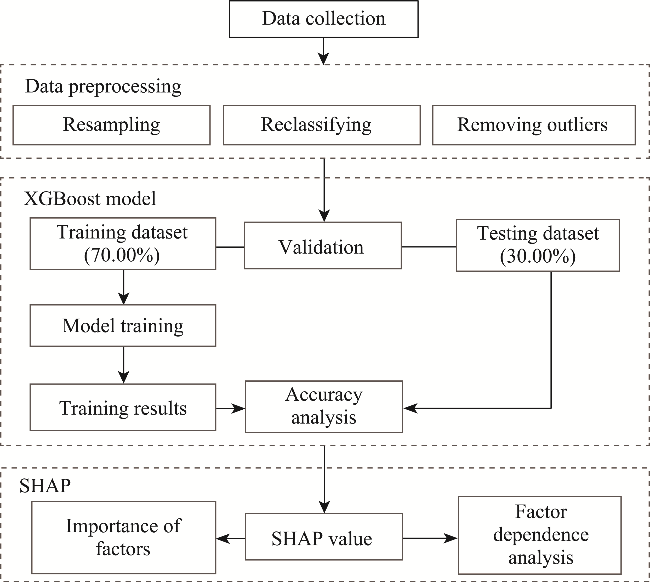
Fig. 3 Flowchart of the XGBoost-SHAP model. XGBoost, eXtreme Gradient Boosting; SHAP, SHapley Additive exPlanations. |
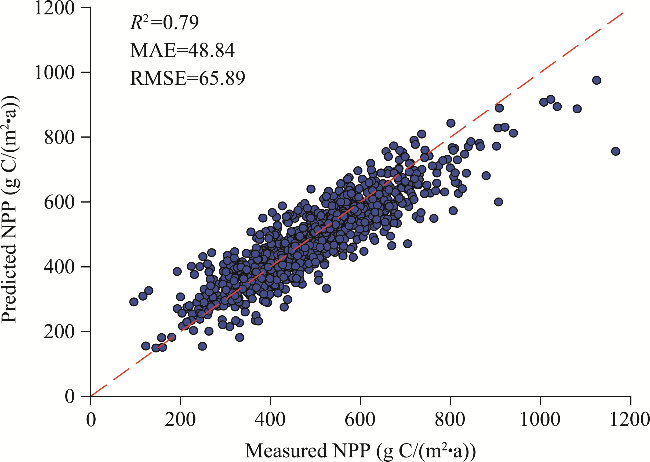
Fig. 4 Accuracy evaluation of predicted NPP in the XGBoost model. MAE, mean absolute error; RMSE, root mean square error. |
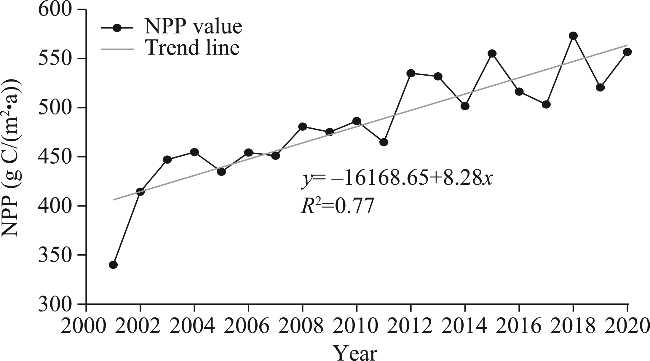
Fig. 5 Temporal variation in average NPP in the GPUA from 2001 to 2020 |
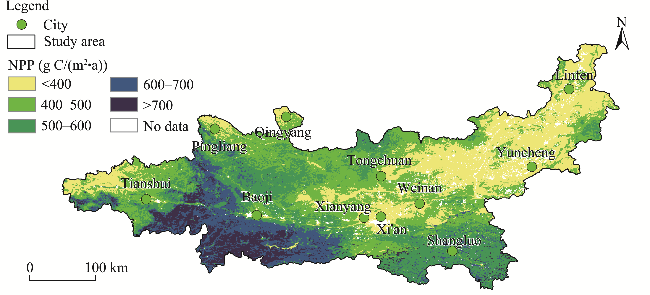
Fig. 6 Spatial variation in multi-year average NPP in the GPUA during 2001-2020 |
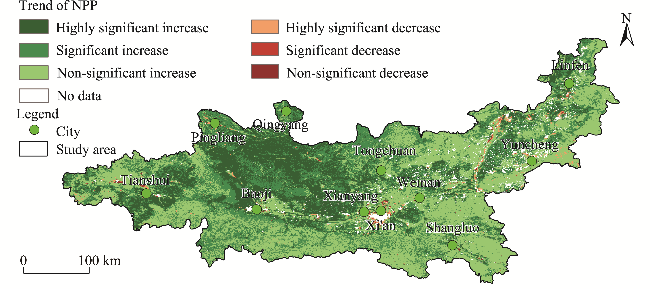
Fig. 7 Spatial variation in the trend of annual NPP in the GPUA during 2001-2020 |
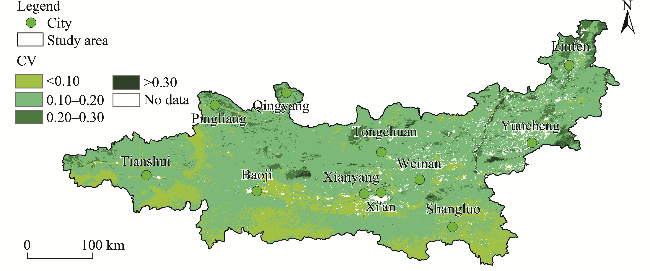
Fig. 8 Spatial variation in coefficient of variation (CV) in the GPUA during 2001-2020 |
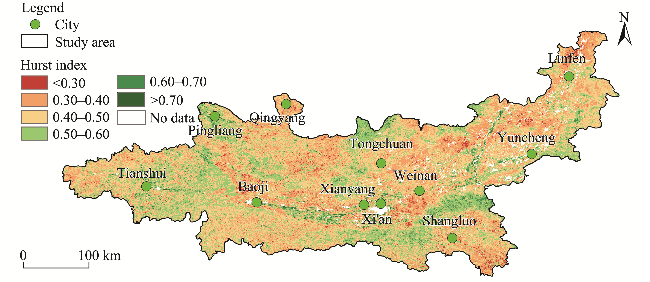
Fig. 9 Spatial variation in Hurst index in the GPUA during 2001-2020 |
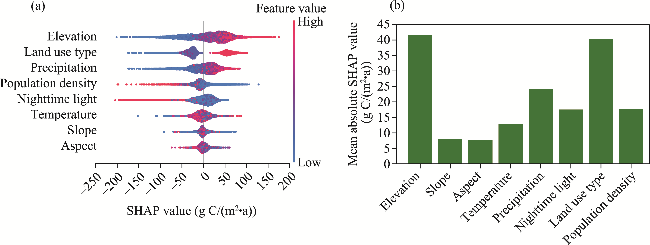
Fig. 10 SHAP value impact plot of the XGBoost model (a) and bar plot showing the mean absolute SHAP values of each driving factor of NPP (b) |
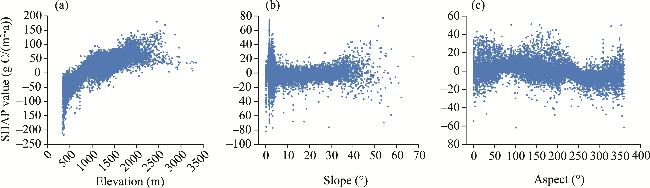
Fig. 11 SHAP dependence plots of elevation (a), slope (b), and aspect (c) |
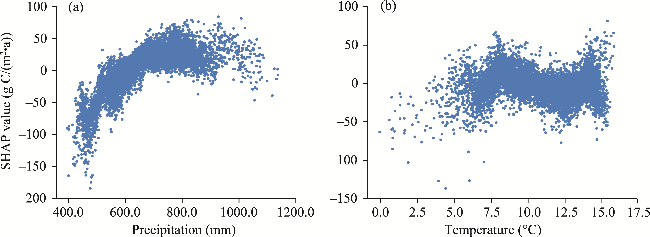
Fig. 12 SHAP dependence plots of precipitation (a) and temperature (b) |
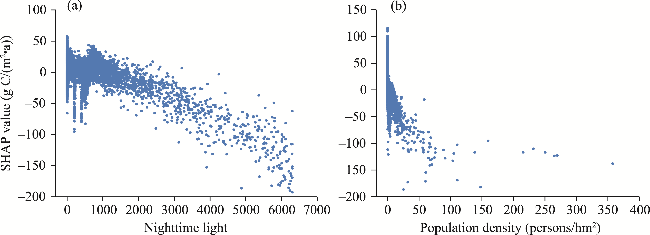
Fig. 13 SHAP dependence plots of nighttime light (a) and population density (b) |
Table 2 Land use transition matrix (unit: km2) in the GPUA during 2001-2020 |
| Cropland | Forest | Shrubland | Grassland | Water body | Barren land | Impervious surface | |
|---|---|---|---|---|---|---|---|
| Cropland | 45,615.23 | 1749.60 | 5.11 | 3278.88 | 149.06 | 3.21 | 2813.82 |
| Forest | 580.16 | 33,808.78 | 14.88 | 45.42 | 0.18 | 0.02 | 7.40 |
| Shrubland | 17.86 | 372.74 | 54.71 | 61.81 | 0.00 | 0.00 | 0.03 |
| Grassland | 3714.82 | 2906.45 | 48.90 | 7625.97 | 10.22 | 0.91 | 80.92 |
| Water body | 78.21 | 0.53 | 0.00 | 0.77 | 204.97 | 0.20 | 48.78 |
| Barren land | 0.59 | 0.00 | 0.00 | 0.54 | 2.85 | 0.90 | 2.04 |
| Impervious surface | 29.09 | 0.03 | 0.00 | 0.46 | 89.97 | 0.23 | 3709.85 |
| [1] |
|
| [2] |
|
| [3] |
|
| [4] |
|
| [5] |
|
| [6] |
|
| [7] |
|
| [8] |
|
| [9] |
|
| [10] |
|
| [11] |
|
| [12] |
|
| [13] |
|
| [14] |
|
| [15] |
|
| [16] |
|
| [17] |
|
| [18] |
|
| [19] |
|
| [20] |
|
| [21] |
|
| [22] |
|
| [23] |
|
| [24] |
|
| [25] |
|
| [26] |
|
| [27] |
|
| [28] |
|
| [29] |
|
| [30] |
|
| [31] |
|
| [32] |
|
| [33] |
|
| [34] |
|
| [35] |
|
| [36] |
|
| [37] |
|
| [38] |
|
| [39] |
|
| [40] |
|
| [41] |
|
| [42] |
|
| [43] |
|
| [44] |
|
| [45] |
|
| [46] |
|
| [47] |
|
| [48] |
|
| [49] |
|
| [50] |
|
| [51] |
|
| [52] |
|
| [53] |
|
| [54] |
|
| [55] |
|
| [56] |
|
/
| 〈 |
|
〉 |