
Land use/cover change and ecological network in Gansu Province, China during 2000-2020 and their simulations in 2050
Received date: 2024-07-03
Revised date: 2024-11-18
Accepted date: 2024-11-25
Online published: 2025-08-13
Land use/cover change (LUCC) constitutes the spatial and temporal patterns of ecological security, and the construction of ecological networks is an effective way to ensure ecological security. Exploring the spatial and temporal change characteristics of ecological network and analyzing the integrated relationship between LUCC and ecological security are crucial for ensuring regional ecological security. Gansu is one of the provinces with fragile ecological environment in China, and rapid changes in land use patterns in recent decades have threatened ecological security. Therefore, taking Gansu Province as the study area, this study simulated its land use pattern in 2050 using patch-generating land use simulation (PLUS) model based on the LUCC trend from 2000 to 2020 and integrated the LUCC into morphological spatial pattern analysis (MSPA) to identify ecological sources and extract the ecological corridors to construct ecological network using circuit theory. The results revealed that, according to the prediction results in 2050, the areas of cultivated land, forest land, grassland, water body, construction land, and unused land would be 63,447.52, 39,510.80, 148,115.18, 4605.21, 8368.89, and 161,752.40 km2, respectively. The number of ecological sources in Gansu Province would increase to 80, with a total area of 99,927.18 km2. The number of ecological corridors would increase to 191, with an estimated total length of 6120.66 km. Both ecological sources and ecological corridors showed a sparse distribution in the northwest and dense distribution in the southeast of the province at the spatial scale. The number of ecological pinch points would reach 312 and the total area would expect to increase to 842.84 km2, with the most pronounced increase in the Longdong region. Compared with 2020, the number and area of ecological barriers in 2050 would decrease significantly by 63 and 370.71 km2, respectively. In general, based on the prediction results, the connectivity of ecological network of Gansu Province would increase in 2050. To achieve the predicted ecological network in 2050, emphasis should be placed on the protection of cultivated land and ecological land, the establishment of ecological sources in desert areas, the reinforcement of the protection for existing ecological sources, and the construction of ecological corridors to enhance the stability of ecological network. This study provides valuable theoretical support and references for the future construction of ecological networks and regional land resource management decision-making.
MA Xinshu , XIN Cunlin , CHEN Ning , XIN Shunjie , CHEN Hongxiang , ZHANG Bo , KANG Ligang , WANG Yu , JIAO Jirong . Land use/cover change and ecological network in Gansu Province, China during 2000-2020 and their simulations in 2050[J]. Journal of Arid Land, 2025 , 17(1) : 43 -57 . DOI: 10.1007/s40333-025-0092-9
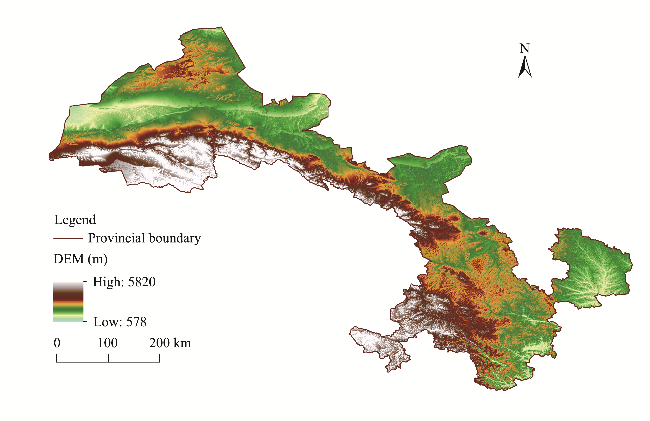
Fig. 1 Topography of Gansu Province. DEM, digital elevation model. |
Table 1 Indicators used in this study and their data sources |
| Data type | Indicator | Year | Resolution | Data source | |
|---|---|---|---|---|---|
| Land use | Land use/cover change (LUCC) | 2000, 2010, and 2020 | 30 m | Resources and Environmental Science Data Platform, Chinese Academy of Sciences (https://www.resdc.cn) | |
| Socio-economy | Gross domestic product (GDP; ×104 CNY/km2) | 2020 | 1 km | Resources and Environmental Science Data Platform, Chinese Academy of Sciences (https://www.resdc.cn) | |
| Population (people/km2) | 2020 | 1 km | Resources and Environmental Science Data Platform, Chinese Academy of Sciences (https://www.resdc.cn) | ||
| Distance to road (m) | 2020 | 100 m | Open Street Map (https://www.openhistoricalmap.org) | ||
| Climatic environment | Digital elevation model (DEM; m) | 2020 | 90 m | Resources and Environmental Science Data Platform, Chinese Academy of Sciences (https://www.resdc.cn) | |
| Slope (°) | 2020 | 90 m | |||
| Annual precipitation (mm) | 2020 | 1 km | |||
| Annual average temperature (°C) | 2020 | 1 km | |||
| Soil type | 1995 | 1 km | |||
| Soil erosion (t/(km2•a)) | 1995 | 1 km | |||
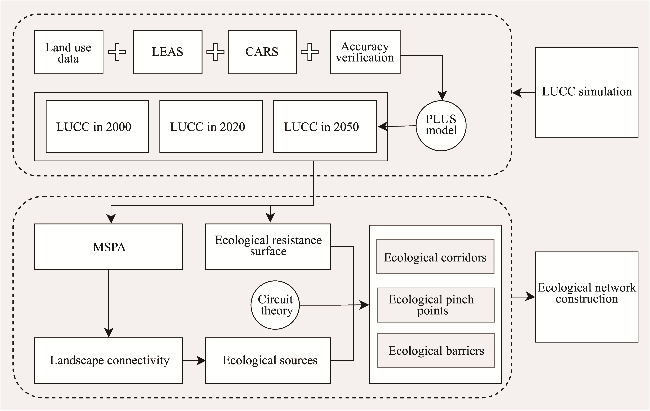
Fig. 2 Research framework of this study. LEAS, land expansion analysis strategy; CARS, cellular automata model based on multi-type random Seeds; PLUS, patch-generating land use simulation; LUCC, land use/cover change; MSPA, morphological spatial pattern analysis. |
Table 2 Neighborhood weight of each land use type |
| Land use type | Cultivated land | Forest land | Grassland | Water body | Construction land | Unused land |
|---|---|---|---|---|---|---|
| Neighborhood weight | 0.00 | 0.48 | 0.78 | 0.61 | 1.00 | 0.07 |
Table 3 Land use transition matrix |
| Land use type | Cultivated land | Forest land | Grassland | Water body | Construction land | Unused land |
|---|---|---|---|---|---|---|
| Cultivated land | 1 | 1 | 1 | 1 | 1 | 1 |
| Forest land | 1 | 1 | 1 | 1 | 1 | 1 |
| Grassland | 1 | 1 | 1 | 1 | 1 | 1 |
| Water body | 0 | 0 | 0 | 1 | 0 | 0 |
| Construction land | 1 | 1 | 1 | 1 | 1 | 1 |
| Unused land | 1 | 1 | 1 | 1 | 1 | 1 |
Note: The number 1 represents that two land use types can be converted into each other, while the number 0 indicates can't (Mondal et al., 2016). |
Table 4 Resistance factor assignment and weight |
| Resistance factor | Grading criteria | Resistance value | Weight |
|---|---|---|---|
| Land use type | Forest land | 1 | 0.34 |
| Water body | 2 | ||
| Grassland | 3 | ||
| Cultivated land | 4 | ||
| Construction land and unused land | 5 | ||
| Slope (°) | 0.00-5.11 | 1 | 0.10 |
| 5.11-12.24 | 2 | ||
| 12.24-20.10 | 3 | ||
| 20.10-29.77 | 4 | ||
| 29.77-77.05 | 5 | ||
| DEM (m) | 578-1626 | 1 | 0.12 |
| 1626-2239 | 2 | ||
| 2239-2988 | 3 | ||
| 2988-3770 | 4 | ||
| 3770-5820 | 5 | ||
| Population (people/km2) | 0-97 | 1 | 0.24 |
| 97-756 | 2 | ||
| 756-2903 | 3 | ||
| 2903-7638 | 4 | ||
| 7638-12,840 | 5 | ||
| Distance to road (m) | 107,726.28-180,016.29 | 1 | 0.20 |
| 67,328.93-107,726.28 | 2 | ||
| 36,145.00-67,328.93 | 3 | ||
| 13,465.78-36,145.00 | 4 | ||
| 36,145.00-13,465.78 | 5 |
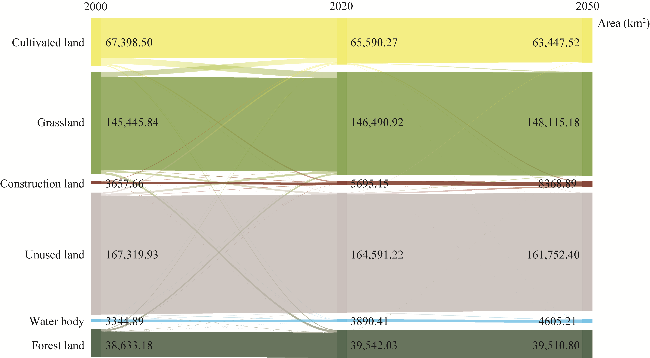
Fig. 3 Sankey diagram of land use transfer in Gansu Province from 2000 to 2050. The width of the curve represents the area of transfer between different land use types. |
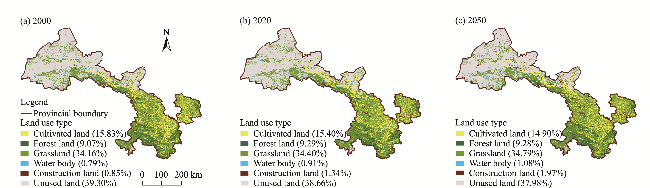
Fig. 4 Spatial distribution of land use type in Gansu Province in 2000 (a) and 2020 (b), and simulation result in 2050 (c) |
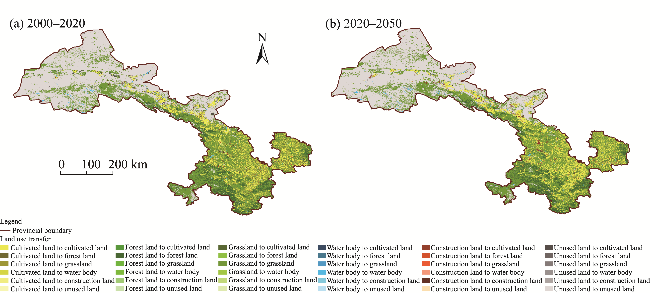
Fig. 5 Spatial distribution of land use transfer in Gansu Province during 2000-2020 (a) and 2020-2050 (b) |
Table 5 Statistics of ecological source, corridor, pinch point, and barrier in Gansu Province |
| Component of ecological network | Year | |||
|---|---|---|---|---|
| 2000 | 2020 | 2050 | ||
| Ecological source | Amount | 50 | 60 | 80 |
| Area (km2) | 92,317.96 | 97,512.30 | 99,927.18 | |
| Ecological corridor | Amount | 113 | 139 | 191 |
| Length (km) | 2922.52 | 4858.95 | 6120.66 | |
| Ecological pinch point | Amount | 207 | 307 | 312 |
| Area (km2) | 508.12 | 814.34 | 842.84 | |
| Ecological barrier | Amount | 111 | 163 | 100 |
| Area (km2) | 2827.15 | 3252.70 | 2881.99 | |
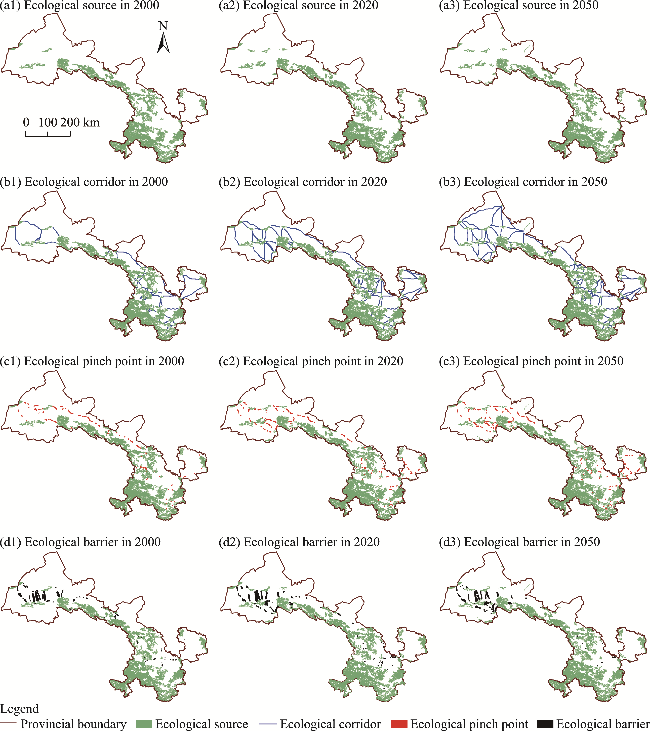
Fig. 6 Spatial distribution of ecological source (a1 and a2), corridor (b1 and b2), pinch point (c1 and c2), and barrier (d1 and d2) in Gansu Province in 2000 and 2020, and simulation result in 2050 (a3, b3, c3, and d3) |
| [1] |
|
| [2] |
|
| [3] |
|
| [4] |
|
| [5] |
|
| [6] |
|
| [7] |
|
| [8] |
|
| [9] |
|
| [10] |
|
| [11] |
|
| [12] |
|
| [13] |
|
| [14] |
|
| [15] |
|
| [16] |
|
| [17] |
|
| [18] |
|
| [19] |
|
| [20] |
|
| [21] |
|
| [22] |
|
| [23] |
|
| [24] |
|
| [25] |
|
| [26] |
|
| [27] |
|
| [28] |
|
| [29] |
|
| [30] |
|
| [31] |
|
| [32] |
|
| [33] |
|
| [34] |
|
| [35] |
|
| [36] |
|
| [37] |
|
| [38] |
|
| [39] |
|
| [40] |
|
| [41] |
|
| [42] |
|
| [43] |
|
| [44] |
|
| [45] |
|
| [46] |
|
| [47] |
|
| [48] |
|
| [49] |
|
| [50] |
|
| [51] |
|
| [52] |
|
| [53] |
|
| [54] |
|
| [55] |
|
| [56] |
|
| [57] |
|
| [58] |
|
| [59] |
|
| [60] |
|
/
| 〈 |
|
〉 |