
Effects of biological soil crusts on plant growth and nutrient dynamics in the Minqin oasis-desert ecotone, Northwest China
Received date: 2024-07-13
Revised date: 2024-11-03
Accepted date: 2024-11-23
Online published: 2025-08-13
Biological soil crusts (BSCs) play crucial roles in improving soil fertility and promoting plants settlement and reproduction in arid areas. However, the specific effects of BSCs on growth status and nutrient accumulation of plants are still unclear in different arid areas. This study analyzed the effects of three different BSCs treatments (without crust (WC), intact crust (IC), and broken crust (BC)) on the growth, inorganic nutrient absorption, and organic solute synthesis of three typical desert plants (Grubovia dasyphylla (Fisch. & C. A. Mey.) Freitag & G. Kadereit, Nitraria tangutorum Bobrov, and Caragana koraiensis Kom.) in the Minqin desert-oasis ecotone of Northwest China. Results showed that the effects of three BSCs treatments on seed emergence and survival of three plants varied with seed types. The IC treatment significantly hindered the emergence and survival of seeds, while the BC treatment was more conducive to seed emergence and survival of plants. BSCs significantly promoted the growth of three plants, but their effects on plant growth varied at different stages of the growth. Briefly, the growth of G. dasyphylla was affected by BSCs in early stage, but the effects on the growth of G. dasyphylla significantly weakened in the middle and late stages. However, the growth of N. tangutorum and C. koraiensis only showed differences at the middle and late stages, with a significant enhancement in growth. Analysis of variance showed that BSCs, plant species, growth period, and their interactions had significant effects on the biomass and root: shoot ratio of three plants. BSC significantly affected the nutrients absorption and organic solute synthesis in plants. Specifically, BSCs significantly promoted nitrogen (N) absorption in plants and increased plant adaptability in N poor desert ecosystems, but had no significant effects on phosphorus (P) absorption. The effects of BSCs on inorganic nutrient absorption and organic solute synthesis in plants varied significantly among different plant species. The results suggest that BSCs have significant effects on the growth and nutrient accumulation of desert plants, which will provide theoretical basis for exploring the effects of BSCs on desert plant diversity, biodiversity conservation, and ecosystem management measures in arid and semi-arid areas.
KANG Jianjun , YANG Fan , ZHANG Dongmei , DING Liang . Effects of biological soil crusts on plant growth and nutrient dynamics in the Minqin oasis-desert ecotone, Northwest China[J]. Journal of Arid Land, 2025 , 17(1) : 130 -143 . DOI: 10.1007/s40333-025-0003-0
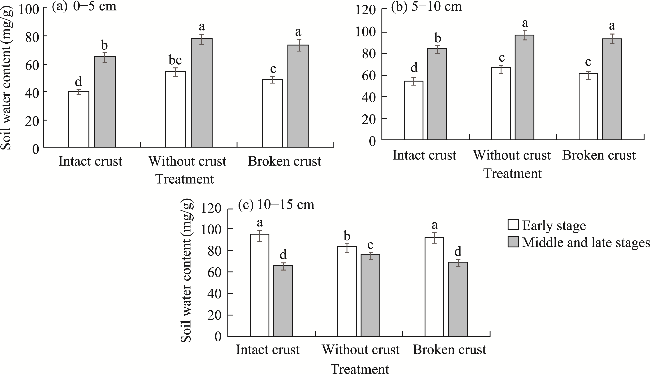
Fig. 1 Effects of different biological soil crusts (BSCs) treatments on soil water content. (a), 0-5 cm soil layer; (b), 5-10 cm soil layer; (c), 10-15 cm soil layer. Different lowercase letters indicate significant differences among different BSCs treatments at P<0.05 level. Bars are standard errors. |
Table 1 Changes of soil nutrients status under different BSCs treatments and soil layers |
| Index | 0-5 cm soil layer | 5-10 cm soil layer | 10-15 cm soil layer | ||||||
|---|---|---|---|---|---|---|---|---|---|
| IC | WC | BC | IC | WC | BC | IC | WC | BC | |
| SOC (g/kg) | 4.22±0.31a | 2.53±0.22b | 4.34±0.30a | 2.04±0.20c | 1.55±0.19d | 2.13±0.28bc | 1.64±0.27d | 1.53±0.16d | 1.58±0.21d |
| Total N (g/kg) | 0.43±0.01a | 0.39±0.02b | 0.46±0.05a | 0.30±0.03b | 0.22±0.04c | 0.32±0.04b | 0.25±0.03c | 0.25±0.03c | 0.27±0.04bc |
| Total P (g/kg) | 0.24±0.04a | 0.20±0.02ab | 0.25±0.04a | 0.24±0.02a | 0.20±0.01ab | 0.19±0.03ab | 0.22±0.02a | 0.19±0.01ab | 0.19±0.03ab |
| Total K (g/kg) | 13.36±0.82a | 11.41±0.71b | 14.86±1.02a | 11.69±0.90b | 10.26±0.91bc | 12.11±0.90ab | 9.25±0.40c | 9.30±0.56c | 9.33±0.38c |
| Available N (mg/kg) | 10.38±0.92a | 8.20±0.55b | 10.51±0.62a | 8.95±1.01b | 7.26±0.47c | 8.23±0.81b | 6.32±0.44d | 6.19±0.68d | 6.40±0.41d |
| Available P (mg/kg) | 7.20±0.75a | 6.58±0.62ab | 7.30±0.57a | 7.06±0.63a | 6.37±0.58ab | 7.09±0.47a | 6.63±0.55ab | 6.26±0.49ab | 6.51±0.42ab |
| Available K (mg/kg) | 123.65±9.80a | 103.56±7.60b | 131.65±7.80a | 98.28±6.00b | 94.26±7.30b | 96.31±5.20b | 72.38±5.30c | 73.75±4.40c | 73.95±4.90c |
Note: BSCs, biological soil crusts; SOC, soil organic carbon; N, nitrogen; P, phosphorous; K, potassium; IC, intact crust; WC, without crust; BC, broken crust. The abbreviations are the same as in the following figures and tables. Different lowercase letters within the same index indicates significant differences among different BSCs treatments and soil layers at P<0.05 level. Mean±SD. |
Table 2 Multivariate variance analysis of plant seed types and BSCs treatments on seed emergence rate |
| Variation source | Sum of square | df | Mean square | F | P |
|---|---|---|---|---|---|
| Correction mode | 33,546.51 | 9.00 | 3452.48 | 26.72 | 0.00 |
| Intercept | 125,448.86 | 1.00 | 125,448.86 | 1020.41 | 0.00 |
| Seed type (ST) | 30,665.31 | 2.00 | 10,508.20 | 86.46 | 0.00 |
| BSCs treatments (BSCs) | 2566.72 | 3.00 | 1240.40 | 10.86 | 0.00 |
| ST×BSCs | 1157.85 | 6.00 | 198.68 | 1.56 | 0.12 |
| Error | 4013.25 | 32.00 | 104.45 | ||
| Total variation (TA) | 159,320.58 | 49.00 | |||
| Correction of TA | 410,802.17 | 46.00 |
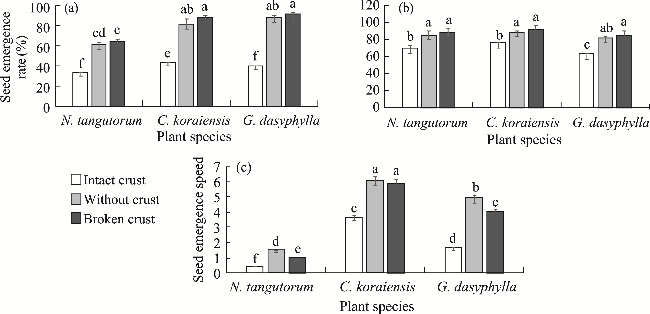
Fig. 2 Effects of different BSCs treatments on seed emergence rate (a), seedling survival rate (b), and seed emergence speed (c) of the three desert plants. N. tangutorum, Nitraria tangutorum Bobrov; C. koraiensis, Caragana koraiensis Kom.; G. dasyphylla, Grubovia dasyphylla (Fisch. & C. A. Mey.) Freitag & G. Kadereit. Different lowercase letters indicate significant differences among different BSCs treatments and plant species at P<0.05 level. Bars are standard errors. |
Table 3 Changes of plant height under different BSCs treatments and growth stages |
| Species | Treatment | Early growth stage (cm) | Middle growth stage (cm) | Late growth stage (cm) | End of growth period (cm) | |||
|---|---|---|---|---|---|---|---|---|
| 15 June | 1 July | 15 July | 1 August | 15 August | 1 September | |||
| Nitraria tangutorum Bobrov | IC | 3.42±0.21a | 6.06±0.31a | 10.02±0.60 a | 15.42±1.22a | 19.42±1.22a | 24.68±1.65a | 30.80±2.25a |
| WC | 3.02±0.28b | 5.01±0.42b | 9.14±0.66b | 13.45±0.98b | 17.15±0.98b | 21.15±1.20b | 27.45±1.78b | |
| BC | 3.70±0.26a | 6.20±0.50a | 10.28±0.58a | 15.09±1.30a | 20.19±1.30a | 25.15±1.40a | 31.58±2.50a | |
| Caragana koraiensis Kom. | IC | 2.89±0.22a | 5.10±0.35a | 8.17±0.61a | 12.38±0.65a | 16.13±0.65a | 20.23±2.60a | 25.06±2.77a |
| WC | 2.62±0.19b | 4.42±0.24b | 7.09±0.50b | 11.12±0.68b | 14.20±0.68b | 18.25±1.64b | 22.20±1.49b | |
| BC | 3.45±0.15a | 5.23±0.25a | 8.75±0.71a | 12.80±0.87a | 16.78±0.87a | 20.70±2.17a | 25.77±2.86a | |
| Grubovia dasyphylla (Fisch. & C. A. Mey.) Freitag & G. Kadereit | IC | 6.11±0.33a | 15.01±0.51a | 19.11±0.69a | 24.21±1.02a | 29.23±1.77a | 34.73±2.01a | 39.66±2.38a |
| WC | 5.34±0.20b | 13.80±0.71b | 17.38±0.80b | 22.17±1.21b | 27.36±1.57b | 31.38±1.85b | 35.40±2.80b | |
| BC | 6.61±0.25a | 15.72±0.66a | 19.71±0.91a | 24.02±1.15a | 29.66±1.8a | 34.16±1.69a | 39.10±2.25a | |
Note: Different lowercase letters within the same plant species indicates significant differences among different BSCs treatments at P<0.05 level. Mean±SD. |
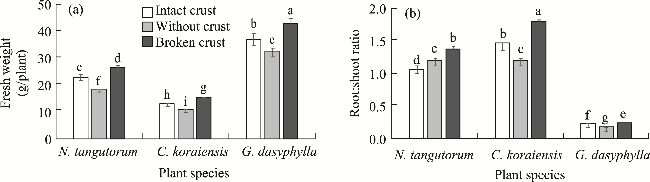
Fig. 3 Effects of different BSCs treatments on fresh weight (a) and root:shoot ratio (b) of the three desert plants. Different lowercase letters indicate significant differences among different BSCs treatments and plant species at P<0.05 level. Bars are standard errors. |
Table 4 One-way analysis of variance (ANOVA) on the effects of biological crusts, plant species, growth stages, and their interactions on plant growth |
| Factor | Fresh weight per plant | Aboveground biomass | Belowground biomass | Root:shoot ratio |
|---|---|---|---|---|
| Biological crusts (B) | 33.47** | 30.29** | 0.93 | 11.57** |
| Plant species (S) | 1026.83** | 1865.50** | 1565.39** | 90.91** |
| Growth stages (P) | 1895.66** | 1070.23** | 305.40** | 4.36* |
| B×S | 10.80** | 14.36** | 0.11 | 2.26 |
| B×P | 36.14** | 34.40** | 2.96* | 4.02* |
| S×P | 504.28** | 412.75** | 178.23** | 4.47* |
| B×S×P | 18.45** | 15.56** | 1.45* | 0.69** |
Note: *, P<0.05 level; **, P<0.01 level. |
Table 5 Effects of different BSCs treatments on inorganic nutrient uptake of the three desert plants |
| Index (mg/g) | N. tangutorum | C. koraiensis | G. dasyphylla | ||||||
|---|---|---|---|---|---|---|---|---|---|
| IC | WC | BC | IC | WC | BC | IC | WC | BC | |
| N | 25.35±1.33b | 22.10±1.06c | 30.30±1.39a | 19.14±0.94d | 16.65±0.73e | 24.86±0.88b | 16.81±0.23e | 14.15±0.27f | 20.41±0.31cd |
| P | 0.09±0.01ab | 0.10±0.01a | 0.9±0.01ab | 0.09±0.03ab | 0.08±0.01ab | 0.09±0.03ab | 0.11±0.02a | 0.11±0.03a | 0.10±0.03a |
| K+ | 16.10±1.28e | 15.43±1.33e | 14.82±1.33e | 29.65±1.77b | 25.16±1.15c | 36.65±1.77a | 20.45±1.26d | 16.39±0.79e | 25.38±1.22c |
| Na+ | 47.41±2.32b | 36.47±2.18c | 60.45±2.25a | 2.79±0.35e | 2.90±0.24e | 2.74±0.33e | 6.77±0.32d | 6.33±0.48d | 6.53±0.41d |
| Ca2+ | 28.24±2.09b | 23.16±0.89c | 34.11±2.11a | 17.35±1.23e | 14.22±0.65f | 20.85±1.25d | 9.36±0.34h | 7.13±0.23i | 11.30±0.55g |
| Mg2+ | 16.15±1.33b | 14.13±0.74c | 18.95±1.06a | 8.65±0.51f | 7.26±0.43g | 11.66±0.30d | 8.25±0.19f | 7.16±0.27g | 9.55±0.24e |
| SiO32- | 43.63±2.90b | 37.69±1.92c | 50.74±3.11a | 32.11±1.53d | 26.37±1.77e | 37.54±2.24c | 22.94±1.31f | 20.29±1.15g | 24.57±1.68ef |
Note: Different lowercase letters within the same index indicates significant differences among different BSCs treatments and plant species at P<0.05 level. Mean±SD. |
Table 6 Effect of different BSCs treatments on organic solutes synthesis of the three desert plants |
| Index (mg/g) | N. tangutorum | C. koraiensis | G. dasyphylla | ||||||
|---|---|---|---|---|---|---|---|---|---|
| IC | WC | BC | IC | WC | BC | IC | WC | BC | |
| Free proline | 1.18±0.16g | 1.12±0.12g | 1.09±0.18g | 5.03±0.29b | 4.16±0.18c | 5.73±0.31a | 3.61±0.25e | 3.13±0.21f | 4.11±0.22d |
| Soluble sugar | 2.24±0.32g | 2.17±0.41g | 2.11±0.30g | 8.45±0.34b | 7.12±0.29c | 9.36±0.24a | 6.22±0.31e | 5.45±0.40f | 6.79±0.36d |
| Soluble protein | 1.44±0.29g | 1.38±0.21g | 1.32±0.36g | 6.12±0.30b | 5.33±0.32c | 6.82±0.40a | 4.50±0.40e | 4.05±0.25f | 4.98±0.33d |
Note: Different lowercase letters within the same index indicates significant differences among different BSCs treatments and plant species at P<0.05 level. Mean±SD. |
| [1] |
|
| [2] |
|
| [3] |
|
| [4] |
|
| [5] |
|
| [6] |
|
| [7] |
|
| [8] |
|
| [9] |
|
| [10] |
|
| [11] |
|
| [12] |
|
| [13] |
|
| [14] |
|
| [15] |
|
| [16] |
|
| [17] |
|
| [18] |
|
| [19] |
|
| [20] |
|
| [21] |
|
| [22] |
|
| [23] |
|
| [24] |
|
| [25] |
|
| [26] |
|
| [27] |
|
| [28] |
|
| [29] |
|
| [30] |
|
| [31] |
|
| [32] |
|
| [33] |
|
| [34] |
|
| [35] |
|
| [36] |
|
| [37] |
|
| [38] |
|
| [39] |
|
| [40] |
|
| [41] |
|
| [42] |
|
| [43] |
|
| [44] |
|
| [45] |
|
| [46] |
|
| [47] |
|
| [48] |
|
| [49] |
|
| [50] |
|
| [51] |
|
| [52] |
|
| [53] |
|
| [54] |
|
| [55] |
|
| [56] |
|
| [57] |
|
| [58] |
|
| [59] |
|
| [60] |
|
| [61] |
|
/
| 〈 |
|
〉 |