Research article

Impact of climate change on water resources in the Yarmouk River Basin of Jordan

  • Abdelaziz Q BASHABSHEH , * ,
  • Kamel K ALZBOON
Expand
  • Environmental Engineering Department, Al-Huson University College, Al-Balqa' Applied University, Irbid 21510, Jordan
*Abdelaziz Q BASHABSHEH (E-mail: )

Received date: 2024-05-05

  Revised date: 2024-09-27

  Accepted date: 2024-11-06

  Online published: 2025-08-13

Abstract

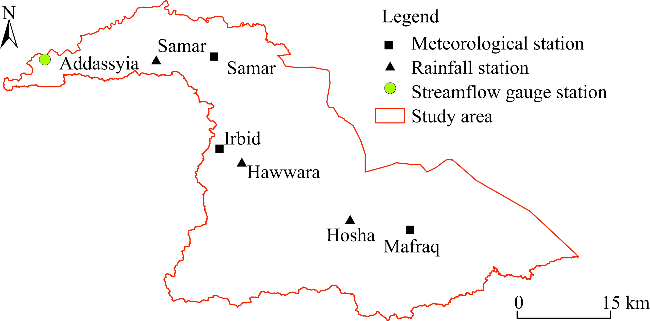
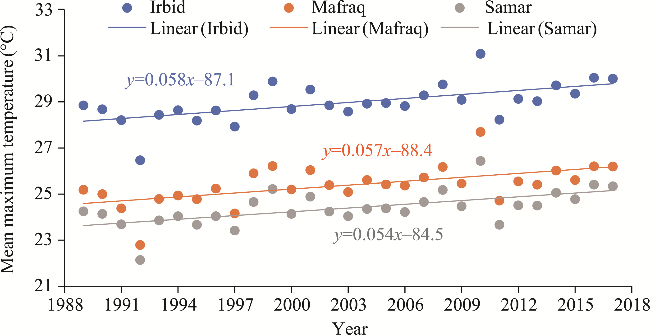
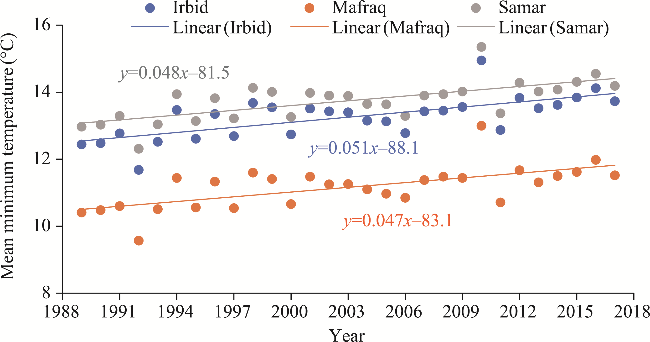
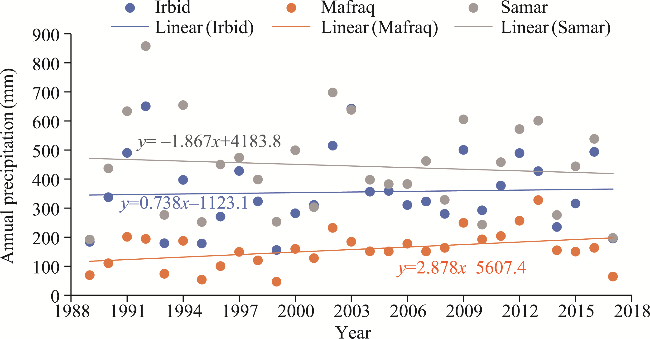
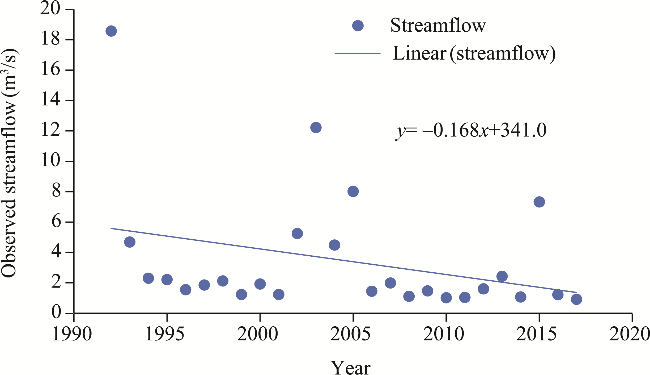
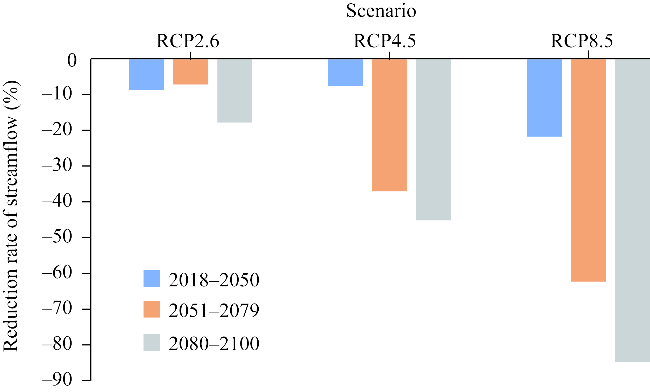
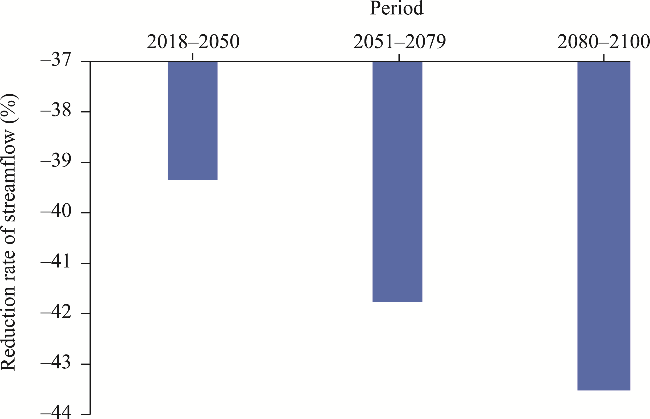
Understanding the impact of climate change on water resources is important for developing regional adaptive water management strategies. This study investigated the impact of climate change on water resources in the Yarmouk River Basin (YRB) of Jordan by analyzing the historical trends and future projections of temperature, precipitation, and streamflow. Simple linear regression was used to analyze temperature and precipitation trends from 1989 to 2017 at Irbid, Mafraq, and Samar stations. The Statistical Downscaling Model (SDSM) was applied to predict changes in temperature and precipitation from 2018 to 2100 under three Representative Concentration Pathway (RCP) scenarios (i.e., RCP2.6, RCP4.5, and RCP8.5), and the Soil and Water Assessment Tool (SWAT) was utilized to estimate their potential impact on streamflow at Addasiyia station. Analysis of data from 1989 to 2017 revealed that mean maximum and minimum temperatures increased at all stations, with average rises of 1.62°C and 1.39°C, respectively. The precipitation trends varied across all stations, showing a significant increase at Mafraq station, an insignificant increase at Irbid station, and an insignificant decrease at Samar station. Historical analysis of streamflow data revealed a decreasing trend with a slope of -0.168. Significant increases in both mean minimum and mean maximum temperatures across all stations suggested that evaporation is the dominant process within the basin, leading to reduced streamflow. Under the RCP scenarios, projections indicated that mean maximum temperatures will increase by 0.32°C to 1.52°C, while precipitation will decrease by 8.5% to 43.0% throughout the 21st century. Future streamflow projections indicated reductions in streamflow ranging from 8.7% to 84.8% over the same period. The mathematical model results showed a 39.4% reduction in streamflow by 2050, nearly double the SWAT model's estimate under RCP8.5 scenario. This research provides novel insights into the regional impact of climate change on water resources, emphasizing the urgent need to address these environmental challenges to ensure a sustainable water supply in Jordan.

Cite this article

Abdelaziz Q BASHABSHEH , Kamel K ALZBOON . Impact of climate change on water resources in the Yarmouk River Basin of Jordan[J]. Journal of Arid Land, 2024 , 16(12) : 1633 -1647 . DOI: 10.1007/s40333-024-0069-0

1 Introduction

Climate change has been observed at local, regional, and continental levels due to rising greenhouse gas (GHG) concentrations, particularly carbon dioxide (CO2) (IPCC, 2007). These changes manifest in various ways, including shifts in precipitation timing and volume, changes in wind patterns, and intensification of extreme weather events such as heatwaves, cold spells, floods, heavy rainfall, droughts, tornadoes, and tropical cyclones (IPCC, 2007, 2022). The average global temperature has been rising and is projected to continue increasing throughout the 21st century (IPCC, 2013). From 2015 to 2022, the average global temperature increased by at least 1.00°C compared to pre-industrial levels (WMO, 2023). The past eight consecutive years have been the warmest on record, with an increase of about 1.15°C in average global temperature compared to pre-industrial levels (WMO, 2023). Predicting precipitation patterns is more challenging than temperature due to significant spatial variability and heterogeneity (Cheng et al., 2021). Human activities that drive climate change pose serious global challenges to natural and human systems, threatening sustainable development and increasing risks for poorer and less developed regions. Persistent GHG emissions will lead to continued global warming and long-term changes across all climate system elements, raising the likelihood of severe, widespread, and enduring impacts on humans and ecosystems (IPCC, 2021).
Over the last 60 a, Jordan has experienced an annual increase in maximum temperatures by 0.30°C-1.80°C and minimum temperatures by 0.40°C-2.80°C. Average annual precipitation has decreased by 5.0%-20.0%, except in Ras Muneef of Jordan, where it increased by 5.0%-10.0% (USAID, 2017). At least three consecutive droughts have occurred in the past 40 a (Shatanawi et al., 2013), with both the frequency and severity of droughts intensifying over time (Hammouri and El-Naqa, 2007; Sada et al., 2015). The rise in evaporation and decrease in precipitation are expected to reduce groundwater and surface water recharge, diminishing the supply of water resources (MOENV and UNDP, 2014). Water scarcity, worsened by climate change, threatens all sectors in arid regions and hampers progress toward sustainable development (Al-Hasani et al., 2023).
Jordan, a small developing country, faces ongoing environmental challenges, including water scarcity, soil degradation, desertification, drought, extreme temperatures, and biodiversity decline. These issues create significant social, economic, and political security challenges (Al-Jaafreh and Nagy, 2018; Hussein et al., 2020). Jordan ranks as the world's second-poorest country in terms of water resources, with an annual per capita renewable water availability of less than 100.00 m3—far below the absolute water scarcity threshold of 500.00 m3 (Alzboon et al., 2021; Alqatarneh and Al-Zboon, 2022). The country's primary water sources are shared with neighboring countries, creating a precarious situation that is further strained by regional instability. As a result, Jordan's water allocation has decreased over time. One of Jordan's three principal rivers, the Yarmouk River, contributes 50.0% of the country's surface water resources. In the 1950s, the Yarmouk River's mean annual flow was estimated at 4.50×10⁸-5.00×10⁸ m3. However, this flow has significantly decreased to just 0.83×10⁸-0.99×10⁸ m3 in recent years (ESCWA, 2013; Al-Kharabsheh, 2020). Meanwhile, water scarcity remains a major challenge. Rapid population growth, economic sector expansion, a high rate of non-revenue water, limited energy sources, and the impacts of climate change on precipitation are all worsening water deficits. These factors place added strain on Jordan's limited water resources and make the country highly vulnerable to drought (MWI, 2020; MOENV, 2021; UNICEF, 2022). The Yarmouk River Basin (YRB) faces significant water supply challenges, as demand amounts greatly exceed available resources, placing increased pressure on domestic water supplies. This issue is exacerbated by the inability of water resource systems to withstand disruptions from climate change, drought, and sudden population increases, which have further strained available resources (Shammout et al., 2023a). During 1997-2017, the basin's population doubled from 0.64×10⁶ to 1.53×10⁶, leading to a substantial increase in total water use despite a decline in per capita availability. An Autoregressive Integrated Moving Average (ARIMA) model forecasts a 2.0% annual increase in domestic water use, with a 15.0% rise expected by 2030, presenting a major challenge for future water supplies (Shammout et al., 2023b).
The YRB has experienced a significant decline in precipitation since 1992, leading to reduced annual streamflow. This decline has been exacerbated by high evaporation rates due to climatic factors and rapid population growth (Al-Kharabsheh, 2022). The Water Evaluation and Planning Model (WEAP) was utilized to investigate the effect of global warming on hydrological systems in the YRB. The analyses indicated that streamflow in the YRB is expected to decrease significantly, with a reduction of up to 30.0% projected under most climate change scenarios (MOENV and UNDP, 2009). Hammouri et al. (2017) studied the impact of climate change on water resources in northern Jordan to assess future changes in water availability. Their results suggested that streamflow is expected to decrease by 22.0% by 2080, leading to an increase in water deficit in Jordan. Abdulla and Al-Shurafat (2020) also predicted that the streamflow of Yarmouk River would likely decrease by 36.4% by the end of the 21st century under post-development conditions. Al Sabeh et al. (2022) found that the growth of agriculture and population has led to significant water shortages in the YRB. Under the Representative Concentration Pathway (RCP) scenarios (RCP4.5 and RCP8.5), both surface water availability and dam retention have significantly decreased, with Jordan's share of the Yarmouk River being the most affected.
The primary focus of this study is to assess the impact of climate change on water resources in the YRB. Although a few studies have examined the impact of climate change on the water resources of the Yarmouk River, they did not determine the significance of past changes or the reasons behind them. This study aims to provide a comprehensive and contemporary analysis of climate change in the YRB, utilizing accurate and recent data. The impact of climate change over the past few decades was assessed by analyzing changes in temperature and precipitation. Future projections were conducted to estimate the potential impact of climate change on the streamflow of the Yarmouk River under climate change scenarios from the second-generation Canadian Earth System Model (CanESM2) Global Climate Models (GCMs) using the Statistical Downscaling Model (SDSM) and Soil and Water Assessment Tool (SWAT) model. Additionally, a mathematical model that links streamflow and evapotranspiration was employed to reduce uncertainty in the modeling and downscaling processes. The results of this research will provide decision-makers with the necessary data regarding climate change in the YRB, which will be crucial for addressing water budget and environmental planning.

2 Materials and methods

2.1 Study area

The YRB (Fig. 1) is located in the northern region of Jordan and extends to the Syrian territory. The basin covers an area of approximately 7000 km2. The study area focused on the Jordanian side constituting 21.0% of the total basin area. The Yarmouk River is the largest tributary of the Jordan River. The main tributaries of the Yarmouk River include the seasonal streams in Syria: Zeidi, Dahab, Harir, Ruqqad, and Allan. The perennial Yarmouk River is approximately 57 km long, with 47 km located within the Syrian territory. It runs along the border between Jordan and Syria (ESCWA, 2015). The climate in the YRB is characterized as semi-arid, featuring hot, dry summers and cold, wet winters. Annual precipitation on the Jordanian side of the basin varies, ranging from 600 mm in the western parts to less than 150 mm in the eastern parts (Al-Bakri et al., 2016).
Fig. 1 Overview of the Yarmouk River Basin (YRB) and the locations of meteorological stations, rainfall stations, and streamflow gauge station

2.2 Data sources

To study the effects of global warming on temperature, precipitation, and streamflow, we collected data from three meteorological stations (Irbid, Mafraq, and Samar), three rainfall stations (Hawwara, Hosha, and Samar), and one streamflow gauge station (Addasyia) within the basin. These data, obtained from the Ministry of Water and Irrigation (MWI), covered a 29-a period (1989-2017). The collected variables included daily minimum and maximum temperatures (°C), relative humidity (%), and wind speed (m/s) from meteorological stations, daily precipitation (mm) from rainfall stations, and streamflow (m3/s) from the streamflow gauge station. For clarity, the names of certain stations were referenced by their governorate names in this study. Specifically, the Hosha station, located within the Mafraq Governorate, was referred to as Mafraq, and the Hawwara station, within the Irbid Governorate, was referred to as Irbid due to their proximity to the respective governorate centers.
The YRB was delineated using a one arc-second (30 m) resolution digital elevation model (DEM) obtained from the Shuttle Radar Topography Mission (SRTM). Two-degree tiles covering the study area were downloaded from the USGS Earth Explorer website (http://earthexplorer.usgs.gov/). The DEM was projected to the WGS World Mercator (EPSG: 3857) coordinate system, and this projected DEM was then used to delineate the basin using the ArcSWAT 2012 tool within the ArcGIS program.
Land cover information for the YRB was extracted from the 10 m Sentinel-2 land cover dataset for the year 2021, which was produced by the Impact Observatory, Microsoft, and Esri (https://www.arcgis.com/apps/mapviewer/index.html?layers=d3da5dd386d140cf93fc9ecbf8da5e31).
The soil map for the study area was obtained from the Digital Soil Map of the World, version 3.6, created by the Food and Agriculture Organization of the United Nations (FAO). This digital soil map has a coarse scale of 1:5,000,000 and can be downloaded from the FAO GeoNetwork website (http://www.fao.org/geonetwork/srv/en/metadata.show?id=14116).

2.3 Data quality control

Homogeneity refers to the consistency of a data series and the extent to which the data vary, specifically regarding whether they are influenced solely by climatic factors. It is important to note that most long-term climatic time series are affected by various non-climatic factors, which can distort the actual climatic data.
Pettitt's test (Pettitt, 1979), Standard Normal Homogeneity Test (SNHT) (Alexandersson, 1986), and von Neumann's test (Von Neumann, 1941) were used in this study to check the homogeneity of meteorological and hydrological data. Pettitt's test was used to determine the time when a significant change or break occurred in the time series. SNHT was used to assess the possibility of a significant change in the arithmetic mean of data between years. Von Neumann's test was used to indicate any noticeable change and break in the time series, but not the year of the change. The software XLSTAT was used to execute tests for the time series at a significance level of 0.05. The test explanation includes a null hypothesis (H0) of homogeneous data, while the alternative hypothesis (Ha) indicates nonhomogeneous data (the data changed on a specific date). If P<0.05, then H0 is rejected and Ha is accepted. If P>0.05, then H0 is accepted.

2.4 Trend analysis

Simple linear regression was used to analyze the temperature and precipitation data after the data homogeneity tests. The significance of the trend was tested at a 95% confidence interval. A significant trend would be recognized if P<0.05.

2.5 Climate change scenarios

Climatic variable downscaling was performed using a statistical downscaling method. Daily data for temperature and precipitation were used to conduct the statistical downscaling in the SDSM. The SDSM employs a statistical technique known as the multiple regression method to analyze the relationship between large-scale predictors provided by GCM simulations and the daily climatic data at local sites (predictands). This study used the CanESM2 GCMs, which produce climate change scenarios based on the GHG RCPs. Three RCPs (RCP2.6, RCP4.5, and RCP8.5) were considered in this study. RCP2.6 is the most stringent scenario, requiring major emissions reductions to keep global temperature increase below 2.00°C, with radiative forcing of 2.6 W/m2. RCP4.5 is a moderate scenario, projecting a global temperature increase of around 2.00°C by 2100, with radiative forcing of 4.5 W/m2. RCP8.5 is the highest emissions scenario, predicting a global temperature rise that could exceed 4.00°C by 2100, with radiative forcing of 8.5 W/m2. All these changes are compared to the pre-industrial era. The arithmetic means of the temperature values and the Thiessen polygon for precipitation were calculated to represent the generated scenarios over the entire basin.

2.6 Hydrological modeling

The SWAT model is the culmination of nearly three decades of modeling experience by the United States Department of Agriculture Agricultural Research Service (USDA-ARS) and was developed in the 1990s (Gassman et al., 2007; Williams et al., 2008). The model has proven valuable in arid regions, even in the face of limited data and extreme conditions. Previous research on the YRB demonstrated the high capability of SWAT to simulate streamflow (Hammouri et al., 2011; Abu-Zreig and Hani, 2021), highlighting its importance for achieving accurate results. For this study, ArcSWAT 2012 was employed among several graphical user interfaces for SWAT to simulate hydrological processes in the basin, including streamflow, runoff, and evapotranspiration. The hydrological modeling was conducted for the period 1989-2017. The data used in the SWAT model included DEM, land cover map, soil map, daily maximum and minimum temperatures (required), daily precipitation (required), daily relative humidity, and daily wind speed data. The model was calibrated and validated to achieve accurate results and reduce the uncertainty of forecasting (Refsgaard, 1997). After demonstrating accuracy in simulating streamflow by closely matching observed streamflow values, the model was utilized to project future streamflow under the RCP scenarios.

2.7 Mathematical model

A mathematical model was developed to evaluate the impact of climate change on streamflow and compare its results with those of the SWAT model under various RCP scenarios. This approach aims to reduce uncertainty, enhance accuracy, and approximate the most likely future scenarios. To derive the relationship applicable for streamflow prediction, numerous trials were conducted to link streamflow with evapotranspiration and precipitation. The results indicated that streamflow is better represented by evapotranspiration than by precipitation, primarily because evapotranspiration dominates the hydrological cycle in the YRB. The relationship between streamflow and evapotranspiration was well represented by a power equation that demonstrated superior performance compared to other types of equations. A dataset comprising 180 monthly streamflow and potential evapotranspiration data pairs was selected to establish the mathematical model, and 21 monthly streamflow data points were used to assess the performance of the mathematical model. The equation is as follows:
$Q=36.275\times \text{PE}{{\text{T}}^{(0.685)}}$,
where Q is the monthly streamflow (m3/s); and PET is the monthly potential evapotranspiration (mm).
The PET was calculated using Hargreaves equation (Hargreaves and Samani, 1985), which is a simple evapotranspiration model represented by a simple equation requiring only four accessible variables. The Hargreaves method is recommended by the FAO (Allen et al., 1998), and the equation is as follows:
$\text{PET}=0.0023\times {{R}_{a}}\times {{({{T}_{\max }}-{{T}_{\min }})}^{0.5}}\times ({{T}_{\text{mean}}}+17.8)$,
where Ra is the mean extra terrestrial radiation (mm/d), which is a function of latitude; Tmax is the maximum temperature (°C); Tmin is the minimum temperature (°C); and Tmean is the temperature arithmetic mean (°C).

3 Results and discussion

3.1 Homogeneity tests for the meteorological and hydrological data

The data are considered acceptable if they pass two of the three tests. The results of the homogeneity tests for the precipitation data series are illustrated in Table 1. The data from Irbid, Mafraq, and Samar stations passed the SNHT; however, Mafraq's data failed the von Neumann's test, and Samar's data failed the Pettitt's test. This indicated that all precipitation data series were acceptable and can be used for trend analysis and modeling. For the temperature data, both Irbid and Mafraq stations passed all tests according to the previously noted conditions. Therefore, their data series were acceptable and can be utilized in trend analysis and modeling. In contrast, Samar's temperature data failed two tests: Pettitt's test and von Neumann's test, making the data series from the Samar station unacceptable and necessitating appropriate corrections (Table 2).
Table 1 Homogeneity test results for annual precipitation data series
Station name Pettitt's test SNHT Von Neumann's test
α P-value Check α P-value Check α P-value Check
Irbid 0.05 0.944 OK 0.05 0.874 OK 0.05 0.341 OK
Mafraq 0.05 0.066 OK 0.05 0.138 OK 0.05 0.032 NOT OK
Samar 0.05 0.033 NOT OK 0.05 0.739 OK 0.05 0.743 OK

Note: SNHT, Standard Normal Homogeneity Test; α, significance level; P-value, probability value.

Table 2 Homogeneity test results for annual mean temperature data series
Station Name Pettitt's test SNHT Von Neumann's test
α P-value Check α P-value Check α P-value Check
Irbid 0.05 0.069 OK 0.05 0.176 OK 0.05 0.415 OK
Mafraq 0.05 0.099 OK 0.05 0.261 OK 0.05 0.723 OK
Samar 0.05 0.006 NOT OK 0.05 0.115 OK 0.05 0.022 NOT OK
The linear regression model was used to correct Samar's temperature data. Irbid's temperature data were selected as the reference data because its statistical mean and standard deviation were very close to those of Samar's data, reflecting the temperature variation in Samar. The correlation coefficient for maximum temperature regression was 0.952, while for minimum temperature regression, it was 0.935. The coefficient of determination (R2) for the maximum temperature linear regression was 0.907, and for the minimum temperature linear regression, it was 0.873. These values indicated a strong correlation and sufficient reliability for replacing the inhomogeneous data series with the corrected ones. The performance of the model was assessed through a visual examination of the graph depicting the residuals over time and by calculating the arithmetic mean of the residuals. The results indicated that the residuals fluctuated randomly around the zero line, with the arithmetic mean equaling zero. This suggested that the model is suitable for the data, and the newly corrected data series can be analyzed and studied.
The streamflow data series from the Addasyia station passed all the tests (Table 3). Based on these results and the previously noted conditions, the data from the Addasyia station were considered homogeneous.
Table 3 Homogeneity test results for streamflow data series
Station name Pettitt's test SNHT Von Neumann's test
α P-value Check α P-value Check α P-value Check
Addasiyia 0.05 0.227 OK 0.05 0.699 OK 0.05 0.16 OK

3.2 Trend analysis of the temperature and precipitation data during 1989-2017

The mean maximum temperature across all stations exhibited a significant increasing trend at a 95% confidence interval, with an average slope of 0.056. Additionally, the mean minimum temperature also showed a significant increasing trend at the same confidence interval, with an average slope of 0.048. Figures 2 and 3 present the trends for mean maximum temperature and mean minimum temperature during the study period (1989-2017). The mean maximum temperature increased significantly by 1.62°C, while a significant increase of 1.39°C was observed for the mean minimum temperature. These findings corroborate the results of a previous study (USAID, 2017), which concluded that annual maximum temperatures in Jordan increased by 0.30°C-1.80°C over the past 60 a, and annual minimum temperatures rose by 0.40°C-2.80°C.
Fig. 2 Trend of mean maximum temperature at Irbid, Mafraq, and Samar stations during 1989-2017
Fig. 3 Trend of mean minimum temperature at Irbid, Mafraq, and Samar stations during 1989-2017
Annual precipitation exhibited a significant increasing trend at Mafraq station, with a slope of 2.878 (Fig. 4). In contrast, precipitation at Irbid station showed an insignificant increasing trend with a slope of 0.738, while precipitation at Samar station displayed an insignificant decreasing trend with a slope of -1.867.
Fig. 4 Trend of annual precipitation at Irbid, Mafraq, and Samar stations during 1989-2017

3.3 Future projections of the temperature and precipitation changes under climate change scenarios

The SDSM demonstrated high performance in modeling the arid climate of the basin. The results were divided into three periods: 2018-2050, 2051-2079, and 2080-2100. The observed period 1989-2017 served as the baseline for calculating changes in temperature and precipitation. Table 4 summarizes the changes in temperature and precipitation according to the projected scenarios (RCP2.6, RCP4.5, and RCP8.5). The decrease in precipitation ranged from -8.5% to -43.2%, while the increase in temperature ranged from 0.32°C to 1.52°C. The increase in temperature is attributed to high emissions of GHG (primarily CO2, CH4, and N2O), which have increased the trapped heat in the atmosphere and caused the land to warm (IPCC, 2021). Higher temperatures raise the evaporation rate and decrease soil humidity, thereby enhancing the desertification process. RCP8.5 represents the worst-case scenario for climate change, with GHG emissions continuing to rise. In contrast, RCP4.5 suggests that GHG emissions will peak in 2040, then decline, with CO2 emissions decreasing by 2045 and reaching about 50.0% of the 2045 level by 2100. These hypotheses can explain the greater changes in temperature and precipitation projected under RCP8.5 compared to the other RCPs.
Table 4 Projected changes in temperature and precipitation under RCP2.6, RCP4.5, and RCP8.5 scenarios for different future periods
Period RCP2.6 RCP4.5 RCP8.5
Temperature change (°C) Rate of change in precipitation (%) Temperature change (°C) Rate of change in precipitation (%) Temperature change (°C) Rate of change in precipitation (%)
2018-2050 0.32 -8.5 0.37 -10.3 0.44 -12.3
2051-2079 0.42 -10.7 0.61 -18.7 0.10 -29.6
2080-2100 0.42 -11.4 0.73 -21.6 1.52 -43.2

Note: RCP, Representative Concentration Pathway.

3.4 Hydrological modeling and streamflow simulation

The streamflow data spanned 29 a (1989-2017), with three missing years (2002-2004). The total streamflow records used comprised 26 a, which were divided into three periods: model warm-up period (1989-1991), calibration period (1992-2008), and validation period (2009-2017). The simulated streamflow was calibrated manually by adjusting the input parameter values to ensure that the simulated streamflow values fell within a specific range of the observed data (Balascio et al., 1998). These input parameters affect multiple processes, making it essential to determine the most sensitive parameters before initiating the calibration and validation processes (Arnold et al., 2012). Table 5 presents the most sensitive parameters used in the model calibration process. These parameters and their values were selected based on a sensitivity analysis informed by experience, data availability, relevant literature, and local sensitivity tests of the candidate parameters (Feyereisen et al., 2007; Arnold et al., 2012; Abbaspour et al., 2015). The selection was also guided by previous studies on hydrological modeling in the YRB conducted by Hammouri et al. (2011) and Abu-Zreig and Hani (2021).
Table 5 Parameters used in the SWAT model calibration
Parameter Definition Unit Estimated value Calibrated value Range
CN2 Curve number - 83 76 0-100
Sol_Awc Available water capacity of the soil layer mmH2O/mm soil 0.10 0.13 -
Gw_Delay Groundwater delay time d 310 450 -
ESCO Soil evaporation compensation factor - 0.95 0.75 0.00-1.00
Sol_K Saturated hydraulic conductivity mm/h 3.0 11.5 0.0-100.0
Sol_Z Depth from soil surface to bottom of layer mm 300 1100 0-2000

Note: "-" means no unit or data range.

Santhi et al. (2001) stated that acceptable model performance requires a R2 value greater than 0.600, a Nash-Sutcliffe Efficiency (NSE) value greater than 0.500, and a Percent Bias (PBIAS) value less than 15.0%. For the calibrated and validated periods, the R2 and NSE values exceeded 0.600 and 0.500, respectively, while the PBIAS values were less than 15.0%, as shown in Table 6. This indicated that the model was accepted and calibrated, making it suitable for providing data and forecasting future streamflow. Figure 5 presents the total monthly observed and simulated streamflow for the calibration and validation periods, illustrating good agreement between the observed and simulated streamflow.
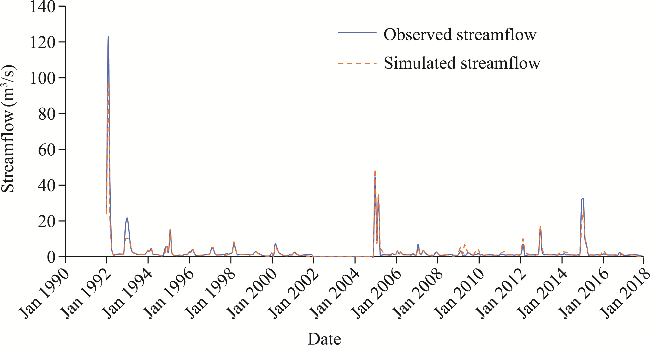
Table 6 Summary of the objective functions in streamflow simulation during the calibration and validation periods
Objective function Calibration (1992-2008) Validation (2009-2017)
R2 0.964 0.863
NSE 0.936 0.834
PBIAS (%) 9.7 12.6
Simulated mean (m3/s) 3.242 2.271
Observed mean (m3/s) 3.594 2.023
Observed Std Dev (m3/s) 11.022 4.524
Simulated Std Dev (m3/s) 9.111 3.494

Note: R2, coefficient of determination; NSE, Nash-Sutcliffe Efficiency; PBIAS, Percent Bias; Std Dev, standard deviation.

Fig. 5 Observed monthly streamflow versus simulated streamflow during 1992-2017

3.5 Future prediction of the impact of climate change on water resources

The historical analysis of streamflow data revealed a decreasing trend with a slope of -0.168 (Fig. 6). In contrast, precipitation over the same time frame indicated a significant increasing trend at Mafraq station and an insignificant increasing trend at Irbid station. This phenomenon can be explained by the results of the temperature data analysis, which showed significant rising trends in both mean minimum and mean maximum temperatures across all stations. The findings suggested that the dominant process within the basin is evaporation, which plays a pivotal role in reducing streamflow throughout the area.
Fig. 6 Temporal variations in observed streamflow during 1989-2017
To predict future changes in streamflow, the RCP scenarios downscaled from CanESM2 GCMs were applied to the SWAT model to simulate streamflow in the future and calculate the changes compared to the simulated streamflow during the observed period (1989-2017). The SWAT prediction results indicated a reduction in streamflow during all future study periods, with the reduction percentage varying between 8.7% and 84.8%. The RCP2.6 scenario predicts a decrease in streamflow of 8.7% during 2018-2050, 7.1% during 2051-2079, and 17.8% during 2080-2100, as shown in Figure 7. The RCP4.5 scenario predicts a decrease in streamflow of 7.6% during 2018-2050, 37.0% during 2051-2079, and 45.1% during 2080-2100. The RCP8.5 scenario predicts a decrease in streamflow of 21.7% during 2018-2050, 62.3% during 2051-2079, and 84.8% during 2080-2100. The temperature is expected to rise in the coming decades due to the impacts of GHG and heat trapped in the atmosphere. Increased evaporation from soil and surface water caused by higher temperatures will lead to a decline in the groundwater table and a reduction in the water available in river tributaries. Additionally, higher temperatures and lower precipitation will decrease groundwater recharge, which will further reduce the amount of water feeding the rivers. By the end of this century, temperatures are projected to increase by 1.00°C, 1.80°C, and 3.70°C under RCP2.6, RCP4.5, and RCP8.5 scenarios, respectively, compared to the observed period (1989-2017). The greater impact of the RCP8.5 scenario on water resources in the study area is attributed to the larger temperature increase associated with this scenario, whereas the RCP2.6 scenario has the least impact.
Fig. 7 Predicted changes of the simulated streamflow under RCP2.6, RCP4.5, and RCP8.5 scenarios for different future periods
The RCP scenarios predict a decline in precipitation by the end of the 21st century. However, analysis of observed precipitation data from 1989 to 2017 revealed a significant increase at the Mafraq station, an insignificant increase at Irbid station, and an insignificant decrease at Samar station. In contrast, streamflow analysis for the same period showed a declining trend. This suggested that the decrease in streamflow was not caused by precipitation but rather by evaporation. To reduce uncertainty and obtain more accurate results, a mathematical model was employed to identify the scenario closest to reality. The performance of the mathematical model is presented in Table 7.
Table 7 Performance evaluation of the mathematical model for monthly streamflow predictions during 1989-2017
Number Observed streamflow (m3/s) Simulated streamflow (m3/s) Error (m3/s)
1 1.021 1.036 -0.015
2 1.036 0.987 0.049
3 1.020 1.008 0.012
4 1.003 1.235 -0.232
5 0.927 1.174 -0.247
6 1.001 1.089 -0.088
7 0.995 0.967 0.028
8 1.007 1.080 -0.073
9 1.000 0.983 0.017
10 1.000 0.980 0.020
11 0.968 1.316 -0.348
12 1.000 1.071 -0.071
13 0.979 0.984 -0.005
14 0.970 0.997 -0.027
15 0.968 1.062 -0.094
16 0.980 1.258 -0.278
17 1.001 1.089 -0.088
18 3.013 2.367 0.646
19 0.983 1.040 -0.057
20 0.999 1.026 -0.027
21 0.968 1.059 -0.091
The streamflow was simulated for three future periods: 2018-2050, 2051-2079, and 2080-2100. The mathematical model predicts a decrease in streamflow of 39.4% during 2018-2050, 41.8% during 2051-2079, and 43.5% during 2080-2100, all compared with the observed period (1989-2017), as shown in Figure 8. When comparing the outcomes of the mathematical model with those of the SWAT model, a notable disparity emerged. The mathematical model predicts a substantial reduction in streamflow during the period 2018-2050, projecting a 39.4% decline. This prediction is nearly double that of the SWAT model under the very high GHG emission scenario (RCP8.5), which estimates a 22.0% decrease. However, the situation changes in the subsequent periods of 2051-2079 and 2080-2100. In these periods, the very high GHG emission scenario (RCP8.5) anticipates a far more significant decline in streamflow of 62.3% and 84.5%, respectively. These values contrast with the mathematical model's projections of 41.8% and 43.5% reductions for the same time frames.
Fig. 8 Predicted changes of the streamflow using the mathematical model for different future periods
The variance in results between the two models across the three periods arises from the mathematical model's limitations in predicting the distant future. It assumes a constant rate of change over time, while the high GHG emission scenario posits that the rate of change will accelerate, particularly around 2030. Consequently, the effective comparison hinges on assessing the initial period of both models, suggesting that the basin's situation likely aligns with a high GHG emission scenario or potentially an even more dire one. It is crucial to emphasize that these results are not definitive, as climate studies involve numerous sources of uncertainty. Nevertheless, this study can serve as a vital indicator of the impact of climate change on Yarmouk River flow, especially considering the significant decrease observed in streamflow over the past decade compared to the 1990s.
The results of this study align with findings from previous research, although some notable differences arise due to variations in methodologies and focus areas. For instance, Al Sabeh et al. (2022) investigated water sustainability under current use and allocation regimes in the YRB using the WEAP tool. Their study highlighted significant water shortages across all demand sectors, exacerbated by climate change under RCP4.5 and RCP8.5 scenarios. Similar to the present study, Al Sabeh et al. (2022) found that surface water availability was significantly reduced, with Jordan's share from the Yarmouk River being particularly vulnerable. Both studies emphasize the urgent need for adaptive water management strategies to address these projected shortages. Abdulla and Al-Shurafat (2020) used the SWAT model to simulate the hydrological response of the YRB under various climate change scenarios. They reported that streamflow reductions ranged from 2.6% to 60.0% under pre-development conditions and from 0.0% to 36.4% under post-development conditions, depending on the scenario applied. These findings align with the projections in the present study, which show streamflow reductions ranging from 8.7% to 84.8% under different RCP scenarios throughout the 21st century. Both studies highlight the YRB's vulnerability to climate change, particularly in terms of streamflow and water availability. Similarly, Hammouri et al. (2017) used the SWAT model to assess the impact of climate change on water resources in northern Jordan, projecting streamflow reductions of up to 22.0% by 2080, with severe declines during peak flow months. Although these projections are somewhat more conservative than those in the current study, the differences may be attributed to the use of different GCMs and scenarios. Nevertheless, all studies agree on the anticipated decline in water resources due to climate change, reinforcing the need for updated and robust water management policies.

4 Conclusions

This study analyzed historical meteorological and hydrological data, along with future projections, to thoroughly assess the impact of climate change on water resources in the YRB. The findings revealed significant increases in both mean maximum and minimum temperatures at all stations, suggesting that evaporation is the dominant process within the basin, leading to reduced streamflow. Precipitation showed a significant increase at Mafraq station, while it experienced insignificant changes at Irbid and Samar stations, highlighting the variability within the basin. The historical analysis of streamflow data indicated a decreasing trend with a slope of -0.168, suggesting that despite some areas experiencing increased precipitation, the overall streamflow was declining due to higher evaporation rates. Using RCP scenarios, the study projected temperature increases ranging from 0.32°C to 1.52°C and precipitation decreases of 8.5% to 43.0% throughout the 21st century. The SWAT model and mathematical projections indicated significant future reductions in streamflow. The disparity between the SWAT model and mathematical model projections for future streamflow reduction underscores the importance of considering different modeling approaches to understand the potential range of climate change impacts. These findings provide novel insights into the regional impact of climate change and highlight the critical need for adaptive water management strategies to mitigate the adverse effects of climate change on water resources in the YRB. Climate change should be considered in all water strategies and accounted for in the water budget in Jordan.
This study encountered several limitations that may have influenced the results and need to be improved in future studies. Firstly, it was constrained by the limited availability of long-term, high-quality hydrological and meteorological data. Secondly, a single land use map was employed across all study periods because the future land use remains uncertain. Thirdly, during the SWAT modeling process, solar radiation data were sourced from the SWAT database due to the unavailability of specific local data. Finally, the reliance on GCM projections under climate change scenarios introduces inherent uncertainties due to the complexities associated with climate modeling.

Conflict of interest

The authors declare that they have no known competing financial interests or personal relationships that could have appeared to influence the work reported in this paper.

Acknowledgements

Special thanks to Al-Balqa' Applied University, Jordan for making this work possible.

Author contributions

Abdelaziz Q BASHABSHEH prepared the data, conducted modeling and analysis, and shaped the manuscript. Kamel K ALZBOON supervised the project, conceived the ideas, planned the research, and facilitated the discussion of the results. All authors approved the manuscript.
Open Access This article is licensed under a Creative Commons Attribution 4.0 International License, which permits use, sharing, adaptation, distribution and reproduction in any medium or format, as long as you give appropriate credit to the original author(s) and the source, provide a link to the Creative Commons licence, and indicate if changes were made. The images or other third party material in this article are included in the article's Creative Commons licence, unless indicated otherwise in a credit line to the material. If material is not included in the article's Creative Commons licence and your intended use is not permitted by statutory regulation or exceeds the permitted use, you will need to obtain permission directly from the copyright holder. To view a copy of this licence, visit http://creativecommons.org/licenses/by/4.0/.
[1]
Abbaspour K C, Rouholahnejad E, Vaghefi S, et al. 2015. A continental-scale hydrology and water quality model for Europe: Calibration and uncertainty of a high-resolution large-scale SWAT model. Journal of Hydrology, 524: 733-752.

[2]
Abdulla F, Al-Shurafat A W. 2020. Assessment of the impact of potential climate change on the surface water of a trans-boundary basin: Case study Yarmouk River. Procedia Manufacturing, 44: 172-179.

[3]
Abu-Zreig M, Hani L B. 2021. Assessment of the SWAT model in simulating watersheds in arid regions: Case study of the Yarmouk River Basin (Jordan). Open Geosciences, 13(1): 377-389.

[4]
Al-Bakri J T, Shawash S, Ghanim A, et al. 2016. Geospatial techniques for improved water management in Jordan. Water, 8(4): 132, doi: 10.3390/w8040132.

[5]
Al-Hasani I, Al-Qinna M, Hammouri N A. 2023. Potential impacts of climate change on surface water resources in arid regions using downscaled regional circulation model and soil water assessment tool, a case study of Amman-Zerqa Basin, Jordan. Climate, 11(3): 51, doi: 10.3390/cli11030051.

[6]
Al-Jaafreh O, Nagy I. 2018. The environmental challenges, problems, and management: A case study of Jordan. Zbornik Radova Departmana za Geografiju, Turizam i Hotelijerstvo, (47-1): 53-70.

[7]
Al-Kharabsheh A. 2020. Challenges to sustainable water management in Jordan. Jordan Journal of Earth & Environmental Sciences, 11(1): 38-48.

[8]
Al-Kharabsheh N M. 2022. Assessment of water resources in Yarmouk River Basin using geospatial technique during the period 1980-2020. Journal of Arid Land, 14(2): 154-166.

[9]
Al Sabeh H, Abdallah C, Merheb M, et al. 2022. Scenario simulation and analysis in the transboundary Yarmouk River basin using a WEAP model. International Journal of River Basin Management, 22(2): 217-238.

[10]
Alexandersson H. 1986. A homogeneity test applied to precipitation data. Journal of Climatology, 6(6): 661-675.

[11]
Allen R G, Pereira L S, Raes D, et al. 1998. Crop evapotranspiration—Guidelines for computing crop water requirements. FAO Irrigation and Drainage Paper 56. FAO, Rome, Italy.

[12]
Alqatarneh G, Al-Zboon K K. 2022. Water Poverty Index: a tool for water resources management in Jordan. Water, Air, & Soil Pollution, 233(11): 461, doi: 10.1007/s11270-022-05892-3.

[13]
Alzboon K K, La'aly A, Alrawashdeh K A B. 2021. Climate change indicators in Jordan: A new approach using area method. Jordan Journal of Civil Engineering, 15(1).

[14]
Arnold J G, Moriasi D N, Gassman P W, et al. 2012. SWAT: Model use, calibration, and validation. Transactions of the ASABE, 55(4): 1491-1508.

[15]
Balascio C C, Palmeri D J, Gao H. 1998. Use of a genetic algorithm and multiobjective programming for calibration of a hydrologic model. Transactions of the ASAE, 41(3): 615-619.

[16]
Cheng Q P, Zhong F L, Wang P. 2021. Potential linkages of extreme climate events with vegetation and large-scale circulation indices in an endorheic river basin in northwest China. Atmospheric Research, 247: 105256, doi: 10.1016/j.atmosres.2020.105256.

[17]
ESCWA (Economic and Social Commission for Western Asia). 2013. Inventory of Shared Water Resources in Western Asia. United Nations Economic and Social Commission for Western Asia. [2024-01-06]. https://www.unescwa.org/sites/default/files/pubs/pdf/e_escwa_sdpd_13_inventory_e.pdf.

[18]
ESCWA. 2015. Yarmouk River. United Nations Economic and Social Commission for Western Asia. [2023-12-30]. https://archive.unescwa.org/yarmouk-river.

[19]
Feyereisen G W, Strickland T C, Bosch D D, et al. 2007. Evaluation of SWAT manual calibration and input parameter sensitivity in the Little River watershed. Transactions of the ASABE, 50(3): 843-855.

[20]
Gassman P W, Reyes M R, Green C H, et al. 2007. The soil and water assessment tool: historical development, applications, and future research directions. Transactions of the ASABE, 50(4): 1211-1250.

[21]
Hammouri N, El-Naqa A. 2007. Drought assessment using GIS and remote sensing in Amman-Zarqa basin, Jordan. Jordan Journal of Civil Engineering, 1(2): 142-152.

[22]
Hammouri N, Adamowski J, Freiwan M, et al. 2011. Using SWAT to assess the impacts of climate change on the water resources of North Jordan. Inter-Islamic Network on Space Sciences & Technology (ISNET), Royal Jordanian Geographic Centre (RJGC), 65-72.

[23]
Hammouri N, Adamowski J, Freiwan M, et al. 2017. Climate change impacts on surface water resources in arid and semi-arid regions: A case study in northern Jordan. Acta Geodaetica et Geophysica, 52: 141-156.

[24]
Hargreaves G H, Samani Z A. 1985. Reference crop evapotranspiration from temperature. Applied Engineering in Agriculture, 1(2): 96-99.

[25]
Hussein H, Natta A, Yehya A A K, et al. 2020. Syrian refugees, water scarcity, and dynamic policies: How do the new refugee discourses impact water governance debates in Lebanon and Jordan? Water, 12(2): 325, doi: 10.3390/w12020325.

[26]
IPCC (Intergovernmental Panel on Climate Change). 2007. Climate Change 2007:The Physical Science Basis. Contribution of Working Group I to the Fourth Assessment Report of the Intergovernmental Panel on Climate Change. Cambridge, UK and New York, NY, USA: Cambridge University Press.

[27]
IPCC. 2013. Climate Change 2013:The Physical Science Basis. Contribution of Working Group I to the Fifth Assessment Report of the Intergovernmental Panel on Climate Change. Cambridge, UK and New York, NY, USA: Cambridge University Press.

[28]
IPCC. 2021. Summary for policymakers. In: Climate Change:The Physical Science Basis. Contribution of Working Group I to the Sixth Assessment Report of the Intergovernmental Panel on Climate Change. Cambridge, UK and New York, NY, USA: Cambridge University Press, 3-32.

[29]
IPCC. 2022. Climate Change 2022:Impacts, Adaptation, and Vulnerability. Contribution of Working Group II to the Sixth Assessment Report of the Intergovernmental Panel on Climate Change. Cambridge, UK and New York, NY, USA: Cambridge University Press.

[30]
MOENV (Ministry of Environment), UNDP (United Nations Development Programme). 2009. Jordan's Second National Communication to the United Nations Framework Convention on Climate Change (UNFCCC). [2024-01-05]. https://unfccc.int/sites/default/files/resource/Jordan%20SNC.pdf.

[31]
MOENV, UNDP. 2014. Jordan's Third National Communication on Climate Change. [2023-12-01]. https://www.undp.org/arab-states/publications/jordans-third-national-communication-climate-change.

[32]
MOENV. 2021. The National Climate Change Adaptation Plan of Jordan. [2024-03-13]. https://www.moenv.gov.jo/ebv4.0/root_storage/ar/eb_list_page/final_draft_nap-2021.pdf.

[33]
MWI (Ministry of Water and Irrigation). 2020. Jordan Water Sector Facts and Figures. [2023-12-15]. https://www.pseau.org/outils/ouvrages/mwi_jordan_water_sector_facts_and_figures_2015.pdf.

[34]
Pettitt A N. 1979. A non-parametric approach to the change-point detection. Journal of the Royal Society: Series C (Applied Statistics), 28: 126-135.

[35]
Refsgaard J C. 1997. Parameterisation, calibration, and validation of distributed hydrological models. Journal of Hydrology, 198(1-4): 69-97.

[36]
Sada A A, Abu-Allaban M, Al-Malabeh A. 2015. Temporal and spatial analysis of climate change at Northern Jordanian Badia. Jordan Journal of Earth and Environmental Sciences, 7(2): 87-93.

[37]
Santhi C, Arnold J G, Williams J R, et al. 2001. Validation of the SWAT model on a large river basin with point and nonpoint sources. JAWRA Journal of the American Water Resources Association, 37(5): 1169-1188.

[38]
Shammout M W, Shatanawi K, Abualhaija M M. 2023a. Influence of population growth on supply, demand, and quality issues of water resources in the Yarmouk River Basin in Jordan. Journal of Experimental Biology and Agricultural Sciences, 11(1): 171-178.

[39]
Shammout M W, Shatanawi K, Zamil M A, et al. 2023b. A long-term estimation and modeling of domestic water resources in the Yarmouk River Basin-Jordan. Water Conservation and Management, 7(2): 107-113.

[40]
Shatanawi K, Rahbeh M, Shatanawi M. 2013. Characterizing, monitoring, and forecasting drought in the Jordan River basin. Journal of Water Resource and Protection, 5(12): 1192-1202.

[41]
UNICEF (United Nations International Children's Emergency Fund). 2022. Tapped Out: The Costs of Water Stress in Jordan. [2023-12-16]. https://www.unicef.org/jordan/media/11356/file/water%20stress%20in%20Jordan%20report.pdf.

[42]
USAID (United States Agency for International Development). 2017. Climate Change Risk Profile: Jordan-Fact Sheet. [2023-12-27]. https://www.climatelinks.org/sites/default/files/asset/document/2017_USAID_Climate%20Change%20Risk%20Profile_Jordan.pdf.

[43]
Von Neumann J. 1941. Distribution of the ratio of the mean square successive difference to the variance. The Annals of Mathematical Statistics, 12(4): 367-395.

[44]
Williams J R, Arnold J G, Kiniry J R, et al. 2008. History of model development at Temple, Texas. Hydrological Sciences Journal, 53(5): 948-960.

[45]
WMO (World Meteorological Organization). 2023. Past Eight Years Confirmed to Be the Eight Warmest on Record. [2023-12-31]. https://public.wmo.int/en/media/press-release/past-eight-years-confirmed-be-eight-warmest-record.

Outlines

/