
Root system architecture and its scaling relationships of Reaumuria soongorica in Alxa steppe desert, Northwest China
Received date: 2024-07-23
Revised date: 2024-12-20
Accepted date: 2024-12-23
Online published: 2025-08-12
Root system architecture has often been overlooked in plant research despite its critical role in plant adaptation to environmental conditions. This study focused on the root system architecture of the desert shrub Reaumuria soongorica in the Alxa steppe desert, Northwest China. Plant samples were collected during May-September 2019. Using excavation methods, in situ measurements, and root scanning techniques, we analyzed the root distribution, topology, and branching patterns of R. soongorica across an age sequence of 7-51 a. Additionally, we investigated the allometric relationships of root collar diameter with total coarse root length, biomass, and topological parameters. The results showed that the roots of R. soongorica were predominantly concentrated in shallow soil layers (10-50 cm), with lateral root branching and biomass allocation increasing with shrub age. The root topology exhibited a herringbone-like structure, with average topological and modified topological indices of 0.89 and 0.96, respectively, both of which adjusted with shrub age. The root system displayed a self-similar branching pattern, maintaining a constant cross-sectional area ratio of 1.13 before and after branching, deviating from the area-preserving rule. These adaptive traits allow R. soongorica to efficiently expand its nutrient acquisition zone, minimize internal competition, and optimize resource uptake from the upper soil layers. Furthermore, significant linear relationships were observed between log10-transformed root collar diameter and log10-transformed total coarse root length, biomass, and topological parameters. These findings advance non-destructive approaches for studying root characteristics and contribute to the development of root-related models. Besides, this study provides new insights into the adaptive strategies of R. soongorica under extreme drought conditions, offering valuable guidance for species selection and cultivation in desert restoration efforts.
MA Xiongzhong , WANG Xinping , XIONG Weihong . Root system architecture and its scaling relationships of Reaumuria soongorica in Alxa steppe desert, Northwest China[J]. Journal of Arid Land, 2025 , 17(2) : 271 -284 . DOI: 10.1007/s40333-025-0074-y
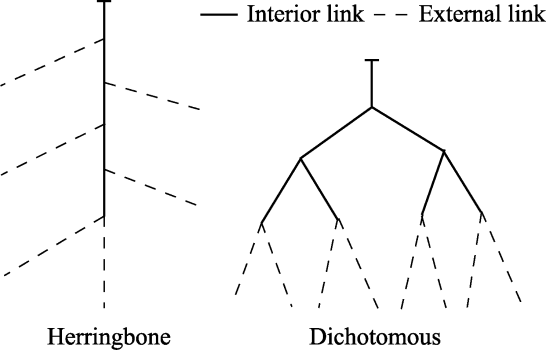
Fig. 1 Two extreme root branching patterns of herringbone and dichotomous (Fitter, 1987) |
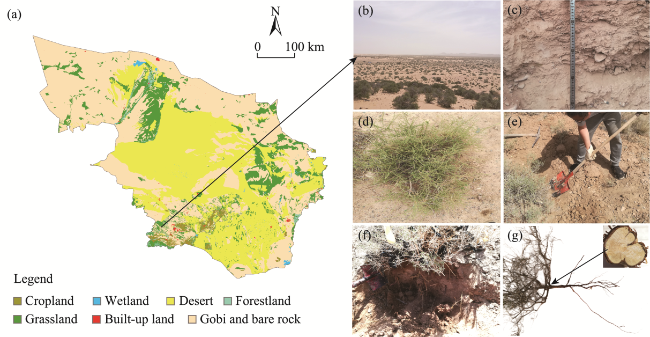
Fig. 2 Overview of the study area (a) and photos showing the landscape of the sampling plot (b), soil profile (c), dominant shrub species Reaumuria soongorica (d), field sampling of R. soongorica (e), root profile of R. soongorica (f), and ring and root system architecture of R. soongorica (g) |
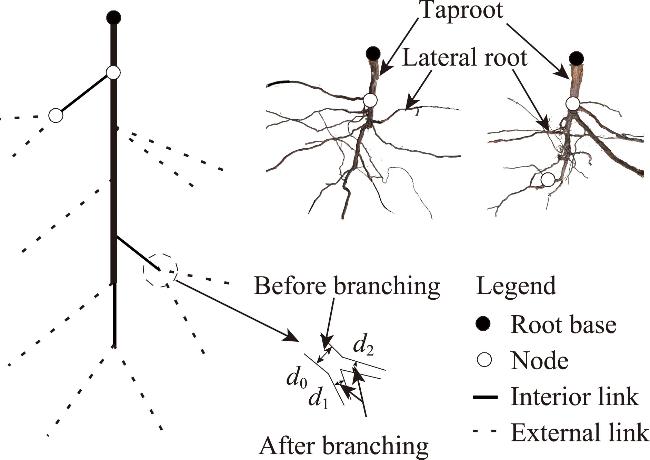
Fig. 3 Root branching patterns of R. soongorica. d0 is the root diameter before root branching; d1 and d2 are the root diameters after branching. |
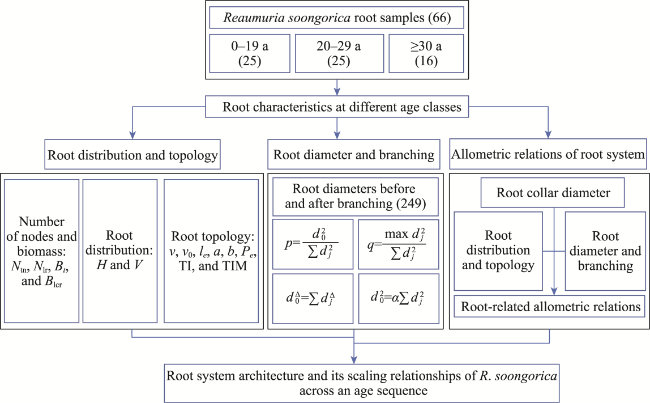
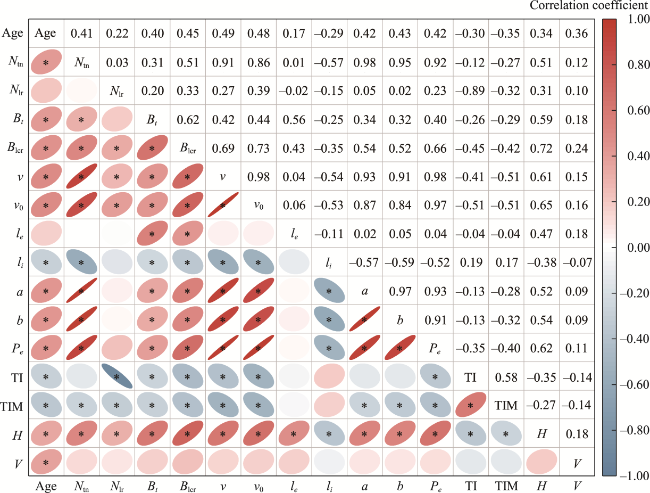
Fig. 4 Workflow of the data analysis in the present study. Ntn represents the number of taproot nodes per shrub; Nlr represents the number of lateral roots per taproot node; Bt represents the biomass of taproot per shrub; Blcr represents the biomass of lateral coarse roots per shrub; H represents the root maximal horizontal extension; V represents the root maximal vertical extension; v represents the total number of links; v0 represents the number of external links; le represents the mean external link length; li represents the mean interior link length; a represents the altitude, which is the longest path (a path with the most links) from the root base to external links; b represents the topological depth; Pe represents the external path length, which is the sum of all path lengths from external links to the root base; p represents the proportionality factor; dj represents the root diameter after branching; q represents the allocation factor; Δ represents the diameter exponent; α represents the regression slope; TI represents the topological index; TIM represents the modified topological index. Values in parentheses represent the sample sizes. |
Table 1 Summary of the root distribution parameters for Reaumuria soongorica at each age class |
| Parameter | Age class | |||
|---|---|---|---|---|
| 0-19 a | 20-29 a | ≥30 a | Mean | |
| Number of taproot nodes per shrub (Ntn) | 2.9±0.3a | 3.8±0.4ab | 4.6±0.4b | 3.6±0.2 |
| Number of lateral roots per taproot node (Nlr) | 1.2±0.1a | 1.2±0.1a | 1.4±0.1b | 1.3±0.0 |
| Proportion of taproot nodes with one lateral root (%) | 83.3 | 79.8 | 67.6 | 77.0 |
| Proportion of taproot nodes with multiple lateral roots (%) | 16.7 | 20.2 | 32.4 | 23.0 |
| Biomass of taproot per shrub (Bt; g) | 17.1±2.8a | 24.7±3.1ab | 28.6±3.1b | 22.7±1.8 |
| Biomass of lateral coarse roots per shrub (Blcr; g) | 10.2±2.2a | 17.2±2.4ab | 25.7±5.0b | 16.6±1.9 |
Note: Values are mean±SE. The sample sizes were 25, 25, and 16 for age classes of 0-19, 20-29, and ≥30 a, respectively. Significant differences among different columns are indicated by distinct lowercase letters (P<0.05). |
Fig. 5 Correlation analysis between root distribution and topological parameters. * indicates a significant correlation at the P<0.05 level. |
Table 2 Topological parameters of the root systems for R. soongorica at each age class |
| Parameter | Age class | |||
|---|---|---|---|---|
| 0-19 a | 20-29 a | ≥30 a | Mean | |
| Number of links (v) | 7.7±0.8a | 10.6±1.1b | 14.6±1.1c | 10.5±0.7 |
| Number of external links (v0) | 4.6±0.5a | 6.2±0.6a | 8.8±0.7b | 6.2±0.4 |
| Mean external link length (le; mm) | 357.9±42.2a | 372.5±32.3a | 374.4±37.2a | 367.4±22.2 |
| Mean interior link length (li; mm) | 98.0±14.7a | 82.1±9.1ab | 62.4±6.2b | 83.4±6.8 |
| Maximal horizontal extension (mm) | 313.2±28.1a | 346.5±22.2ab | 412.3±26.8b | 350.7±15.4 |
| Maximal vertical extension (mm) | 346.4±18.3a | 404.8±19.5b | 425.6±13.5b | 387.4±11.7 |
| Altitude (a) | 3.9±0.3a | 5.0±0.4b | 5.7±0.3b | 4.7±0.2 |
| Mean topological depth (b) | 3.2±0.2a | 3.7±0.2b | 4.1±0.1b | 3.6±0.1 |
| External path length (Pe) | 16.7±2.7a | 25.9±4.2a | 37.3±3.9b | 25.2±2.3 |
| Topological index (TI) | 0.92±0.02a | 0.90±0.02a | 0.81±0.03b | 0.89±0.01 |
| Modified topological index (TIM) | 0.98±0.01a | 0.96±0.01a | 0.91±0.02b | 0.96±0.01 |
Note: Values are mean±SE. The sample sizes were 25, 25, and 16 for age classes of 0-19, 20-29, and ≥30 a, respectively. Significant differences among different columns are indicated by distinct lowercase letters (P<0.05). |
Table 3 Summary of basic statistics for the branching parameters and the diameter exponent (Δ) |
| Parameter | Statistical indicator | Age class | |||
|---|---|---|---|---|---|
| 0-19 a | 20-29 a | ≥30 a | All ages | ||
| p | Minimum | 0.65 | 0.38 | 0.57 | 0.38 |
| Maximum | 1.95 | 2.74 | 3.75 | 3.75 | |
| Mean | 1.10a | 1.09a | 1.20a | 1.13 | |
| Standard error | 0.03 | 0.03 | 0.05 | 0.02 | |
| P-value | 0.00 | 0.00 | 0.00 | 0.00 | |
| q | Minimum | 0.37 | 0.36 | 0.43 | 0.36 |
| Maximum | 0.98 | 0.98 | 0.98 | 0.98 | |
| Mean | 0.75a | 0.74a | 0.75a | 0.75 | |
| Standard error | 0.02 | 0.02 | 0.02 | 0.01 | |
| P-value | 0.00 | 0.00 | 0.00 | 0.00 | |
| Δ | Minimum | 1.00 | 0.81 | 0.86 | 0.81 |
| Maximum | 4.84 | 5.61 | 3.57 | 5.61 | |
| Mean | 1.88ab | 1.95a | 1.71b | 1.85 | |
| Standard error | 0.08 | 0.10 | 0.06 | 0.05 | |
| P-value | 0.15 | 0.62 | 0.00 | 0.00 | |
Note: p represents the proportionality factor; q represents the allocation factor; P-value represents the probability that the observed results are consistent with the null hypothesis of p=1.00, q=0.50, and Δ=2.00 at different age classes. The sample sizes were 70, 101, and 78 for age classes of 0-19, 20-29, and ≥30 a, respectively. Significant differences are denoted by distinct lowercase letters (P<0.05). |
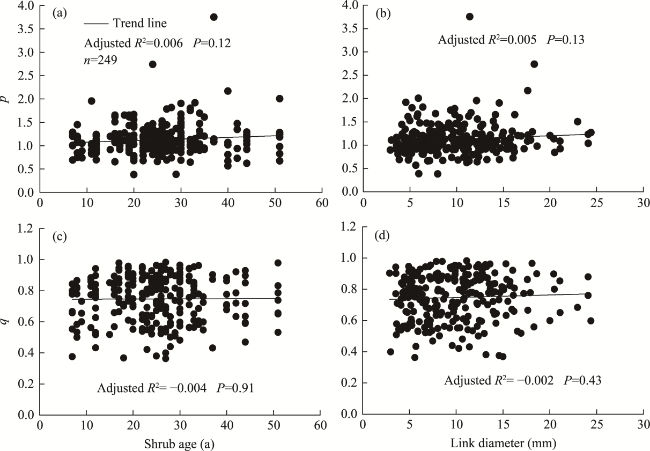
Fig. 6 Regression of root branching parameters (p and q) against shrub age (a and c) and link diameter (b and d) |
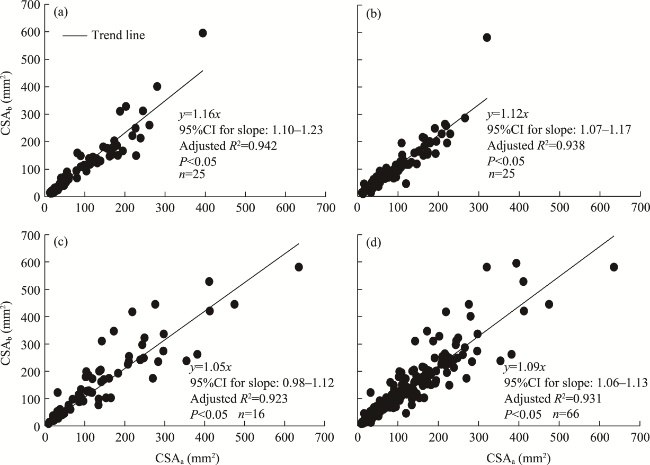
Fig. 7 Linear regression (through the origin) of cross-sectional area before branching (CSAb) against cross- sectional area after branching (CSAa) for age classes of 0-19 a (a), 20-29 a (b), and ≥30 a (c), and the entire age sequence (d). 95%CI represents the 95% confidence interval. |
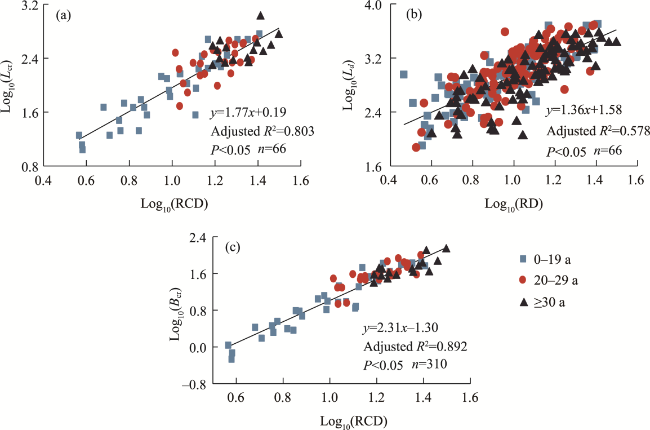
Fig. 8 Scaling relationships in the root systems of R. soongorica. (a), relationship between log10-transformed root collar diameter (RCD) and total coarse root length (Lcr); (b), relationship between log10-transformed root diameter (RD) and total distal length (Ld); (c), relationship between log10-transformed RCD and total coarse root biomass (Bcr). |
Table 4 Linear regression of log10-transformed root collar diameter (RCD) and topological parameters (v, v0, a, b, and Pe) |
| Scaling relationship | Slope | 95%CI | Intercept | Adjusted R2 | P-value |
|---|---|---|---|---|---|
| Between log10(RCD) and log10(v) | 1.51 | 1.30-1.72 | -0.88 | 0.733 | <0.05 |
| Between log10(RCD) and log10(v0) | 1.27 | 1.09-1.44 | -0.80 | 0.742 | <0.05 |
| Between log10(RCD) and log10(a) | 1.01 | 0.84-1.17 | -0.58 | 0.668 | <0.05 |
| Between log10(RCD) and log10(b) | 0.78 | 0.65-0.91 | 0.08 | 0.662 | <0.05 |
| Between log10(RCD) and log10(Pe) | 2.05 | 1.76-2.35 | -1.21 | 0.718 | <0.05 |
Note: 95%CI represents the 95% confidence interval. The sample size for each scaling relationship was 66. |
| [1] |
|
| [2] |
|
| [3] |
|
| [4] |
|
| [5] |
|
| [6] |
|
| [7] |
|
| [8] |
|
| [9] |
|
| [10] |
|
| [11] |
|
| [12] |
|
| [13] |
|
| [14] |
|
| [15] |
|
| [16] |
|
| [17] |
|
| [18] |
|
| [19] |
|
| [20] |
|
| [21] |
|
| [22] |
|
| [23] |
|
| [24] |
|
| [25] |
|
| [26] |
|
| [27] |
|
| [28] |
|
| [29] |
|
| [30] |
|
| [31] |
|
| [32] |
|
| [33] |
|
| [34] |
|
| [35] |
|
| [36] |
|
| [37] |
|
| [38] |
|
/
| 〈 |
|
〉 |