Research article

Spatiotemporal evolution of ecological environment quality and its drivers in the Helan Mountain, China

  • HE Yuanrong 1, 2 ,
  • CHEN Yuhang , 1, * ,
  • ZHONG Liang 1 ,
  • LAI Yangfeng 1 ,
  • KANG Yuting 1 ,
  • LUO Ming 1 ,
  • ZHU Yunfei 3 ,
  • ZHANG Ming 3
Expand
  • 1Digital Fujian Institute of Big Data for Natural Disaster Monitoring, Xiamen University of Technology, Xiamen 361000, China
  • 2Hunan Key Laboratory of Remote Sensing Monitoring of Ecological Environment in Dongting Lake Area, Changsha 410004, China
  • 3Zhundong Oil Production Plant, Xinjiang Oilfield Company, Changji 831511, China
*CHEN Yuhang (E-mail: )

Received date: 2024-08-08

  Revised date: 2024-11-24

  Accepted date: 2024-11-28

  Online published: 2025-08-12

Abstract

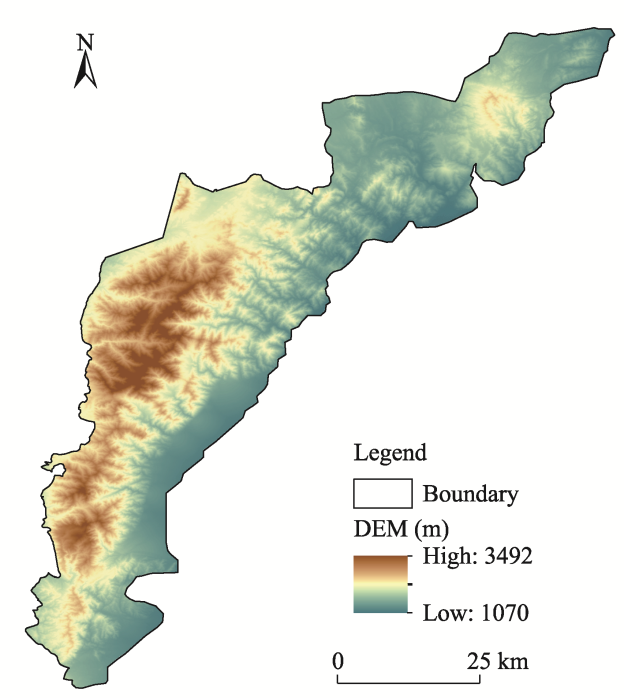
Understanding the ecological evolution is of great significance in addressing the impacts of climate change and human activities. However, the ecological evolution and its drivers remain inadequately explored in arid and semi-arid areas. This study took the Helan Mountain, a typical arid and semi-arid area in China, as the study area. By adopting an Enhanced Remote Sensing Ecological Index (ERSEI) that integrates the habitat quality (HQ) index with the Remote Sensing Ecological Index (RSEI), we quantified the ecological environment quality of the Helan Mountain during 2010-2022 and analyzed the driving factors behind the changes. Principal Component Analysis (PCA) was used to validate the composite ERSEI, enabling the extraction of key features and the reduction of redundant information. The results showed that the contributions of first principal component (PC1) for ERSEI and RSEI were 80.23% and 78.72%, respectively, indicating that the ERSEI can provide higher precision and more details than the RSEI in assessing ecological environment quality. Temporally, the ERSEI in the Helan Mountain exhibited an initial decline followed by an increase from 2010 to 2022, with the average value of ERSEI ranging between 0.298 and 0.346. Spatially, the ERSEI showed a trend of being higher in the southwest and lower in the northeast, with high-quality ecological environments mainly concentrated in the western foothills at higher altitudes. The centroid of ERSEI shifted northeastward toward Helan County from 2010 to 2022. Temperature and digital elevation model (DEM) emerged as the primary drivers of ERSEI changes. This study highlights the necessity of using comprehensive monitoring tools to guide policy-making and conservation strategies, ensuring the resilience of fragile ecosystems in the face of ongoing climatic and anthropogenic pressures. The findings offer valuable insights for the sustainable management and conservation in arid and semi-arid ecosystems.

Cite this article

HE Yuanrong , CHEN Yuhang , ZHONG Liang , LAI Yangfeng , KANG Yuting , LUO Ming , ZHU Yunfei , ZHANG Ming . Spatiotemporal evolution of ecological environment quality and its drivers in the Helan Mountain, China[J]. Journal of Arid Land, 2025 , 17(2) : 224 -244 . DOI: 10.1007/s40333-025-0073-z

1 Introduction

Arid areas occupy approximately 40.60% of the global land area and hold significant importance in global ecosystems and human society (Tariq et al., 2024). Northwest China is a typical arid and semi-arid area with high evapotranspiration, severe wind erosion, and water scarcity, and these features contribute to ecological fragility in the region (Zhang et al., 2023). Monitoring and assessing the ecological environment quality in the region is imperative to scientifically evaluate its ecological status. Identifying the spatiotemporal dynamics of ecological environment quality and the main influencing factors serves as a critical foundation for ecosystem management and is a crucial indicator of the effectiveness of regional ecological civilization construction.
Numerous studies have explored ecological changes in arid and semi-arid areas on specific aspects. For instance, Li et al. (2021) conducted a study on the theoretical framework of water resource allocation, the construction of mathematical models, and the analysis of optimized allocation schemes based on the ecological priority model, with a focus on the arid areas in central and southern Ningxia Hui Autonomous Region, China. Lu et al. (2023) focused on arid areas to study the spatiotemporal evolution trends, driving mechanisms, and spatial non-stationarity of ecological risks, and constructed a research framework for the ecological risk index based on land use and socio-economic data. Xu et al. (2024) conducted a case study in arid areas in Northwest China, focusing on the relationship between vegetation cover and soil erosion. However, these studies often rely on panel data and lack further quantification and detailed analysis of the entire ecosystem. Advancements in remote sensing technology have revolutionized ecosystem monitoring by providing substantial remote sensing data and reliable assessments of ecological conditions across different scales (Willis, 2015). Xu (2013) proposed the Remote Sensing Ecological Index (RSEI), an ecological index capable of rapidly monitoring and assessing the quality of complex ecological environments within a region. This index uses the Principal Component Analysis (PCA) to couple four evaluation indicators: Normalized Difference Vegetation Index (NDVI), Wetness Component (WET), Normalized Difference Built-up and Soil Index (NDBSI), and Land Surface Temperature (LST). The PCA approach mitigates the subjectivity of manually assigned weights and overcomes the limitations inherent in using single remote sensing indices, making RSEI a widely adopted tool for ecological assessments in diverse environments, including urban areas, river basins, deserts, nature reserves, and mining areas (Shi et al., 2021; Wang et al., 2021; Bai et al., 2023; Wang et al., 2023a).
Given the unique ecological environment characteristics across different regions (Shi et al., 2023), scholars proposed a variety of improved RSEI models tailored to surface features in regions such as mining areas, wetlands, farms, and coastal cities, demonstrating their efficacy (Jiang et al., 2021; Ma et al., 2024). For example, a desertification index was integrated into the RSEI to generate the Drought Remote Sensing Ecological Index (DRSEI) to analyze the ecological environment quality of the arid area of Northwest China from 1994 to 2020 (Luo et al., 2023). Similarly, the Arid Remote Sensing Ecological Index (ARSEI) constructed by integrating vegetation coverage, humidity, salinity, and land degradation degree was used to assess the ecological environment quality of the Aral Sea Basin in Central Asia (Jie et al., 2021). While these studies have expanded the application of RSEI, they often overlook the impacts of land use and land cover (LULC) types. Different LULC types offer distinct ecosystem service functions (Liu et al., 2020; Wang et al., 2023b). For example, croplands provide the basic functions of food production, forests provide ecological functions such as soil and water conservation, climate regulation, and maintenance of biodiversity, while water bodies and wetlands play critical roles in hydrology regulation and wastewater treatment (Li et al., 2020; Li et al., 2022). The primary determinant of the habitat quality (HQ) index discussed in this paper is LULC type. Therefore, combining the RSEI with the HQ index can better mitigate biases caused by different LULC types.
Helan Mountain, located in Northwest China, experiences extreme climatic conditions and has a fragile ecosystem that is highly sensitive to climate change and human activities. This study utilized the Google Earth Engine (GEE) and Landsat remote sensing imagery to dynamically monitor the ecological environment changes in the Helan Mountain from 2010 to 2022 based on an Enhanced Remote Sensing Ecological Index (ERSEI) that includes five ecological indicators: NDVI, WET, NDBSI, LST, and HQ. Additionally, the geographic detector (Geodetector) was used to explore the driving factors behind these changes. This study can help reveal the ecological response mechanisms and provide a theoretical basis for the ecological environment protection and restoration in the region.

2 Materials and methods

2.1 Study area

Helan Mountain (105°17′-106°32′E, 37°38′-39°30′N; Fig. 1) acts as a natural divide separating the arid and semi-arid areas of Northwest China (Yang and Dong, 2020), holding unique natural geographical environment. The annual average temperature at the foothills of the mountain is around 8°C, while at the summit it is about -1°C. The annual precipitation increases from 200 mm at the foothills to over 400 mm at the summit. Precipitation is mainly concentrated from July to September, accounting for 60.00% of the total annual precipitation. Topographically, the mountain features steep slopes, deeply incised valleys, and an elevation range of 1070 to 3492 m. It shields against the eastward progression of the Tengger Desert and the westward advance of the southeastern monsoon, and weakens the influence of the Siberian high pressure cold air, contributing to significant different climates, water sources, and vegetation on either side of the mountain. The ecological security of the region directly impacts the survival of endangered species and the ecological balance of the Ningxia section of the northern arid desert belt. Due to its unique geographic location and fragile ecosystem, the Helan Mountain was designated as a national ecological reserve in May 1988. However, despite its protected status, the region faces ecological threats caused by unregulated mining activities.
Fig. 1 Overview of the Helan Mountain based on the digital elevation model (DEM)

2.2 Data sources

The study selected the years 2010, 2014, 2018, and 2022 as key time points. Since 2010, the Helan Mountain has been gradually incorporated into the primary monitoring framework of national ecological governance. Consequently, the data gathered in 2010 served as a baseline, reflecting environmental conditions prior to the implementation of extensive ecological restoration efforts. In 2014 and 2018, the Chinese government initiated several regional restoration projects to address the ecological vulnerability in Northwest China. After years of ecological protection measures, the ecological conditions of the Helan Mountain in 2022 were evaluated to assess the effectiveness of these conservation efforts.
This study selected Landsat 5 TM and Landsat 8 OLI images, each with a spatial resolution of 30 m. To minimize the seasonal variability in remote sensing parameters, image acquisition was confined to the months of June-September. This period was selected as it has the optimal vegetation growth and minimal snow cover. To ensure the consistency and accuracy of data across varying resolutions, this study employed the geostatistical interpolation method of Kriging during data processing (Srivastava et al., 2019). This method utilizes spatial autocorrelation to generate high-precision interpolation results, ensuring spatial consistency among different data sources after resolution unification. Additionally, we compared the spatial distribution characteristics of the interpolated data with the original high-resolution data to assess the effectiveness of the resampling method, ensuring that the interpolated data can accurately reflect real ecological environment changes.
The GEE platform was employed to perform cloud removal, create mosaic, mask water bodies, and synthesize the mean value to construct the interannual images of the study area (Akhoondzadeh, 2022; Zhao et al., 2022). Considering the local environment and related studies (Zhao et al., 2022), we selected a total of seven driving factors influencing the ecological environment quality, including six natural factors and one human factor(Table 1). Natural factors included temperature, precipitation, digital elevation model (DEM), slope, aspect, and net primary production (NPP). Population density was selected as the human factor.
Table 1 Detailed description of data used in the study
Data Resolution (m) Time period Unit Data source
Landsat 5 TM images 30 2010 - EarthExplorer (https://earthexplorer.usgs.gov/)
Landsat 8 OLI images 30 2014-2022 - GSCloud (https://www.gscloud.cn/)
Precipitation 1000 2010-2022 mm Resources and Environmental Science Data Center (http://www.resdc.cn)
Temperature 1000 2010-2022 Resources and Environmental Science Data Center (http://www.resdc.cn)
DEM 15 2022 m GSCloud (https://www.gscloud.cn/)
Slope 15 2022 ° GSCloud (https://www.gscloud.cn/)
NPP 30 2022 g C/(m2•a) GSCloud (https://www.gscloud.cn/)
Population density 1000 2010-2022 persons/km2 GSCloud (https://www.gscloud.cn/)
LULC 1000 2010-2022 - Resources and Environmental Science Data Center (http://www.resdc.cn)

Note: DEM, digital elevation model; NPP, net primary productivity; LULC, land use and land cover. "-" indicates the data do not have a unit.

A suite of software tools was utilized to enhance the precision and reliability of data processing and analysis. ENVI 5.6 was employed for radiometric correction, atmospheric correction, and image cropping of remote sensing data; ArcMap 10.5 was used for spatial data processing and regional statistical analysis; InVEST 3.14.1 was used to assess the HQ; and GEE facilitated large-scale remote sensing data acquisition, time-series analysis, and the extraction of ecological indicators such as NDVI, NDBSI, and LST. The integrated use of these tools significantly enhanced the efficiency of data processing, the precision of analysis, and the reliability of results.

2.3 Methods

To characterize the spatiotemporal dynamics of ecological environment quality and the driving factors in the Helan Mountain, we designed a comprehensive characterization framework (Fig. 2). This research can be summarized into four stages: data acquisition and preprocessing, ERSEI model establishment, ERSEI trend analysis, and driving factor analysis.
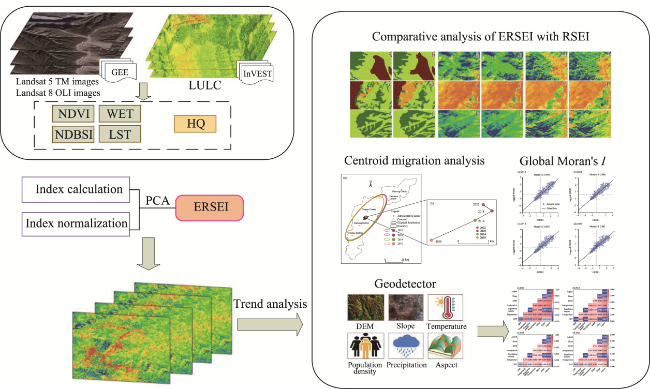
Fig. 2 Technical workflow of this study. GEE, Google Earth Engine; LULC, land use and land cover; NDVI, Normalized Difference Vegetation Index; WET, Wetness Component; NDBSI, Normalized Difference Built-up and Soil Index; LST, Land Surface Temperature; HQ, habitat quality; PCA, Principal Component Analysis; ERSEI, Enhanced Remote Sensing Ecological Index; RSEI, Remote Sensing Ecological Index; Geodetector, geographic detector.

2.3.1 Construction of ERSEI

The ERSEI was constructed using the PCA method (Yulianti et al., 2024), incorporating five ecological indicators: NDVI, WET, NDBSI, LST, and HQ. NDVI is the most widely used vegetation index, which can accurately reflect vegetation growth and seasonal variations. It is highly sensitive to environmental changes caused by climate change and human activities, making it suitable for large-scale ecological monitoring. WET addresses NDVI's limitations in monitoring soil moisture, thereby enhancing the ability of ERSEI to monitor ecological changes in arid areas. NDBSI reflects soil exposure and land degradation, particularly in unused and construction land areas, thus allowing for an improved comprehensive evaluation of regional ecological environments. LST represents thermal changes in the environment, capturing the direct impact of land use and climate change on ecosystems, thereby elucidating how temperature influences vegetation and ecological environment quality. HQ assesses changes in habitat fragmentation and quality, emphasizing biodiversity and ecosystem services that may be overlooked by other indicators. These indicators complement each other, forming a multi-dimensional ecological quality evaluation system that comprehensively reflects the characteristics of arid and semi-arid areas, overcoming the limitations inherent in single indicators and providing robust scientific support for the model's construction. The indicators and corresponding calculations are described below.
NDVI has been extensively utilized to monitor vegetation growth and health, and is also closely associated with ecosystem resilience and vitality. The specific calculation formula is as follows:
NDVI = ( ρ nir ρ red )/( ρ nir + ρ red ),
where ρnir and ρred represent the reflectance of near-infrared and red bands of Landsat TM (or OLI) image, respectively.
WET can be calculated using remote sensing Kirchhoff Transform, which reflects accurate surface vegetation and soil moisture. As an important indicator of ecological environment quality, its calculation is outlined in Equation 2:
WET = 0. 1511 ρ blue + 0. 1973 ρ green + 0.3 283 ρ red + 0. 3407 ρ nir 0. 7117 ρ swir 1 0. 4559 ρ swir2,
where ρblue, ρgreen, ρswir1, and ρswir2 represent the reflectance of the blue, green, short-wave infrared 1, and short-wave infrared 2 bands of the Landsat TM (or OLI) image, respectively. The coefficients for each band are sensor-specific, with values tailored to each individual sensor.
NDBSI is comprised of the building index (BI) and the bare soil index (SI) (Peng et al., 2023). However, given the sparse population and the negligible presence of buildings and man-made surface, BI was excluded from the dryness index in this study, leaving only SI for evaluation and reflecting the degree of land surface desertification. The calculation formula is as follows:
NDBSI = SI = [ ( ρ swir1 + ρ red ) ( ρ blue + ρ nir ) ] / [ ( ρ swir 1 + ρ red ) + ( ρ blue + ρ nir ) ],
LST correlates to vegetation, water resources, and human activity intensity. In this study, we employed the atmospheric correction method to derive the LST to characterize the heat index (Thompson et al., 2019). The specific calculation formulas are as follows:
L λ = [ ε B ( T s ) + ( 1 ε ) L ] τ + L ,
B ( T s ) = L λ L τ ( 1 ε ) L τ ε ,
T s = k 2 ln k 1 B ( T s ) + 1 273,
where Lλ is the thermal infrared radiation brightness value (W/(m2•sr•μm)), obtained by correcting the atmospheric delay in the thermal infrared image; ε is the surface specific emissivity; Ts is the surface temperature (℃); B(Ts) is the brightness of the blackbody radiation (W/(m2•sr•μm)); τ is the transmittance rate of the atmosphere in the thermal infrared wavelengths; L and L represent the atmospheric upward and downward radiation to the ground of energy, respectively (W/(m2•sr•μm)); and k1 and k2 are calibration constants specific to the sensor.
HQ is derived from the LULC data using the InVEST model (Liu et al., 2024a). This metric assesses the degree of regional habitat fragmentation and resilience to habitat degradation. The calculation is specified in Equation 7:
HQ i j = H j 1 D i j Z D i j Z k Z,
where HQij denotes the habitat quality of grid i in LULC type j; Hj denotes the habitat suitability of LULC type j; Dij denotes the stress level of grid i in LULC type j; Z denotes the normalization constant; and k is a scaling constant.
The values of HQij range from 0.000 to 1.000. Larger values indicate higher habitat quality, greater suitability for biological survival, and higher biodiversity. Lower values indicate poorer habitat quality, making it less favorable to maintain regional biodiversity. This study referred to the user manual of the InVEST model, and considered the actual conditions of the study area. Farmland and construction land were taken as threat sources. Different maximum impact distances and weights for threat factors were set based on actual conditions, as detailed in Tables 2 and 3. Additionally, data calibration and validation were conducted to reduce model biases and ensure that the parameters used align with the specific characteristics of the study area.
Table 2 Threat factors and their weights in the study area
Threat factor Maximum impact distance (km) Weight Decay type
Farmland 0.5 0.2 Linear
Construction land 5.0 0.5 Index
Table 3 Habitat suitability of each LULC type and its sensitivity to different coercion factor
LULC type Habitat suitability Sensitivity
Farmland Construction land
Farmland 0.3 0.0 0.5
Woodland 1.0 0.4 0.6
Grassland 0.7 0.3 0.4
Shrubland 0.8 0.3 0.4
Wetland 1.0 0.4 0.5
Water body 0.9 0.6 0.7
Construction land 0.0 0.0 0.0
Unused land 0.0 0.0 0.0
The study utilized the PCA to integrate the five indicators (NDVI, WET, NDBSI, LST, and HQ). The weights of these indicators were determined by the load values generated through PCA. To address potential imbalance in indicator weights, normalization was performed prior to analysis. This ensures that the weights of the indicators are uniformly set in the range of 0.000-1.000 (Liu et al., 2024b). NDVI, WET, and HQ are positively normalized using Equation 8, and NDBSI and LST are negatively normalized using Equation 9:
y = ( y 0 y min ) / ( y max y min ),
y = ( y max y 0 ) / ( y max y min ),
where y denotes the normalized value of an indicator; y0 denotes value of an indicator before normalization; and ymax and ymin denote the minimum and maximum values of an indicator before normalization, respectively.
The ERSEI is expressed in Equation 10:
ERSEI = F PCA ( NDVI, WET, LST, NDBSI, HQ ),
where FPCA refers to the use of PCA to perform dimensionality reduction on input variables; and NDVI, WET, LST, NDBSI, and HQ are normalized values for each indicator. The normalization process aimed to derive the ERSEI, with values ranging between 0.000 and 1.000. A larger value indicates a better ecological environment, while lower values signify poorer conditions. The ERSEI, which incorporates the HQ, places greater emphasis on changes in ecological threats and ecosystem services compared to the traditional RSEI. By considering the HQ, the ERSEI enhances its sensitivity in identifying threats to biodiversity, particularly in areas with complex LULC types. The specific technical route is shown in Figure 2. Natural Breaks is a data classification technique that maximizes homogeneity within each class and minimizes differences between classes, thus scientifically reflecting the inherent distribution characteristics of the data. Using the Natural Breaks method, the ecological environment quality was divided into five categories based on the ERSEI value: very poor (0.000-0.200), poor (0.200-0.400), medium (0.400-0.600), good (0.600-0.800), and excellent (0.800-1.000).

2.3.2 ERSEI trend analysis

The study used linear regression analysis to calculate the trend of ERSEI, and then classified the trend of change, with the following definitions: increase (0.150≤Slope<0.230), slight increase (0.050≤Slope<0.150), unchange (-0.050≤Slope<0.050), slight decline (-0.150≤Slope< -0.050), and decline (-0.250≤Slope< -0.150).
Moran's I is a commonly used spatial autocorrelation analysis method that can effectively evaluate the spatial clustering or dispersion in ERSEI. In this study, Moran's I was used to reveal the spatial distribution characteristics of ERSEI over different time periods, providing a quantitative measure of spatial heterogeneity in ERSEI. Besides, it serves as a crucial basis for understanding the spatiotemporal dynamics of ERSEI (Tillé et al., 2018; Chen, 2023). The specific calculation formula is as follows:
I = ( n / W ) w k l ( x k x ¯ ) ( x l x ¯ ) / w k l ( x k x ¯ ) 2,
where I is the Moran's I index; n is the number of samples; W is the geographic neighborhood weight; wkl is the spatial weight between location k and location l; xk is the value of the kth sample; xl is the value of the lth sample; and x ¯ is the average of all samples.
Centroid migration analysis was used to assess the direction and magnitude of spatiotemporal variations in ERSEI in this study. The Helan Mountain features complex terrain, and its ecological environment quality is influenced by both natural and human factors, showing significant spatial heterogeneity. Through centroid migration analysis, the centroid migration trajectory of ERSEI within the study area can be clearly displayed, helping to intuitively understand the direction and magnitude of variations in ERSEI over different time periods (Tillé et al., 2018; Chen, 2023). The spatial transfer characteristics of ERSEI in different periods can be calculated using the centroid migration model, and the distance of the migration can be determined as follows:
D t ( t + m ) = X t X ( t + m ) 2 + Y t Y ( t + m ) 2,
where Dt(t+m) is the migration distance of the centroids of ERSEI in the study area from year t to year t+m; Xt and Yt denote the horizontal and vertical coordinates of the centroid in year t, respectively; and Xt+m and Yt+m denotes the horizontal and vertical coordinates of the centroids in year t+m, respectively.
When analyzing the migration direction of the ecological centroid, it is crucial to consider the angle of the centroid relative to the north direction. Assuming the initial angle starts from the north and rotates clockwise, the angle will increase. The rotation angle is the deviation from true north. The arctangent function for the angle of centroid migration is expressed in Equation 13:
α =    arctan Y t Y t + m X t X t + m if   X t X t + m 0 3 2 π arctan Y t Y t + m X t X t + m    if   X t X t + m < 0,
where α is the clockwise angle between the north direction and the shift direction of the centroid.

2.3.3 Geodetector

Geodetector is a statistical method designed to identify the spatial heterogeneity and reveal the driving factors behind it (Yu et al., 2021). It has been widely used in socio-economic research (Liang et al., 2022) and ecological studies (Hu and Zhang, 2021). The model consists of four detectors: factor detector, interaction detector, risk detector, and ecological detector. In this study, the factor detector and interaction detector were used to analyze the main factors affecting the ecological environment quality of the study area. The factor detector identifies the distribution of ERSEI and gauges the impact of a single factor on this distribution, which is measured using Equation 14:
q = 1 1 N σ 2 h = 1 Z N h σ h 2,
where q represents the explanatory power of each driving factor on ERSEI changes, and the greater the value, the stronger the explanatory power; N and Nh are the number of units in the layer h (h=1, 2,..., Z) and the whole region, respectively; Z is the stratification of ERSEI (or its driving factors), that is, classification or partitioning; and σ2 and σ h 2 are the variances of ERSEI in layer h and the whole region, respectively.
Interactive detector was utilized to assess whether the explanatory power of driving factors on ERSEI changes is enhanced or diminished when considering the synergistic effects of driving factors. The evaluation method involves obtaining the q-values of two factors individually through factor detection, denoted as q(F1) and q(F2). Subsequently, the q-value of the two factors when acting synergistically can be calculated as q(F1F2). The comparison of these q-values results in categorizing the outcomes into five distinct types (Table 4).
Table 4 Description of interaction effects caused by the interaction between driving factors
Description Interaction effect
q(F1∩F2)<min(q(F1), q(F2)) Nonlinear attenuation
min(q(F1), q(F2))<q(F1∩F2)<max(q(F1), q(F2)) Single-factor nonlinear attenuation
q(F1∩F2)>max(q(F1), q(F2)) Two-factor enhancement
q(F1∩F2)=q(F1)+q(F2) Independent
q(F1∩F2)>q(F1)+q(F2) Nonlinear enhancement

Note: F1 is a driving factor of ERSEI; F2 is another driving factor of ERSEI; q(F1) and q(F2) are the influences of F1 and F2 on the spatial heterogeneity of ERSEI, respectively; q(F1F2) is the influence of the interaction of F1 and F2 on the spatial heterogeneity of ERSEI. min, minimum; max, maximum.

In this study, by maximizing q-value, we divided different grid variables using various partitioning methods and breakpoints. This approach optimized the discretization of independent variables and mitigated the impact of manual divisions on the q-value.

3 Results

3.1 Comparison of ERSEI with RSEI

We selected three regions within the Helan Mountain, including region A in the western part, region B in the central region, and region C in the southeastern part, to compare the results of ERSEI and RSEI in 2010 and 2022 (Fig. 3). These regions encompass grassland, woodland, unused land, and construction land. The spatial distributions of ERSEI and RSEI showed significant similarities, indicating that ecological environment quality indicated by ERSEI and RSEI was similar in most areas. However, differences existed in some areas. For example, in region A, a mixed area of unused land, grassland, and woodland (Fig. 3a and b), the RSEI values were higher in unused land (bare land with bare rock texture) than in woodland (Fig. 3g and h), which is unreliable. This error stemmed from over-reliance of RSEI on image inversion techniques, neglecting the potential ecological threats posed by different LULC types. In contrast, the ERSEI considered the impact of LULC types on ecological environment quality, providing more accurate and meaningful results (Fig. 3m and n). In unused land, the ERSEI showed greater sensitivity to processes like desertification or land degradation. In region B (Fig. 3c and d), the ERSEI (Fig. 3o and p) showed a larger high-value area on the right side of the region compared to the RSEI (Fig. 3i and j), which aligns more closely with the actual ecological characteristics. In region C (Fig. 3e and f), the ERSEI demonstrated higher contrast and clarity in LULC delineation (Fig. 3q and r) compared to the RSEI (Fig. 3k and l). The ERSEI clearly depicted the boundaries between different LULC types, such as between grassland and unused land, whereas RSEI showed blurry in these areas. Such contrast indicated that ERSEI can be more effective in identifying and displaying ecological environment quality changes among different LULC types within complex ecosystems.
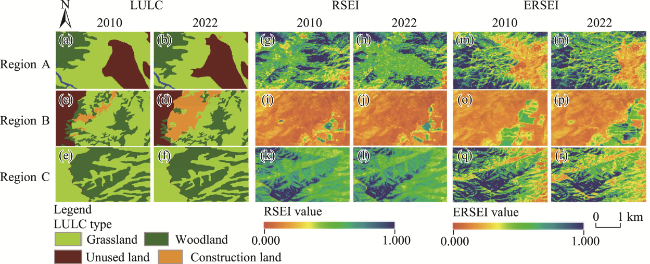
Fig. 3 Spatial distributions of LULC type (a-f), RSEI (g-l), and ERSEI (m-r) in region A, region B, and region C in the Helan Mountain in 2010 and 2022
The PCA results of RSEI and ERSEI are presented in Table 5. The PC1 contributions for ERSEI and RSEI were 80.23% and 78.72%, respectively. Specifically, the feature vector coefficient values of NDVI, WET, and HQ in PC1 were positive, indicating a positive impact on ecological environment quality. In contrast, the feature vector coefficient values of LST and NBDSI were negative, suggesting a negative impact on ecological environment quality. This aligns with the actual situation and suggests that ERSEI may serve as a reference of ecological environment quality.
Table 5 Principal Component Analysis results of ERSEI and RSEI
Index Target PC1 PC2 PC3 PC4 PC5
RSEI NDVI 0.5472 -0.2350 0.5989 -0.5355 -
WET 0.4684 0.7028 -0.4334 -0.3144 -
LST -0.5086 0.6241 0.5731 -0.1527 -
NDBSI -0.4716 -0.2477 -0.3537 -0.7689 -
Eigenvalue 0.1848 0.0204 0.0107 0.0023 -
Contribution (%) 78.72 12.34 7.90 1.05 -
ERSEI NDVI 0.5277 -0.1432 -0.2462 -0.6146 -0.5124
WET 0.4471 -0.2667 0.6561 0.4461 -0.3153
LST -0.5077 -0.0488 0.6372 -0.5595 -0.1443
NDBSI -0.4335 0.1993 -0.2223 0.3253 -0.7856
HQ 0.2756 0.9307 0.2311 -0.0657 -0.0086
Eigenvalue 0.1740 0.0404 0.0177 0.0101 0.0020
Contribution (%) 80.23 8.88 5.24 5.02 1.03

Note: ERSEI, Enhanced Remote Sensing Ecological Index; RSEI, Remote Sensing Ecological Index; NDVI, Normalized Difference Vegetation Index; WET, Wetness Component; NDBSI, Normalized Difference Built-up and Soil Index; LST, Land Surface Temperature; HQ, habitat quality. PC1, PC2, PC3, PC4, and PC5 are the first, second, third, fourth, and fifth principal components, respectively. "-" indicates no data.

3.2 Spatiotemporal variation in the five ecological indicators integrating the ERSEI

Figure 4 shows the spatial distributions of the five ecological indicators integrating the ERSEI. Under the influence of altitude on vegetation and climate, NDVI showed a distribution pattern of being higher in the southwest and lower in the northeast, while LST displayed an opposite trend, with lower values in the southwest and higher values in the northeast and southeast. Areas with high WET values were primarily concentrated in the central part of the Helan Mountain. Due to the impact of land desertification, NDBSI values were higher in the northeastern and eastern foothill regions. Meanwhile, the distribution of HQ was mainly influenced by LULC types, with significantly lower values observed in the mining areas of the central and northern regions.
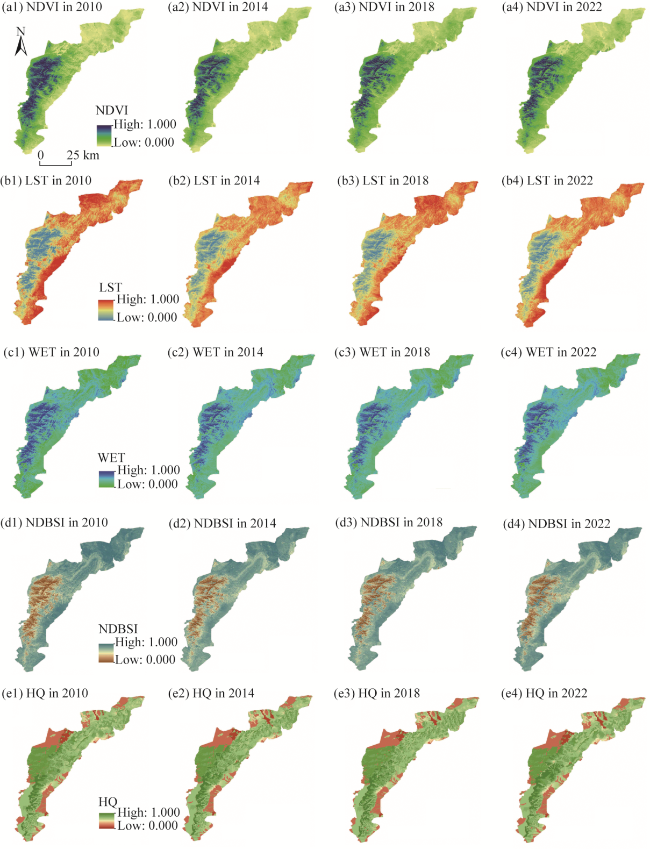
Fig. 4 Spatial variations in NDVI (a1-a4), LST (b1-b4), WET (c1-c4), NDBSI (d1-d4), and HQ (e1-e4) in the the Helan Mountain during 2010-2022
Figure 5 shows that NDBSI and WET exhibit a pattern of initial increase followed by stabilization during 2010-2022. NDVI and HQ declined before rising steadily since 2014. Moreover, the trend of LST was relatively stable during 2010-2022. Higher NDBSI indicated prevalent arid landscapes such as deserts, mountains, and bare rocky terrain in the study area. Lower NDVI suggested relatively sparse vegetation cover, mainly concentrated in the southwest.
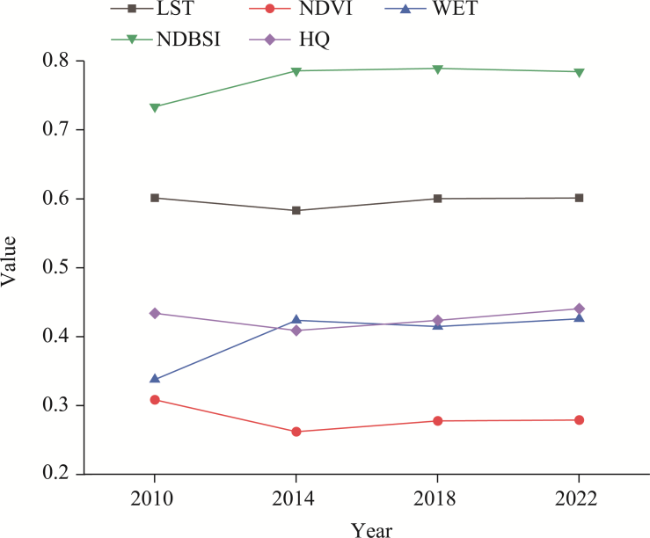
Fig. 5 Temporal variations in the mean NDVI, WET, NDBSI, LST and HQ in the Helan Mountain during 2010-2022

3.3 Spatiotemporal variation in ERSEI

From 2010 to 2022, the mean ERSEI value in the Helan Mountain fluctuated between 0.298 and 0.346 (Fig. 6). The index initially decreased and then increased, with an overall rise of 0.034. High-ERSEI areas were located in the southwest of the Helan Mountain with dense vegetation cover that supports a complete forest ecosystem. The main LULC types consist of forestland, shrubland, and a few medium-coverage grassland. Low-ERSEI areas were in the northeast of the Helan Mountain, where the main LULC types are unused land (bare land and bare rocky land), with bare rocky land being predominant.
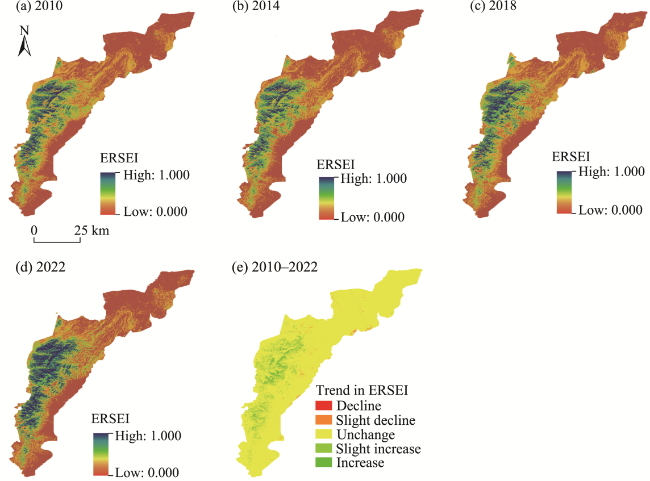
Fig. 6 Spatial distributions of ERSEI in the Helan Mountain in 2010 (a), 2014 (b), 2018 (c), and 2022 (d), as well as trend in ERSEI during 2010-2022
From 2010 to 2022, the overall trend of ERSEI showed little change, with areas of slight increase in ERSEI mainly concentrated in the high-altitude regions of the central and southwestern areas (Fig. 6e). Considering the high altitude of these regions, changes in ERSEI may be related to topography and climate, especially in the central area, where there is relatively little human activity, allowing vegetation to naturally recover. In contrast, areas with a decline in ERSEI were more scattered, primarily located on the outer sides of the mountains, near areas with human activities, especially in the mining areas.
In summary, the ecological environment quality of the Helan Mountain exhibited a notable improvement over the past decade. This improvement was most pronounced in the central and southwestern high-altitude regions, while the northeastern arid areas exhibited a slight decline. Compared with 2010, 2022 saw a decrease of 9.19% from 54.61% to 45.42% in the proportion of very poor grade areas (Fig. 7). The proportion of the excellent grade areas increased from 7.61% to 9.35%. The results demonstrated an overall improvement in ecological situation.
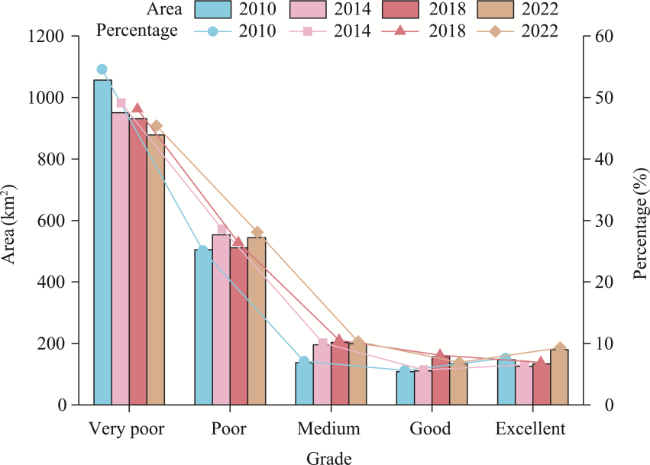
Fig. 7 Area and proportion of different grades of ecological environment quality during 2010-2022

3.4 Spatial stratified heterogeneity of ERSEI

The global Moran's I index values for ERSEI in the Helan Mountain were 0.904, 0.988, 0.881, and 0.881 in 2010, 2014, 2018, and 2022, respectively (P<0.001; Fig. 8). Most data points in the scatter plots were concentrated in the first and third quadrants, with an aggregation pattern predominantly characterized by the "high-high" and "low-low" clusters, indicating a discernible spatial correlation. The Moran's I index declined significantly from 2014 to 2018, followed by a stabilization at approximately 0.881. This trend indicated that the spatial aggregation of ERSEI in the study area has weakened and approached to be stabilized.
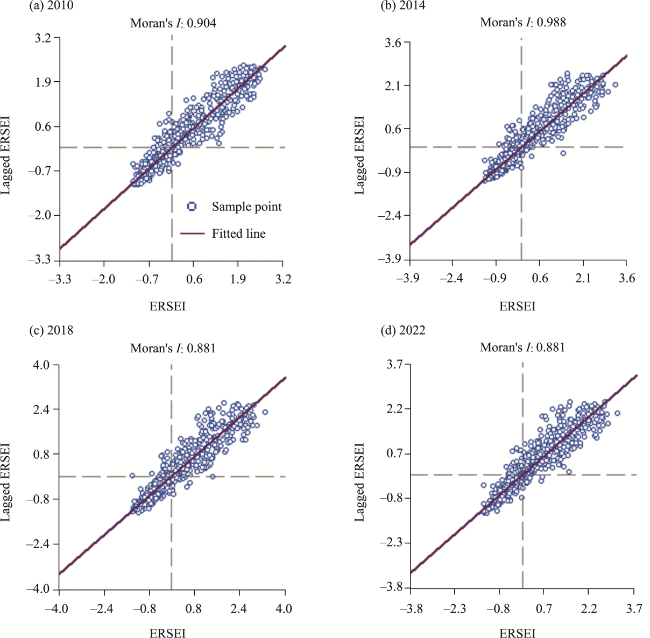
Fig. 8 Global Moran's I scatter plots for ERSEI in the Helan Mountain in 2010 (a), 2014 (b), 2018 (c), and 2022 (d)
This study analyzed the centroid migration trajectory of ERSEI in the study area during 2010-2022 (Table 6; Fig. 9). During this period, the ERSEI was higher in the southwest and lower in the northeast. The centroid consistently remained in the northern part of Huinong District, with only slight variations in latitude and longitude, and gradually shifted from the southwest to the northeast. The overall fluctuation in the direction angle was minimal, shifting from 40°00′00″ to 41°03′00″. The oblateness remained stable at approximately 0.66.
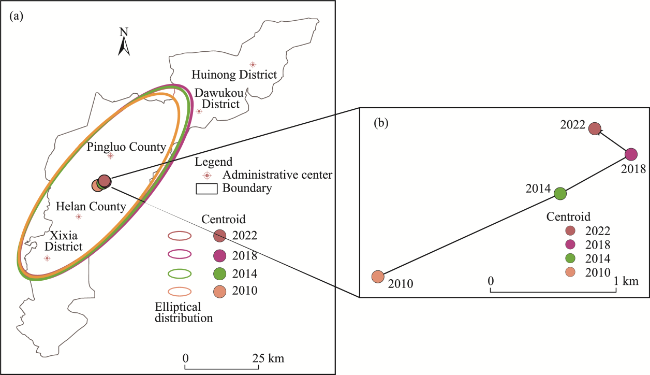
Fig. 9 Elliptical distributions and their corresponding centroids for ERSEI in the Helan Mountain in different years from 2010 to 2020 (a) and a closer view of the centroid migration trajectory of ERSEI (b)
Table 6 Centroid migration analysis of the ERSEI in the study area during 2010-2022
Year Latitude Longitude Angle Oblateness
2010 38°50′53″N 106°00′32″E 40°00′00″ 0.65
2014 38°51′14″N 106°01′19″E 40°34′48″ 0.66
2018 38°51′25″N 106°01′41″E 40°58′48″ 0.66
2022 38°51′32″N 106°01′30″E 41°03′00″ 0.66

3.5 Driving mechanism of ERSEI changes

NPP reflects the vegetation health and ecosystem productivity, while temperature and precipitation, as climate factors, directly influence plant growth and ecosystem stability. Population density measures the impact of human activities on the ecological environment, revealing the relationship between human development and ecological stress. Topographic factors, such as DEM, slope, and aspect, determine vegetation distribution, soil and water conservation, and climatic conditions within the study area. By comprehensively analyzing these factors, the driving mechanism behind ecological changes of the study area can be fully understood, providing a scientific basis for ecological protection and restoration.
As shown in Table 7, temperature had the greatest impact on ERSEI throughout the study period (average q-value of 0.603 and P<0.01), followed by DEM (average q-value of 0.590 and P<0.01), while population density had minimal impact (average q-value of 0.043 and P>0.05), primarily because population density in the study area is relatively low. During the study period, the influence of these driving factors fluctuated significantly, but the main factors remained largely consistent. In 2010, 2014, 2018, and 2022, temperature and DEM were the primary influencing factors, while the impact of precipitation gradually increased (average q-value of 0.588 and P<0.01).
Table 7 Impacts of various driving factors on ERSEI from 2010 to 2022
Driving factor 2010 2014 2018 2022 2010-2022
q-value P-value q-value P-value q-value P-value q-value P-value Average q-value rank
NPP 0.300 >0.05 0.580 >0.05 0.422 >0.05 0.420 >0.05 0.431 4
Temperature 0.662 <0.01 0.599 <0.01 0.579 <0.01 0.571 <0.01 0.603 1
Population density 0.063 >0.05 0.049 >0.05 0.030 >0.05 0.034 >0.05 0.043 7
Precipitation 0.649 <0.01 0.606 <0.01 0.541 <0.01 0.557 <0.01 0.588 3
DEM 0.657 <0.01 0.590 <0.01 0.559 <0.01 0.554 <0.01 0.590 2
Slope 0.217 >0.05 0.197 >0.05 0.191 >0.05 0.210 >0.05 0.204 5
Aspect 0.103 >0.05 0.118 >0.05 0.139 >0.05 0.136 >0.05 0.124 6

Note: q-value represents the explanatory power of each driving factor on ERSEI changes.

In addition, this study used the interaction detector to understand the interaction between variables, and the results are shown in Figure 10. In 2010, the interaction between DEM and aspect had the highest q-value of 0.718, indicating that their interaction had the greatest impact on ERSEI changes. In the years 2014, 2018, and 2022, the q-values for this interaction were 0.675, 0.668, and 0.656, respectively. The interaction between precipitation and aspect also maintained high q-values across the years, with values of 0.717 in 2010, 0.690 in 2014, 0.656 in 2018, and 0.659 in 2022. Overall, the ecological environment in the study area was shaped by the interaction of multiple factors. Among these, the interaction between DEM and aspect was the primary factor affecting ERSEI changes.
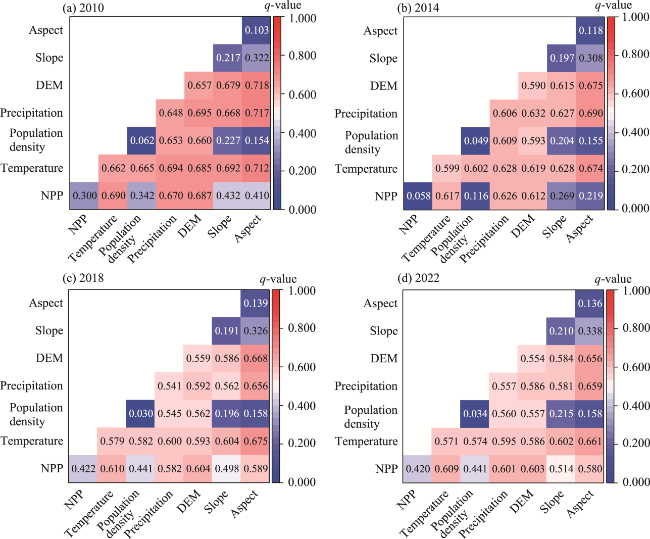
Fig. 10 Results of interaction detection showing the combined effects of any two driving factors on ERSEI changes in the Helan Mountain for 2010 (a), 2014 (b), 2018 (c), and 2022 (d)

4 Discussion

4.1 Advantages and applicability of ERSEI

Some scholars have proposed models for assessing ecological environment quality in the study area, including the RSEI (Xu, 2013) and the Improved Remote Sensing Ecological Index (IRSEI) (Feng et al., 2024). The RSEI model is mainly applicable to the urban area, while the Helan Mountain has little construction land and serious soil erosion, which results in the overall low NDBSI, reducing its representativeness. To address this, the ERSEI established in this study substituted the NDBSI with the SI, which can improve the accuracy of ERSEI in this context. Feng et al. (2024) integrated Particulate Matter 10 (PM10) into the RSEI to create an atmospheric environment quality model, the IRSEI, which has been employed to study the spatiotemporal changes of the ecological environment quality in the whole Ningxia, including the Helan Mountain. The IRSEI findings align with the ERSEI findings in terms of macroscopic spatial distribution, both presenting high values in the southwestern region and low values in the northeastern region. However, some discrepancies were still observed in localized areas. We did a detailed comparison between ERSEI and IRSEI (Table 8), using 169 key ecological restoration site data provided by Department of Natural Resources of Ningxia Hui Autonomous Region. When using the IRSEI, 87 sites were in the range of very poor ecology, while the number reached 101 when using the ERSEI. Optical satellite images showed that the 14 different sites were all located in waste mine construction sites. The ERSEI can better reflect the actual situation of the Helan Mountain, as it considers the impact of key factors such as LULC types and human activities on the ecological environment. The ERSEI values were lower in the ecologically poor areas such as construction sites and unused land.
Table 8 Ecological environment quality of 169 ecological restoration sites scaled by ERSEI and IRSEI
Index Ecological restoration sites
Very poor Poor Fair Good Excellent
ERSEI 101 49 10 6 3
IRSEI 87 50 20 8 4

Note: IRSEI, Improved Remote Sensing Ecological Index.

The study selected five ecological indicators closely related to the ecological environment to develop the ecological environment quality assessment index, ERSEI, which integrated comprehensive evaluations of ecological threats such as habitat fragmentation and land degradation. In contrast, RSEI primarily relies on physical properties like surface temperature and humidity, fails to address the functional differences in LULC types. ERSEI can identify and quantify potential threats within different ecosystems, enhancing its overall ecological quality assessment capability. However, the ecological environment in arid and semi-arid areas is extremely complex and comprehensive, shaped by a variety of factors, such as climate change and human activities. The interactions among these factors are complex and difficult to fully capture. In addition, local environmental characteristics such as microclimate and topography within the nature reserve also have impacts on the calculation results of the ecological index (Wang et al., 2021), which increases the complexity of the assessment. Therefore, accurately selecting environmental impact factors is the key to comprehensive quantitative evaluation of local ecological environment quality. In arid and semi-arid areas, the soil is impoverished and wind erosion is severe. Future research can consider disaster factors and salinity factors as ecological indices in predicting ecological environment changes.

4.2 Recommendations for future ecological restoration

The ERSEI in the study area decreased from 0.312 in 2010 to 0.298 in 2014, before gradually increasing. This trend aligns with the decrease in NDVI, as NDVI was the most significant contributing factor in the PCA results. The most notable growth of ERSEI occurred between 2018 and 2022, closely related to the ecological protection project implemented by the local government in 2017. This project restored 169 sites within the reserve, leading to significant improvements in ERSEI during this period (Fig. 11a). Areas with ecological environment quality improvements were mainly distributed in grassland and desert vegetation-covered regions, as well as in the human activity zones in the central part of the study area, covering an area of 1606.52 km2, accounting for 32.45% of the total study area.
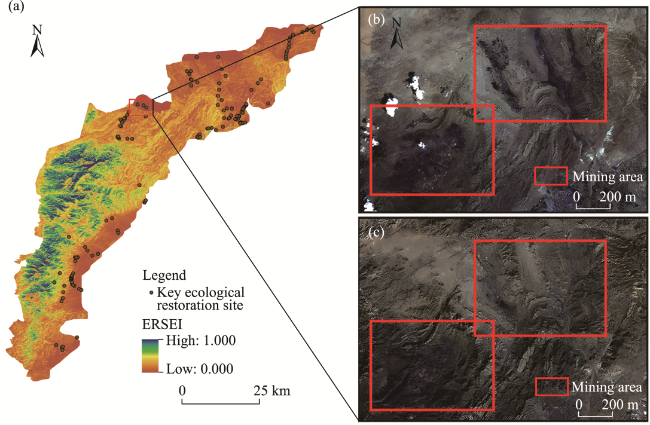
Fig. 11 Distribution of 169 key ecological restoration sites (a), Rujigou mine area based on GF-1 remote sensing image in 2013 (b), and Rujigou mine area based on GF-2 remote sensing image in 2021 (c). The distribution data of 169 key ecological restoration sites and high-resolution remote sensing imagery were provided by the Department of Natural Resources of Ningxia Hui Autonomous Region.
Our trend analysis of ERSEI revealed a two-phase ecological change in the Helan Mountain over the past 12 a, with 2017 making a significant turning point. Prior to 2017, issues such as coal seam spontaneous combustion and uncontrolled resource exploitation caused great disturbance and damage to the ecological environment. After 2017, the ecological environment quality has gradually improved, due to the implementation of ecological restoration project, including afforestation and artificial sowing of grass seeds. The closure of all open-pit coal mines also led to a significant increase in ERSEI from 2018 to 2022, which is consistent with the findings of Lin et al. (2022). This study also confirmed the importance of NDVI in ecological environmental improvement (Lin et al., 2022). The continuous increase of vegetation coverage may be a key factor in changing the local ecological environment quality. However, different LULC types and ecological issues should be treated differently. For instance, in construction areas and abandoned mining sites, the focus should be on soil restoration, vegetation reconstruction, and ecological closure to reduce surface exposure and prevent soil erosion. A combination of trees, shrubs, and grasses can enhance the stability and resilience of the ecosystem. In grasslands and areas severely affected by desertification, priority should be given to planting shrubs and herbaceous plants to increase vegetation coverage and reduce wind and water erosion. For wetlands and water conservation areas, it is crucial to implement ecological hydraulic engineering measures to maintain water supply, enhance the diversity of wetland vegetation, and sustain regional ecological balance (Wang et al., 2024).
The analysis of Moran's I index revealed that the spatial aggregation of ERSEI in the study area gradually weakened and stabilized over recent years. The stabilization of aggregation means that the spatial distribution pattern of ERSEI has reached a relatively balanced state, offering important reference and support for ecological protection, policy formulation, resource allocation, assessment of restoration measures, and scientific research. Furthermore, it indicated that these measures may be effective and can continue to be promoted and applied.
There is a deteriorating trend concentrating the Ruqigou mining area (largest mining area in the study area) and the southeastern part of the mountain. According to the spatial pattern of LULC in Ningxia, these deteriorating areas were basically concentrated on the development land of the reserve, which was the focus point of coal mining activities. Since the 1950s, mining enterprises in the Helan Mountain have expanded rapidly. The accompanied pollution and the tailings become the main reason for the relative deterioration of the ecological environment in these areas. Long et al. (2022) analyzed the impact of tailings ponds on soil, which aligns with the findings of this study. However, following the implementation of a series of ecological governance policies by the Ningxia government, the environment of the mining area has undergone significant changes from 2013 to 2021 (Fig. 11b and c). More damaged surfaces have gradually recovered, improving the local ecological environment quality to a certain extent, which also confirms the increasing trend of ERSEI in this region.
The application results of the Geodetector model showed that temperature, precipitation, and DEM remained the main driving factors affecting the ecological environment quality in the study area. The explanatory power of other factors was relatively low, consistent with the conclusions of Fu et al. (2024). In their study, they employed Soil-Adjusted Vegetation Index (SAVI) instead of NDVI and added the Normalized Difference Salinity Index (NDSI), concluding that precipitation and temperature were the main controlling factors influencing the ecological environment quality of Hami City, Xinjiang Uygur Autonomous Region. The ecological environment quality of Hami City and the Helan Mountain was influenced by different factors, reflecting the distinct characteristics of the natural environment and human activities in the two regions. In Hami City, temperature and precipitation are the primary determinants of ecosystem health, due to the region's arid climate and scarce water resources (Fei et al., 2022). However, the Helan Mountain has a complex topography, and DEM and slope directly affect vegetation type, coverage, soil conservation, and light conditions. DEM changes lead to variations in temperature, humidity, vegetation types, and vegetation coverage, while aspect determines the differences between sunny slopes (which receive more solar radiation, resulting in higher temperatures and faster evaporation) and shady slopes (which are relatively more humid). This can explain why the combined effect of DEM and aspect showed significance in the interaction detection for ERSEI.

5 Conclusions

This study developed the ERSEI based on multiple ecological indicators to evaluate the spatiotemporal variations of ecological environment quality in the Helan Mountain and identified its main driving factors during 2010-2022. The results showed that the ERSEI model, by incorporating multi-dimensional ecological indicators such as HQ and NDBSI, can more accurately capture ecological changes in complex surface environments. Geodetector analysis indicated that temperature, DEM, and precipitation were the primary factors affecting the ecological environment quality of the region. Additionally, validation data from 169 key ecological restoration sites further confirmed the precision of ERSEI in assessing local ecological environment quality. The findings of this study provide important theoretical support for the assessment and conservation of ecological environments in arid and semi-arid areas. By identifying key driving factors, the study offers essential guidance for policymakers in formulating regional ecological restoration and protection strategies, particularly in the context of increasing pressures from climate change and human activities. Future research could further integrate more detailed ecological data and optimize the model to expand the application scope of ERSEI, providing support for broader ecological environment monitoring.

Conflict of interest

The authors declare that they have no known competing financial interests or personal relationships that could have appeared to influence the work reported in this paper.

Acknowledgements

This research was funded by the Fujian Province's Foreign Cooperation Project in 2023 (2023I0047), the Fujian Provincial Natural Science Foundation Project (2023J011432, 2024J011195), the Ministry of Education's Supply-demand Docking Employment and Education Project (2024011223947), the Open Project Fund of Hunan Provincial Key Laboratory for Remote Sensing Monitoring of Ecological Environment in Dongting Lake Area (DTH Key Lab.2024-04, 2022-04), the Fujian Provincial Natural Science Foundation Guiding Project (2024Y0057), and the Fujian Province Social Science Plan Project (FJ2024BF071).

Author contributions

Conceptualization: CHEN Yuhang; Methodology: HE Yuanrong, ZHONG Liang; Formal analysis: LAI Yangfeng; Writing - original draft preparation: CHEN Yuhang; Writing - review and editing: ZHONG Liang; Funding acquisition: HE Yuanrong; Resources: ZHU Yunfei, ZHANG Ming, KANG Yuting, LUO Ming; Supervision: HE Yuanrong. All authors approved the manuscript.
[1]
Akhoondzadeh M. 2022. Advances in seismo-LAI anomalies detection within Google Earth Engine (GEE) cloud platform. Advances in Space Research, 69(12): 4351-4357.

[2]
Bai Z F, Han L, Liu H Q, et al. 2023. Spatiotemporal change and driving factors of ecological status in Inner Mongolia based on the modified remote sensing ecological index. Environmental Science and Pollution Research, 30(18): 52593-52608.

[3]
Chen Y G. 2023. Spatial autocorrelation equation based on Moran's index. Scientific Reports, 13(1): 19296, doi: 10.1038/s41598-023-45947-x.

[4]
Fei C, Dong Y Q, An S Z. 2022. Factors driving the biomass and species richness of desert plants in northern Xinjiang China. PLoS ONE, 17(7): e0271575, doi: 10.1371/journal.pone.0271575.

[5]
Feng Z X, She L, Wang X H, et al. 2024. Spatial and temporal changes of ecological environment quality in Ningxia based on improved remote sensing ecological indexes. Journal of Ecology and Environment, 33(1): 131-143. (in Chinese)

[6]
Fu K X, Jia G D, Yu X X, et al. 2024. Evaluation of ecological environment quality and analysis of driving mechanisms in Turpan-Hami region based on improved remote sensing ecological indices. Journal of Ecology, 44(9): 3911-3923. (in Chinese)

[7]
Hu K H, Zhang Z. 2021. Analysis of spatiotemporal characteristics and influencing factors of ecological quality in Liuba County, Qinling Mountains, Shaanxi. Journal of Ecology and Rural Environment, 37(6): 751-760. (in Chinese)

[8]
Jiang F, Zhang Y Q, Li J Y, et al. 2021. Research on remote sensing ecological environmental assessment method optimized by regional scale. Environmental Science and Pollution Research, 28(48): 68174-68187.

[9]
Li D J, Xu E Q, Zhang H Q. 2020. Influence of ecological land change on wind erosion prevention service in arid area of northwest China from 1990 to 2015. Ecological Indicators, 117: 106686, doi: 10.1016/j.ecolind.2020.106686.

[10]
Li J Y, Cui L B, Dou M, et al. 2021. Water resources allocation model based on ecological priority in the arid region. Environmental Research, 199: 111201, doi: 10.1016/j.envres.2021.111201.

[11]
Li Y L, Huang S P, Kong X L, et al. 2022. Ecological effects of surface water evolution in the Yellow River Delta. Sustainability, 14(20): 13544, doi: 10.3390/su142013544.

[12]
Liang L W, Xian L, Chen M X. 2022. Evolution trend and influencing factors of regional population and economy center in China since the reform and opening-up. Economic Geography, 42(2): 93-103. (in Chinese)

[13]
Lin Y M, Nan X X, Hu Z R, et al. 2022. Spatial and temporal changes of vegetation cover in typical ecologically fragile areas in northwest China and evaluation of its ecological security: A case study of Helan Mountain in Ningxia. Journal of Ecology and Rural Environment, 38(5): 599-608. (in Chinese)

[14]
Liu J, Ding J, Li L, et al. 2020. Characteristics of aerosol optical depth over land types in central Asia. Science of the Total Environment, 727: 138676, doi: 10.1016/j.scitotenv.2020.138676.

[15]
Liu J Y, Xu D W, Xu J. 2024a. Spatiotemporal evolution analysis of landscape pattern and habitat quality in the Puhe River Basin based on InVEST model. Journal of Soil and Water Conservation, 38(2): 258-267. (in Chinese)

[16]
Liu Y Z, Zhou T G, Yu W P. 2024b. Analysis of changes in ecological environment quality and influencing factors in Chongqing based on a remote-sensing ecological index mode. Land, 13(2): 227, doi: 10.3390/land13020227.

[17]
Long Z J, Zhu H, Bing H J, et al. 2022. Predicting soil cadmium uptake by plants in a tailings reservoir during 48-year vegetation restoration. Science of the Total Environment, 818: 151802, doi: 10.1016/j.scitotenv.2021.151802.

[18]
Lu G, Ümüt H, Lei S, et al. 2023. Multi-scenario dynamic prediction of ecological risk assessment in an arid area of northwest China. Ecological Indicators, 154: 110727, doi: 10.1016/j.ecolind.2023.110727.

[19]
Luo R J, Wang H T, Wang C. 2023. Ecological quality evaluation of Gulang County in Gansu Province based on improved remote sensing ecological index. Arid Land Geography, 46(4): 539-549. (in Chinese)

[20]
Ma D L, Huang Q J, Zhang Q, et al. 2024. Evaluation of eco-environmental quality and analysis of driving forces in the Yellow River Delta based on improved remote sensing ecological indices. Stochastic Environmental Research and Risk Assessment, 38(8): 3199-3220.

[21]
Peng X F, Zhang S Q, Peng P H, et al. 2023. Unraveling the ecological tapestry: A comprehensive assessment of Changtang Nature Reserve's ecological and environmental using RSEI and GEE. Land, 12(8): 1581, doi: 10.3390/land12081581.

[22]
Shi H, Shi T, Liu Q, et al. 2021. Ecological vulnerability of tourism scenic spots: Based on remote sensing ecological index. Polish Journal of Environmental Studies, 30(4): 3231-3248.

[23]
Shi M, Lin F, Jing X, et al. 2023. Ecological environment quality assessment of arid areas based on improved remote sensing ecological index: A case study of the Loess Plateau. Sustainability, 15(18): 13881, doi: 10.3390/su151813881.

[24]
Srivastava P K, Pandey P C, Petropoulos G P, et al. 2019. GIS and remote sensing aided information for soil moisture estimation: A comparative study of interpolation techniques. Resources, 8(2): 70, doi: 10.3390/resources8020070.

[25]
Tariq A, Sardans J, Zeng F, et al. 2024. Impact of aridity rise and arid lands expansion on carbon-storing capacity, biodiversity loss, and ecosystem services. Global Change Biology, 30(4): e17292, doi: 10.1111/gcb.17292.

[26]
Thompson D R, Babu K N, Braverman A J, et al. 2019. Optimal estimation of spectral surface reflectance in challenging atmospheres. Remote Sensing of Environment, 232: 111258, doi: 10.1016/j.rse.2019.111258.

[27]
Tillé Y, Dickson M M, Espa G, et al. 2018. Measuring the spatial balance of a sample: A new measure based on Moran's I index. Spatial Statistics, 23: 182-192.

[28]
Wang J, Liu D W, Ma J L, et al. 2021. Development of a large-scale remote sensing ecological index in arid areas and its application in the Aral Sea Basin. Journal of Arid Land, 13(1): 40-55.

[29]
Wang J, Wang J, Xu J Q. 2023a. Spatio-temporal variation and prediction of ecological quality based on remote sensing ecological index: A case study of Zhanjiang City, China. Frontiers in Ecology and Evolution, 11: 1153342, doi: 10.3389/fevo.2023.1153342.

[30]
Wang X F, Gong L, Luo Y, et al. 2024. Phylogenetic diversity drives soil multifunctionality in arid montane forest-grassland transition zone. Frontiers in Plant Science, 15: 1344948, doi: 10.3389/fpls.2024.1344948.

[31]
Wang Y F, Cheng L L, Zheng Y. 2023b. An adjusted landscape ecological security of cultivated land evaluation method based on the interaction between cultivated land and surrounding land types. Land, 12(4): 833, doi: 10.3390/land12040833.

[32]
Willis K S. 2015. Remote sensing change detection for ecological monitoring in United States protected areas. Biological Conservation, 182: 233-242.

[33]
Xu B W, Liu H, Wang J M, et al. 2024. Ecological design approach for urban green space in arid and semi-arid areas in Northwest China based on habitat and vegetation characteristics thereof. Landscape Architecture, 31(6): 12-18. (in Chinese)

[34]
Xu H Q. 2013. A remote sensing urban ecological index and its application. Acta Ecologica Sinica, 33(24): 7853-7862. (in Chinese)

[35]
Yang X Y, Dong Y P. 2020. Multiple phases of deformation in the southern Helanshan tectonic belt, northern China. Journal of Asian Earth Sciences, 201: 104497, doi: 10.1016/j.jseaes.2020.104497.

[36]
Yu M Y, Xu Y, Li J Q, et al. 2021. Geographic detector-based spatiotemporal variation and influence factors analysis of PM2.5 in Shandong, China. Polish Journal of Environmental Studies, 30(1): 463-475.

[37]
Yulianti M, Kusmana C, Setiawan Y, et al. 2024. Analysis of land cover change in Sagara Anakan Cilacap, Central Java using principal component analysis (PCA). IOP Conference Series: Earth and Environmental Science, 1315(1): 012046, doi: 10.1088/1755-1315/1315/1/012046.

[38]
Zhang W, Du P J, Guo S C, et al. 2023. Enhanced remote sensing ecological index and ecological environment evaluation in arid area. National Remote Sensing Bulletin, 27(2): 299-317. (in Chinese)

[39]
Zhao X, Wang P, Yasir M, et al. 2022. Decision support system based on spatial and temporal pattern evolution of ecological environmental quality in the Yellow River Delta from 2000 to 2020. Soft Computing, 26(20): 11033-11044.

Outlines

/