Research article

Impact of land use change on carbon storage in the middle reaches of the Yellow River, China

  • SHI Xiaoliang 1 ,
  • ZHANG Jie , 1, * ,
  • LIU Simin 2 ,
  • DING Hao 1 ,
  • CHEN Xi 1 ,
  • WANG Li 1 ,
  • ZHANG Dan 1
Expand
  • 1College of Geomatics, Xi'an University of Science and Technology, Xi'an 710054, China
  • 2China National Forestry-Grassland Development Research Center, Beijing 100714, China

Received date: 2024-08-24

  Revised date: 2024-12-17

  Accepted date: 2025-01-07

  Online published: 2025-08-12

Abstract

The implementation of long-term shelterbelt programs in the middle reaches of the Yellow River (MRYR), China not only has improved the overall ecological environment, but also has led to the changes of land use pattern, causing carbon storage exchanges. However, the relationship between carbon storage and land use change in the MRYR is not concerned, which results in the uncertainty in the simulation of carbon storage in this area. Land use changes directly affect the carbon storage capacity of ecosystems, and as an indicator reflecting the overall state of land use, land use degree has an important relationship with carbon storage. In this study, land use data and the integrated valuation of ecosystem services and trade-offs (InVEST) model were used to assess the trends in land use degree and carbon storage in the MRYR during 1980-2020. The potential impact index and the standard deviation ellipse (SDE) algorithm were applied to quantify and analyze the characteristics of the impact of land use changes on carbon storage. Subsequently, land use transitions that led to carbon storage variations and their spatial variations were determined. The results showed that: (1) the most significant periods of carbon storage changes and land use transitions were observed during 1990-1995 and 1995-2020, with the most changed areas locating in the east of Fenhe River and in northwestern Henan Province; (2) the positive impact of land use degree on carbon storage may be related to the environmental protection measures implemented along the Yellow River, while the negative impact may be associated with the expansion of construction land in plain areas; and (3) the conversion of other land use types to grassland was the primary factor affecting carbon storage changes during 1980-2020. In future land use planning, attention should be given to the direction of grassland conversion, and focus on reasonably limiting the development of construction land. To enhance carbon storage, it will be crucial to increase the area of high-carbon-density land types, such as forest land and grassland under the condition that the area of permanent farmland does not decrease.

Cite this article

SHI Xiaoliang , ZHANG Jie , LIU Simin , DING Hao , CHEN Xi , WANG Li , ZHANG Dan . Impact of land use change on carbon storage in the middle reaches of the Yellow River, China[J]. Journal of Arid Land, 2025 , 17(2) : 167 -181 . DOI: 10.1007/s40333-025-0007-9

1 Introduction

Global warming is a major environmental challenge facing human, primarily driven by the large- scale emission of greenhouse gases, particularly carbon dioxide (Shen et al., 2020). In response to this challenge, reducing greenhouse gas emission and increasing carbon storage have become key objectives in global climate governance (Fang et al., 2015). Long-term implementation of shelterbelt programs in China has significantly contributed to carbon storage through large-scale afforestation and ecological restoration, which plays a crucial role in mitigating climate change (Piao et al., 2012). However, while these shelterbelt programs have provided ecological benefits, they have also inevitably resulted in changes to the underground surface properties, which have subsequently influenced carbon storage, and these changes in underground surface properties are primarily driven by land use changes (Sasmito et al., 2019). Therefore, studying the impact of land use changes on carbon storage has become particularly important.
Research on the impact of different land use patterns on carbon storage primarily encompasses the influences of individual ecosystem and limited land use types (Toru and Kibret, 2019; Kothandaraman et al., 2020). Methods commonly used for assessing carbon storage in individual ecosystem and small study areas include average biomass, biomass regression equation, volume- derived approaches, and continuous methods utilizing conversion factors (Sun and Liu, 2020). For a large study area, ecological models are often used to evaluate the comprehensive carbon storage. Due to the simple operation, which can directly realize the visualization of carbon storage in space, the integrated valuation of ecosystem services and trade-offs (InVEST) model has been extensively utilized in recent years for the studies related to carbon storage (Zhao et al., 2019; Zhu et al., 2021).
Research findings indicate that factors causing carbon storage change as a result of land use change include the increase of impervious surface (Wang et al., 2022), the growth of construction land (Jiang et al., 2024), and the reciprocal conversion among cultivated land, grassland, and forest land (Yang et al., 2014). The transition of forest land typically results in carbon loss, whereas the conversion of grassland and cultivated land may yield uncertain outcomes (Liu et al., 2021). Land use degree can serve as an indicator of the overall status of land utilization at the regional level (Feng et al., 2023), and effectively represents the complexity of land use change. Therefore, the relationship between land use degree and carbon storage has been assessed in many previous studies. Methods for analyzing the relationship between land use degree and carbon storage commonly include the Moran's I index and the potential impact (PI) index. Previous results show that a significant negative correlation between land use degree and carbon storage has been identified by the Moran's I index (Zhang et al., 2023a). Other studies showed that as land use degree increased, carbon storage exhibited a downward trend, indicating a negative relationship between them (Xiang et al., 2022). Nevertheless, the results of recent studies on land use, carbon storage, and PI showed that carbon storage increased as land use decreased, while PI remained negative (Chen et al., 2023). Although the relationship between land use and carbon storage has been explored, the quantitative effects on specific spatial scales and the spatial characteristics of these influences have not been thoroughly explained.
As one of the ecologically fragile areas in China, the middle reaches of the Yellow River (MRYR) has implemented a series of shelterbelt programs. Although the implementation of these shelterbelt programs has improved the ecological environment, it has also promoted the changes in land use patterns, leading to carbon exchange. Therefore, studying the impact of land use degree on carbon storage is crucial for regional land use planning and enhancing carbon storage. In this study, the trends of land use change and carbon storage were analyzed, and the impact of land use degree on carbon storage was evaluated using PI index. The distribution range and transfer direction of positive and negative PI were analyzed using the standard deviation ellipse (SDE) algorithm, and the dominant factors of land use change in areas with significant PI changes were identified using the mixed geographically weighted regression (MGWR) model. Subsequently, land use conversion that led to changes in carbon storage was clarified. This study aims to: (1) investigate changes in land use types and carbon storage; (2) calculate the PI of land use degree on carbon storage and clarify the directional characteristics of PI; and (3) identify the reasons leading to carbon storage changes in areas with significant PI changes.

2 Materials and methods

2.1 Study area

The MRYR is the section of the Yellow River Basin between Hekou Town in Inner Mongolia Autonomous Region and Taohuayuan region in Henan Province (33°39′-40°35′N, 103°53′- 113°41′E; Fig. 1), with a total area of 3.44×10⁵ km2. The climate of the study area is arid, semi-arid, and semi-humid (Shi et al., 2023). The annual precipitation in the basin ranges from 300 to 800 mm, with uneven spatial and temporal distribution (Tang et al., 2023). The soil in the MRYR is loose, primarily characterized by loess landforms, with strong precipitation infiltration (Zhang et al., 2023b). The main vegetation types in the basin include coniferous forest, cultivated vegetation, and broad-leaved forest. Geomorphic types of the MRYR include plains, tablelands, hills, and mountains. Land use types primarily consist of grassland, forest land, and cultivated land. Most cultivated land is distributed in plain and tableland, grassland is mainly distributed in hills, and forest land is primarily located in mountainous areas. Due to the fragile ecological environment, various shelterbelt programs have been implemented within the basin, causing notable changes in land use patterns.
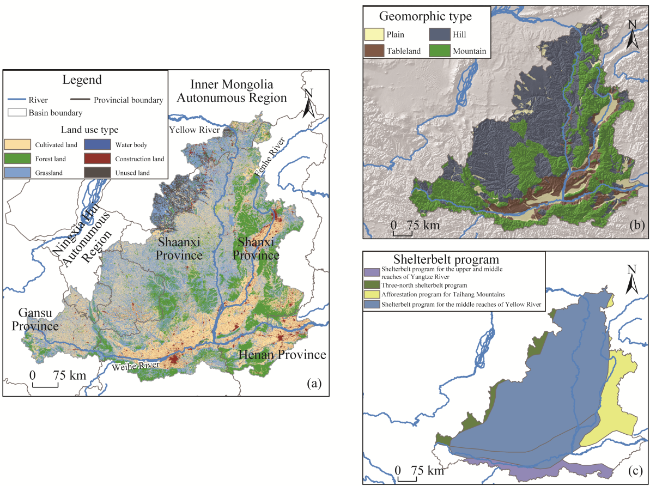
Fig. 1 Land use type (a), geomorphic type (b), and implemented shelterbelt program (c) in the middle reaches of the Yellow River (MRYR), China. The images (land use type, geomorphic type, shelterbelt program, and other basic geographic features) are sourced from the Data Center for Resources and Environmental Sciences of Chinese Academy of Sciences (http://www.resdc.cn). The map of the MRYR is sourced from the National Earth System Science Data Center (http://www.geodata.cn) and the boundary has not been modified.

2.2 Materials

The data include land use, precipitation, temperature, gross domestic product (GDP), land use and cover change of China, and digital elevation model (DEM) (Table 1).
Table 1 Detailed information of data
Data Year Resolution Resource
Land use 1980, 1990, 1995, 2000, 2005, 2010, 2015, and 2020 30 m 1
GDP 1 km, yearly 2
Precipitation 1 km, monthly 3
Temperature 1 km, monthly 3
Land use and cover change dataset of China (Yu et al., 2022) 1990, 1995, and 2000 1 km, yearly 4
DEM - 30 m 1
Shelterbelt program - Shape file 1
Geomorphic type - Shape file 1

Note: GDP, gross domestic product; DEM, digital elevation model; Resource 1, Data Center for Resources and Environmental Sciences of Chinese Academy of Sciences (http://www.resdc.cn); Resource 2, National Bureau of Statistics; Resource 3, National Tibetan Plateau Data Center (https://data.tpdc.ac.cn/); Resource 4, National Oceanic and Atmospheric Administration (https://www.nesdc.org.cn). ''-'' means no value.

2.3 Methods

2.3.1 Land use degree (LUD)

LUD is used to measure the integrated extent of regional land utilization, and the equation is as follows:
L U D = 100 × i = 1 n A i × P i,
where Ai is the ith classification index, in which forest land, water body, and grassland are level 2, cultivated land is level 3, construction land and unused land are level 4; Pi is the percentage of total area occupied by the ith land use type (%); and n is the total number of land use types. LUD usually is in the range of 100-400. The fishnet tool was employed to grid land use data and determine land use degree in every unit. The increase of land use degree indicates that land use is improved and developed, while the decrease indicates that land use is in the stage of adjustment (Xu et al., 2020).

2.3.2 Carbon storage estimation method

Calculation of carbon storage (Ci) in terrestrial ecosystems considers four components in the InVEST model and the equation is as follows:
C i = C a b o v e + C b e l o w + C s o i l + C d e a d,
where Cabove is the above-ground biomass (t/hm2); Cbelow is the below-ground biomass (t/hm2); Csoil is the soil organic matter (t/hm2); and Cdead is the dead organic matter (t/hm2). Due to the minimal of contribution from dead organic matter and challenging for obtaining, it was not considered in calculating carbon storage.
Carbon density data for each land use type were obtained from previous studies conducted in similar or adjacent areas (Zhuang and Liu, 1997; Xie et al., 2004; Zhang et al., 2018). Since carbon density is influenced by regional climate conditions, it is necessary to adjust the data using a correction formula based on the actual precipitation and temperature conditions of the MRYR (Alam et al., 2013). The equations are as follows:
C B P = 6.798 × e 0.0054 × M A P,
C B T = 28 × M A T + 398,
C S P = 3.3968 × M A P + 299.61,
K B P = C B P 1 C B P 2,
K B T = C B T 1 C B T 2,
K B = K B P × K B T,
K S = C S P 1 C S P 2,
where CBP is the biomass carbon density (t/hm2); MAP is the annual mean precipitation (mm); e is the natural logarithm; MAT is the mean annual temperature (℃); CBT is the biomass carbon density (t/hm2) corrected by MAT; CSP is the soil carbon density (t/hm2) obtained using MAP; KBP is the correction coefficient obtained based on MAP; C B P 1and C B P 2are the biomass carbon density corrected by MAP of the MRYR (t/hm2) and China (t/hm2), respectively; KBT is the correction coefficient obtained based on MAT; C B T 1 and C B T 2are the biomass carbon density corrected by MAT of the MRYR (t/hm2) and China (t/hm2), respectively; KB is the correction coefficient for biomass carbon density; KS is the correction coefficient for soil carbon density; and C S P 1and C S P 2 are the soil carbon density corrected by MAT of the MRYR (t/hm2) and China (t/hm2), respectively (Table 2).
Table 2 Corrected carbon density of the middle reaches of the Yellow River (MRYR)
Index Cultivated land Forest land Grassland Water body Construction land Unused land
(t/hm2)
Cabove 0.57 4.25 3.54 0.30 0.25 0.13
Cbelow 8.09 11.62 8.67 0.00 0.00 0.00
Csoil 10.69 15.66 9.85 0.00 0.00 2.13

Note: Cabove, Cbelow, and Csoil are the above-ground biomass, below-ground biomass, and soil organic matter, respectively.

2.3.3 PI index

PI index can be used to characterize the relationship between carbon storage and land use degree. The equation is as follows (Chen et al., 2023):
P I = L x × C y C x C x × L y L x,
where Lx is the land use degree in the initial stage; Cy is the carbon storage in the final stage (t/hm2); Cx is the carbon storage in the initial stage (t/hm2); and Ly is the land use degree in the initial stage. Positive PI indicates that the effect of land use degree on carbon storage is positive, and the higher the value, the more pronounced the effect.
Standard deviation ellipse (SDE) algorithm is a method to summarize the directional characteristics of point-like geographical elements and the calculation is as follows:
C = v a r x c o v x , y c o v y , x v a r y = 1 n i = 1 n x i x ¯ 2 i = 1 n x i x ¯ y i y ¯ i = 1 n y i y ¯ x i x ¯ i = 1 n y i y ¯ 2,
d e t ( C λ I ) = 0,
r 1 = λ 1,
r 2 = λ 2,
θ = 1 2 t a n 1 2 × c o v ( x , y ) v a r ( x ) var ( y ),
where C is the covariance matrix used to calculate SDE; (x) and (y) are the coordinates; (xi, yi) is the coordinates of the ith feature; ( x ¯ , y ¯) is the mean center of the ith feature; λ is the eigenvalue; I is the identity matrix; r1 is the semi-major axis of the ellipse; r2 is the semi-minor axis of the ellipse; λ1 and λ2 are eigenvalues calculated using Equation 12; and θ is the rotation angle of the ellipse.
SDE was used to analyze the directional characteristics of PI in this study. The distribution range of SDE represents the main impact areas, and the centroid represents the relative position of PI in spatial. The major axis of SDE represents the principal direction of data distribution, while the minor axis indicates the spread.

2.3.4 MGWR model

MGWR model can better capture local spatial effects in data, allowing explanatory variables to vary spatially (Fotheringham et al., 2017). MGWR model was used to analyze the drivers of land use degree in areas where PI changed significantly, and it was calculated as follows:
w i = β + 0 i j = 1 p β i j × x i j + ε i,
where wi is the response variable; β0i is the intercept; p is the number of independent variables; βij is the coefficient of the explanatory variable xij; and εi is the error term.

3 Results

3.1 Temporal variation of carbon storage and land use types

Annual total carbon storage in the MRYR was 7408.60×105 Mg, with an average of 2155.52 Mg/km2 in 1980. Both total carbon storage and mean carbon storage showed an increasing trend during 1980-1990, decreased during 1990-1995, reached the largest carbon storage in 2000, and then continued decreasing during 2000-2020 (Fig. 2a).
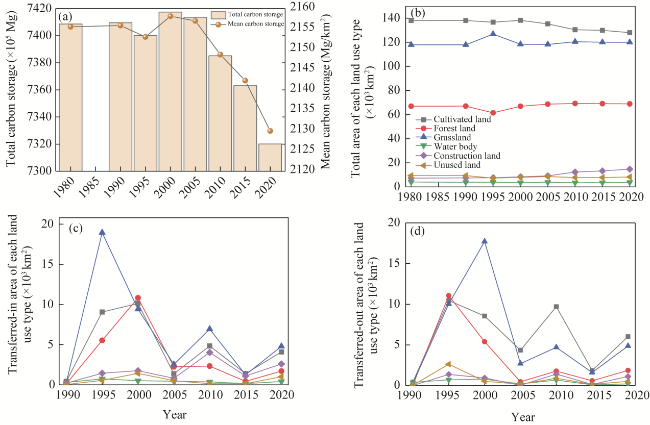
Fig. 2 Temporal variations of carbon storage and land use types. (a), total and mean carbon storage; (b), total area of each land use type; (c), transferred-in area of each land use type; (d), transferred-out area of each land use type.
Forest land, grassland, and cultivated land were the main land use types in the MRYR during 1980-2020. Land use changes were primarily characterized by a decrease in cultivated land area and an increase in construction land area during this period (Fig. 2b). During 1990-2005, the transfer of cultivated land was relatively active. For example, the areas of cultivated land transferred into other land use types and other land use types transferred into cultivated land were 9055 and 10,460 km2, respectively. During 1995-2000, the area of cultivated land transferred in continued to increase by 10,128 km2, while the area transferred out decreased significantly to 8545 km². During 2000-2005, the area of cultivated land transferred out exceeded that of transferred in, and the total area of cultivated land continuously decreased from 2000 onward. The area of forest land fluctuated during 1990-2000. During 1990-1995, the area of forest land transferred in was less than that of transferred out, while during 1995-2000, the area transferred in was greater than that of transferred out. Overall, the total area of forest land slightly increased during 1980-2000. The area of grassland increased significantly by 8910 km2 during 1990-1995, followed by a decrease of 8302 km2 during 1995-2000. This change showed an opposite trend compared with forest land area. Overall, the grassland area also slightly increased during 1980-2000. The area of water bodies showed little change and remained relatively stable. The area of construction land continued to increase, with the largest growth occurring in 2005 and 2010. The area of unused land slightly decreased, with little overall change (Fig. 2c and d).

3.2 Spatial variation of land use degree and carbon storage

Spatial variation in land use degree and carbon storage in the MRYR is shown in Figure 3. Significant changes in land use degree and carbon storage occurred during 1990-1995 and 1995-2000. During 1990-1995, land use degree in most parts of Inner Mongolia Autonomous Region exhibited a declining trend, while carbon storage mainly displayed an upward pattern. In Shaanxi Province, Gansu Province, and Ningxia Hui Autonomous Region, land use degree and carbon storage exhibited significant spatial heterogeneity. The areas with the most dramatic changes in land use degree were primarily located in the hilly regions at the border of Ningxia Hui Autonomous Region and Gansu Province, the hilly regions at the border of Shaanxi Province and Inner Mongolia Autonomous Region, the tableland areas in northern Shaanxi Province, and the plains along the Weihe River. The hilly regions at the border of Shaanxi Province and Inner Mongolia Autonomous Region and the plains along the Weihe River mainly exhibited an upward trend in carbon storage, while other areas primarily underwent a decreasing pattern in carbon storage. In Shanxi Province, land use degree in the east of the Fenhe River showed a significant increasing trend, whereas in the south of the Yellow River in Henan Province, land use degree showed a significant decreasing trend, with carbon storage mainly decreasing in these areas. During 1995-2000, the areas with significant changes in land use degree were primarily concentrated in the south of the Weihe River and east of the Yellow River. In most of these areas, the trends in land use degree and carbon storage were opposite to those observed during 1990-1995. There were also notable changes in the spatial distribution of land use during 2010-2015. In this interval, carbon storage in the MRYR predominantly demonstrated a decreasing trend, characterized by a dispersed distribution pattern, without large-scale aggregated changes. During 1980-2020, the main change areas of land use degree shifted gradually from the eastern to the western parts of the MRYR.
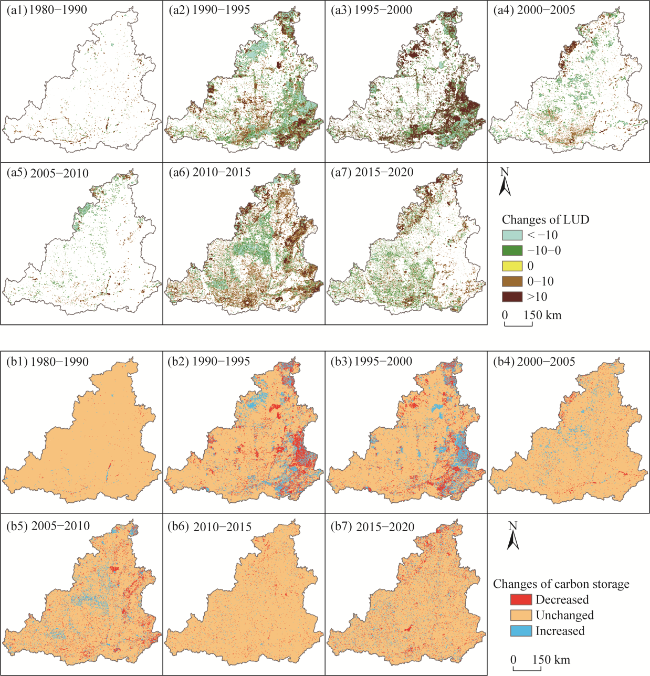
Fig. 3 Spatial variations of land use degree (LUD; a1-a7) and carbon storage (b1-b7) in the MRYR during 1980-1990, 1990-1995, 1995-2000, 2000-2005, 2005-2010, 2010-2015, and 2015-2020
To better understand the significant changes in carbon storage during 1990-1995 and 1995-2000, we examined land use transfer patterns in the basin where these carbon storage changes occurred (Fig. 4). The transfer of grassland during 1990-1995 occurred mainly in the east of the Fenhe River and northern Shaanxi Province, which increased carbon storage in the MRYR by 9.43×10⁶ t and decreased by 11.99×10⁶ t, respectively (Fig. 4). The transfer of cultivated land and forest land mainly occurred in the northwest of Henan Province. The transfer of forest land increased carbon storage by 7.29×10⁶ t, while the transfer of cultivated land increased carbon storage by 1.84×10⁶ t and decreased it by 4.87×10⁶ t. The transfer of construction land mainly occurred in the area along the Weihe River, which reduced carbon storage in the MRYR by 7.40×10³ t. Land use patterns in the MRYR underwent significant changes again during 1995-2000. Large areas of other land use types were converted to forest land and cultivated land in the east of the Fenhe River, and were converted to grassland in the northwest of Henan Province. The continued expansion of construction land led to a reduction in carbon storage by 11.10×10³ t. Overall, during 1980-2020, the changes in carbon storage were mainly driven by the transfer of grassland and the expansion of construction land. The transferred-in of grassland mainly occurred in the western MRYR, while the expansion of construction land mainly took place along the edges of cities.
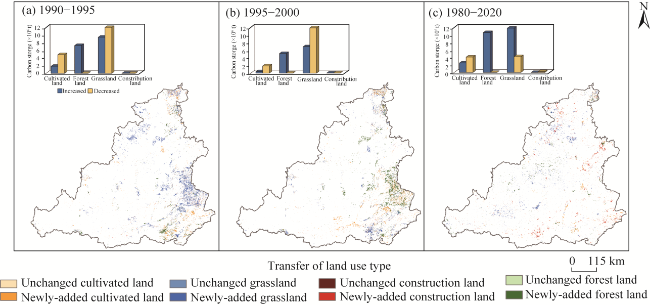
Fig. 4 Changes in major land use types and their impacts on carbon storage in the MRYR during 1990-1995 (a), 1995-2000 (b), and 1980-2020 (c)

3.3 PI of land use degree on carbon storage

3.3.1 Spatiotemporal variation of PI

Statistical results of PI for the basin during 1980-2020 are shown in Figure 5. During 1980-1995, PI exhibited a decreasing tendency. During 1995-2010, PI continued to increase. However, during 2010-2020, PI was negative, indicating a shift from a positive to a negative impact of land use degree on carbon storage, with the negative impact continually strengthening.
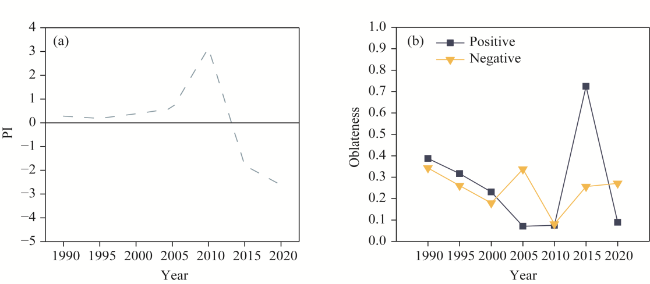
Fig. 5 Temporal variation of potential impact (PI). (a), trend of PI; (b), oblateness of standard deviation ellipse (SDE)
Spatial heterogeneity of PI is shown in Figure 6. In 1990, there were only a few areas with PI less than -0.1, primarily clustered in the southern part of the MRYR. In 1995, spatial distribution of PI exhibited clustering characteristics, with numerous areas of negative PI across the basin. Areas with PI less than -0.1 were mainly distributed in the hilly regions in the northwest and mountains in the southeast of the MRYR, the hilly regions, plains, and tablelands in the central part of Shaanxi Province, and the hilly areas in northeastern Gansu Province. Areas with PI greater than 0.1 were primarily situated in the mountains of eastern Yellow River. In 2000, areas with PI less than -0.1 decreased, and the overall spatial distribution was similar to that in 1995. In 2005, areas with PI less than -0.1 were primarily distributed in the hilly regions in eastern Gansu Province, southern Inner Mongolia Autonomous Region, and northern Shaanxi Province. During 2005-2010, land use degree changed little, and spatial distribution of PI was not particularly pronounced. In 2015, areas with PI less than -0.1 appeared around some urban areas. In 2020, areas with PI less than -0.1 increased, primarily situated in the hilly regions of Gansu Province and Inner Mongolia Autonomous Region, the plains of Shaanxi and Shanxi provinces, and the mountainous areas of Henan Province.
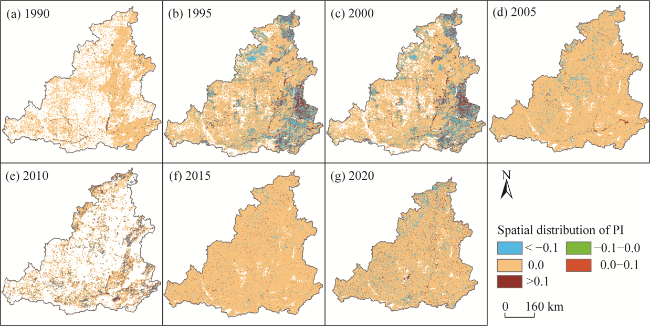
Fig. 6 Spatial distribution of PI in the MRYR in 1990 (a), 1995 (b), 2000 (c), 2005 (d), 2010 (e), 2015 (f), and 2020 (g)

3.3.2 Directional characteristics of PI

There has been a noteworthy shift in the distribution range of the impact of land use degree on carbon storage during 1990-2020 (Fig. 7). During 1980-2000, the distribution range of positive PI was smaller than negative, while during 2005-2020, the range of positive PI was larger than that of negative PI. Directional characteristics of positive PI were quite evident in 1990, 1995, 2000, and 2015, while those of negative PI were relatively noticeable in 1990, 2005, 2015, and 2020. The gravity center for negative PI was primarily located near the confluence of the Weihe River, Yellow River, and Fenhe River, while positive PI was mainly situated in the region between the Yellow River and Fenhe River.
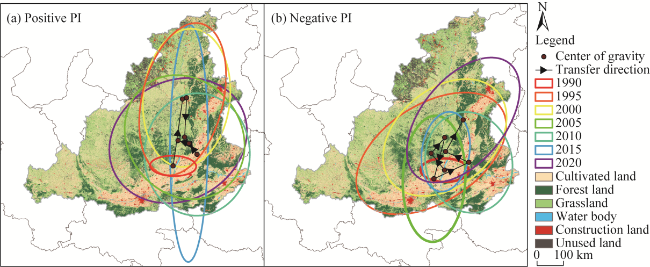
Fig. 7 Directional characteristic of positive PI (a) and negative PI (b)
Regions of both positive and negative PI were located near the junction of the Fenhe River and the Yellow River in 1990, with the difference that positive PI extended further to the west. In 1995, regions with positive PI were mostly situated in northern Shaanxi and western Shanxi provinces, with a ''north-south'' distribution pattern that aligned with the orientation of the Yellow River. In these regions with positive PI, the primary land use types were forest land, grassland, and cultivated land. Conversely, regions with negative PI aligned with the distribution of plains, primarily following a ''northeast-southwest'' direction.
In 2000, directional characteristics had weakened, and the intensity of both positive and negative PI was relatively lower than that of 1995. In 2005, distribution range of positive PI was mainly located in eastern Shaanxi and western Shanxi provinces, covering most of the mountainous and plain areas, although directional characteristics were not very distinct. Distribution range of negative PI was primarily concentrated in southern part of the MRYR, with its gravity center near the confluence of the Weihe River, Yellow River, and Fenhe River. In 2010, directional characteristics of both positive and negative PI became less distinct, distributing primarily in southeastern part of the MRYR. Gravity center was located in the plains of Shanxi Province, and distribution range of positive PI was notably larger than that of negative PI. In 2015, direction of positive PI was north-south, aligning with the course of the Yellow River. Gravity center of negative PI was located at the confluence of the Fenhe River and Yellow River. In 2020, distribution range of positive PI covered most of the MRYR. Principal direction of negative PI was northeast-southwest, aligning with the course of the Fenhe River and the plain of Shanxi Province. By comparing directional characteristics of positive and negative PI, we found that the range of positive PI concentrated on forest land, grassland, and cultivated, aligning with the direction of the Yellow River. This result suggests a strong association between the Yellow River and positive PI. However, the range of negative PI was related to plains.

3.4 Dominant factors of land use degree

Significant land use changes occurred during 1990-1995 and 1995-2000, resulting in notable fluctuations in carbon storage. To analyze the driving factors behind land use changes and carbon storage variations, we selected the following factors: natural factors (slope, aspect, precipitation, and temperature), socioeconomic factors (GDP), and policy factor (change in forest land cover proportion) (Fig. 8). During 1990-1995, slope-driven land use changes were primarily concentrated in the Weihe River and southern Henan Province, involving conversions between forest land, grassland, and cultivated land. Precipitation and temperature facilitated conversions among cultivated land, forest land, and grassland in Henan and Shanxi provinces. GDP primarily drove the conversion of grassland to forest land in Henan Province and forest land to grassland in Shanxi Province. Policy impact was mainly observed along the Weihe River and in parts of Shanxi and Henan provinces, promoting the conversion of cultivated land to grassland and forest land.
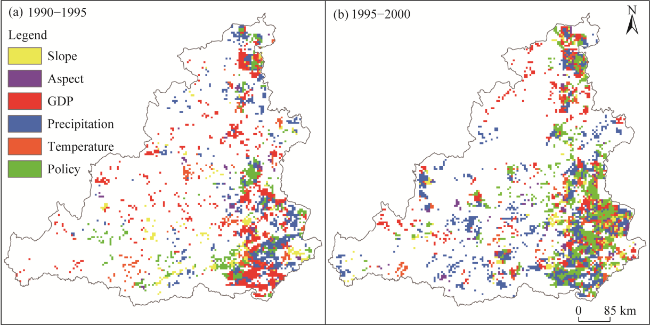
Fig. 8 Dominant factor of land use degree during 1990-1995 (a) and 1995-2000 (b). GDP, gross domestic product.
During 1995-2000, slope-driven changes shifted to southwestern Shanxi Provnice, promoting the conversion of grassland to forest land. Meanwhile, the influence of precipitation strengthened, significantly contributing to forest land expansion. Although the impact of GDP weakened, it still drove localized conversions among land use types in Henan and Shanxi provinces, leading to mutual changes among cultivated land, forest land, and grassland. Policy impact was primarily concentrated in northeastern MRYR, as well as in Henan and Shanxi provinces, contributing to the conversions among cultivated land, grassland, and forest land.

4 Discussion

During 1980-2020, significant changes in land use types were observed in the MRYR, primarily characterized by the conversions among forest land, grassland, and cultivated land, as well as the expansion of construction land (Cheng and Chen, 2024). The intensive implementation of shelterbelt programs was occurred in the MRYR during 1980-2000 and the primary changes during this time involved the mutual conversions among forest land, grassland, and cultivated land, with the conversion of grassland being particularly active (Huang et al., 2022). The conversion into cultivated land primarily occurred in the east and south of the Yellow River, likely driven by the implementation of the ''Regulations on the Protection of Basic Farm'' (Ji et al., 2022). The conversion of forest land and grassland in eastern Fenhe River may be related to the Grain for Green Project (Wei et al., 2022). The implementation of policies encouraging the retirement of cultivated land in western MRYR also led to an increase in grassland (Liu et al., 2017). In the hilly regions of Shaanxi Province, the conversion of unused land and cultivated land into grassland may be attributed to ecological restoration (Zhang et al., 2024). During 2000-2010, the intensity of shelterbelt programs decreased, and land use changes were less pronounced. Under the influence of policies, both forest land and grassland areas increased. However, due to the development of urbanization, construction land expanded by encroaching on cultivated land (Liu et al., 2015). In addition, the development of construction land was also facilitated by the implementation of the ''Western Development Strategy'' (Song et al., 2014), with the main development areas being the urban fringe (Wen et al., 2024). Overall, both the implementation of shelterbelt programs and urbanization have had a significant impact on the land use structure in the MRYR. While vegetation cover has significantly improved, the area of construction land has expanded rapidly as well. In the future, greater efforts should be made to protect afforestation areas, pay attention to the impact of economic development on land use structure, and reasonably limit the expansion of construction land.
Carbon storage in the MRYR exhibited a trend of increasing first and then decreasing. During the phase of intensive implementation of shelterbelt programs, carbon storage notably increased (Chen et al., 2024; Duan et al., 2024). The trend of land use changes in the areas where shelterbelt programs were implemented aligns with carbon storage, indicating that the implementation of these programs can significantly increase carbon storage (Liao et al., 2024). However, carbon storage benefits gradually diminish during the implementation of the policy (Yao et al., 2022). The gravity center of the negative impact of land use on carbon storage was primarily located at the junction of Shaanxi and Shanxi provinces, gradually shifting towards Shanxi Province. This shift may result from more significant land use changes in Shaanxi from 1980 to 2005, while, from 2005 onwards, land use changes in Shanxi Province became more pronounced (Li et al., 2024; Liu et al., 2024). As the land use type with the largest area in the MRYR, cultivated land plays a crucial role in regional carbon storage. To mitigate the impact of agricultural carbon emissions, farmers should promote the development of green agriculture, focusing on reducing the use of fertilizers and pesticides and enhancing the carbon sequestration capacity of the soil (Smith et al., 1998). Forest land is the land use type with the highest carbon density. Therefore, to enhance carbon storage, future efforts should focus on strengthening vegetation restoration and ecological afforestation, particularly in areas with severe soil erosion. In this regard, it is essential to select plant species that are well-suited to the local growing environment. Additionally, protecting the vegetation in afforested areas is critical to prevent ecological degradation and ensure the long-term stability of carbon sequestration capacity in these ecosystems. The expansion of construction land is largely irreversible (Yao and Liu, 2010). To mitigate the reduction in carbon storage and other environmental issues caused by this expansion, policymaker should place greater emphasis on the development of urban green spaces (Guo et al., 2024), which can help offset the impact of decreased carbon storage in urban areas.
Carbon density is affected by multiple factors such as climate and soil properties, while the InVEST model simulates carbon storage based on static carbon density, which brings limitations to the results (Kohestani et al., 2024). In this study, carbon density data primarily come from measurements conducted by previous researchers in the same study area, and carbon density data for the MRYR were obtained by applying a correction formula to these measurements. However, there is a large variation in carbon density across different ecosystems, and the lack of long-term monitoring data from sample plots means that their precision of these estimates still requires further improvement (Li et al., 2022). In future ecological construction in the MRYR, it is essential to adhere to relevant shelterbelt programs, ecological restoration projects, converting cultivated land to grassland and forest land. Additionally, it is important to manage the expansion of construction land in a sustainable manner. At the same time, maximizing the use of various resources to protect the ecological environment of the MRYR and prevent ecological degradation is crucial.

5 Conclusions

With the implementation of shelterbelt programs during 1980-2000, carbon storage in the MRYR showed a fluctuating increase during this period, but it began to decline steadily after 2000, with the decrease becoming more pronounced after 2010. The most significant changes in land use types and carbon storage were observed during 1990-1995 and 1995-2000. A large amount of forest land and grassland was converted into cultivated land, leading to negative impacts in most areas during 1995-2000. During 1995-2000, due to policy interventions, forest land and cultivated land partially recovered, while grassland decreased, leading to a reduction in areas experiencing negative impacts. Overall, the positive impacts were primarily associated with the implementation of environmental protection measures along the Yellow River, while the negative impacts were mainly driven by the expansion of construction land in plains. The main land use changes in the MRYR are concentrated on the mutual conversion between cultivated land, forest land, and grassland, while construction land primarily expanded by occupying existing cultivated land.
Development of construction land should be reasonably limited in the future to increase carbon storage. Efforts should be made to increase the areas of forest land and grassland, and area of permanent basic farmland should be maintained. Furthermore, ecological protection should be strengthened to prevent ecological degradation in the MRYR.

Conflict of interest

The authors declare that they have no known competing financial interests or personal relationships that could have appeared to influence the work reported in this paper.

Acknowledgements

This research was funded by the National Natural Science Foundation of China (52079103) and the Outstanding Youth Science Fund of Xi'an University of Science and Technology (2024YQ2-02).

Author contributions

Conceptualization: SHI Xiaoliang, ZHANG Jie; Methodology: SHI Xiaoliang, ZHANG Jie, LIU Simin, WANG Li; Investigation: SHI Xiaoliang, DING Hao, ZHANG Dan; Formal analysis: ZHANG Jie, LIU Simin, CHEN Xi, WANG Li; Writing - original draft preparation: ZHANG Jie; Writing - review and editing: SHI Xiaoliang, LIU Simin, CHEN Xi; Funding acquisition: SHI Xiaoliang; Supervision: SHI Xiaoliang, ZHANG Jie. All authors approved the manuscript.
[1]
Alam S A, Starr M, Clark B J. 2013. Tree biomass and soil organic carbon densities across the Sudanese woodland savannah: A regional carbon sequestration study. Journal of Arid Environments, 89: 67-76.

[2]
Chen D R, Zhou X, Yang S T, et al. 2023. Analysis of carbon stock evolution and its vulnerability characterisitics based on land use change in Guizhou Province. Bulletin of Soil and Water Conservation, 43(3): 301-309. (in Chinese)

[3]
Chen X, Yu L, Hou S, et al. 2024. Unraveling carbon stock dynamics and their determinants in China's Loess Plateau over the past 40 years. Ecological Indicators, 159: 111760, doi: 10.1016/j.ecolind.2024.111760.

[4]
Cheng Y L, Chen Y B. 2024. Spatial and temporal characteristics of land use changes in the yellow river basin from 1990 to 2021 and future predictions. Land, 13(9): 1510, doi: 10.3390/land13091510.

[5]
Duan X M, Han M, Kong X L, et al. 2024. Spatiotemporal evolution and simulation prediction of ecosystem carbon storage in the Yellow River Basin before and after the Grain for Green Project. Environmental Science, 45(10): 5943-5956. (in Chinese)

[6]
Fang J Y, Yu G R, Ren X B, et al. 2015. Carbon sequestration in China's terrestrial ecosystems under climate change-Progress on ecosystem carbon sequestration from the CAS Strategic Priority Research Program. Bulletin of Chinese Academy of Sciences, 30(6): 848-857. (in Chinese)

[7]
Feng X H, Li Y, Wang X Z, et al. 2023. Impacts of land use transitions on ecosystem services: A research framework coupled with structure, function, and dynamics. Science of the Total Environment, 901: 166366, doi: 10.1016/j.scitotenv.2023.166366.

[8]
Fotheringham A S, Yang W B, Kang W. 2017. Multiscale geographically weighted regression (MGWR). Annals of the American Association of Geographers, 107(6): 1247-1265.

[9]
Guo H B, Du E Z, Terrer C, et al. 2024. Global distribution of surface soil organic carbon in urban greenspaces. Nature Communications, 15: 806, doi: 10.1038/s41467-024-44887-y.

[10]
Huang Y Q, Li X Y, Yu Q, et al. 2022. An analysis of land use change and driving forces in the Yellow River Basin from 1995 to 2018. Journal of Northwest Forestry University, 37(6): 113-121. (in Chinese)

[11]
Ji Q L, Liang W, Fu B J, et al. 2022. Land use/cover change in the Yellow River Basin based on Google Earth Engine and complex network. Acta Ecologica Sinica, 42(6): 2122-2135. (in Chinese)

[12]
Jiang Y, Alifujiang Y, Feng P P, et al. 2024. A simulated assessment of land use and carbon storage changes in the Yanqi Basin under different development scenarios. Land, 13(6): 744, doi: 10.3390/land13060744.

[13]
Kohestani N, Rastgar S, Heydari G, et al. 2024. Spatiotemporal modeling of the value of carbon sequestration under changing land use/land cover using InVEST model: A case study of Nour-rud Watershed, Northern Iran. Environment, Development and Sustainability, 26(6): 14477-14505.

[14]
Kothandaraman S, Dar J A, Sundarapandian S, et al. 2020. Ecosystem-level carbon storage and its links to diversity, structural and environmental drivers in tropical forests of Western Ghats, India. Scientific Reports, 10(1): 13444, doi: 10.1038/s41598- 020-70313-6.

[15]
Li J N, Pan B H, Zheng W K, et al. 2024. Spatio-temporal evolution of land use pattern in the Yellow River (Shaanxi Section) from 1990 to 2020. Journal of Guizhou Normal University (Nature Science), 42(3): 46-57. (in Chinese)

[16]
Li Y X, Liu Z S, Li S J, et al. 2022. Multi-scenario simulation analysis of land use and carbon storage changes in Changchun City based on FLUS and InVEST model. Land, 11(5): 647, doi: 10.3390/land11050647.

[17]
Liao M Y, Fang X Q, Jiang X Y, et al. 2024. Spatiotemporal characteristics of land use/cover changes in the Yellow River Basin over the past 40 years. Journal of Soil and Water Conservation, 38(2): 165-177. (in Chinese)

[18]
Liu J J, Gao Y X, Chen S H. 2024. Analysis of spatiotemporal evolution of land use in Shanxi Province based on GEE. China Resources Comprehensive Utilization, 42(5): 126-129. (in Chinese)

[19]
Liu T, Liu H, Qi Y J. 2015. Construction land expansion and cultivated land protection in urbanizing China: Insights from national land surveys, 1996-2006. Habitat International, 46: 13-22.

[20]
Liu X W, Zhao C L, Song W. 2017. Review of the evolution of cultivated land protection policies in the period following China's reform and liberalization. Land Use Policy, 67: 660-669.

[21]
Liu Y, Zhang J, Zhou D W, et al. 2021. Temporal and spatial variation of carbon storage in the Shule River Basin based on InVEST model. Acta Ecologica Sinica, 41(10): 4052-4065. (in Chinese)

[22]
Piao S L, Ito A, Li S G, et al. 2012. The carbon budget of terrestrial ecosystems in East Asia over the last two decades. Biogeosciences, 9(9): 3571-3586.

[23]
Sasmito S D, Taillardat P, Clendenning J N, et al. 2019. Effect of land-use and land-cover change on mangrove blue carbon: A systematic review. Global Change Biology, 25(12): 4291-4302.

[24]
Shen M C, Huang W, Chen M, et al. 2020. (Micro) plastic crisis: Un-ignorable contribution to global greenhouse gas emissions and climate change. Journal of Cleaner Production, 254: 120138, doi: 10.1016/j.jclepro.2020.120138.

[25]
Shi X L, Chen F, Shi M Q, et al. 2023. Construction and application of optimized comprehensive drought index based on lag time: A case study in the middle reaches of Yellow River Basin, China. Science of the Total Environment, 857: 15969, doi: 10.1016/j.scitotenv.2022.159692.

[26]
Smith P, Powlson D S, Glendining M J, et al. 1998. Preliminary estimates of the potential for carbon mitigation in European soils through no-till farming. Global Change Biology, 4(6): 679-685.

[27]
Song X Z, Peng C H, Zhou G M, et al. 2014. Chinese Grain for Green Program led to highly increased soil organic carbon levels: A meta-analysis. Scientific Reports, 4(1): 4460, doi: 10.1038/srep04460.

[28]
Sun W L, Liu X H. 2020. Review on carbon storage estimation of forest ecosystem and applications in China. Forest Ecosystems, 7(1): 4, doi: 10.1186/s40663-019-0210-2.

[29]
Tang Q H, Xu X M, He L, et al. 2023. Development of an eco-hydrological model for flood and drought risk assessment under a changing environment in the middle reaches of the Yellow River. Acta Geographica Sinica, 78(7): 1666-1676. (in Chinese)

[30]
Toru T, Kibret K. 2019. Carbon stock under major land use/land cover types of Hades sub-watershed, eastern Ethiopia. Carbon Balance Management, 14: 7, doi: 10.1186/s13021-019-0122-z.

[31]
Wang Z Y, Li X, Mao Y T, et al. 2022. Dynamic simulation of land use change and assessment of carbon storage based on climate change scenarios at the city level: A case study of Bortala, China. Ecological Indicators, 134: 108499, doi: 10.1016/j. ecolind.2021.108499.

[32]
Wei J, Liu L L, Wang H Y, et al. 2022. Spatiotemporal patterns of land-use change in the Taihang Mountain (1990-2020). Chinese Journal of Eco-Agriculture, 30(7): 1123-1133. (in Chinese)

[33]
Wen R, Gao Y Y, Wu Z H, et al. 2024. Effects of land use change on the temporal and spatial pattern of carbon storage in Guanzhong Plain urban agglomeration. Chinese Journal of Eco-Agriculture, 32(4): 592-604. (in Chinese)

[34]
Xiang S J, Zhang Q, Wang D, et al. 2022. Response and vulnerability analysis of carbon storage to LUCC in the main urban area of Chongqing during 2000-2020. Journal of Natural Resources, 37(5): 1198-1213. (in Chinese)

[35]
Xie X L, Sun B, Zhou H Z, et al. 2004. Soil carbon stocks and their influencing factors under native vegetations in China. Acta Pedologica Sinica, 41(5): 687-699. (in Chinese)

[36]
Xu F, Wang Z Q, Chi G Q, et al. 2020. The impacts of population and agglomeration development on land use intensity: New evidence behind urbanization in China. Land Use Policy, 95: 104639, doi: 10.1016/j.landusepol.2020.104639.

[37]
Yang H F, Mu S J, Li J L. 2014. Effects of ecological restoration projects on land use and land cover change and its influences on territorial NPP in Xinjiang, China. Catena, 115: 85-95.

[38]
Yao N, Liu G Q, Yao S B, et al. 2022. Evaluating on effect of conversion from farmland to forest and grassland project on ecosystem carbon storage in loess hilly-gully region based on InVEST model. Bulletin of Soil and Water Conservation, 42(5): 329-336. (in Chinese)

[39]
Yao S J, Liu Z N. 2010. Determinants of grain production and technical efficiency in China. Journal of Agricultural Economics, 49(2): 171-184.

[40]
Yu Z, Ciais P, Piao S L, et al. 2022. Forest expansion dominates China's land carbon sink since 1980. Nature Communications, 13(1): 5374, doi: 10.1038/s41467-022-32961-2.

[41]
Zhang B, Xia Q Y, Dong J, et al. 2023a. Research on the impact of land use change on the spatio-temporal pattern of carbon storage in Metropolitan Suburbs: Taking Huangpi District of Wuhan City as an example. Journal of Ecology and Rural Environment, 39(6): 699-712. (in Chinese)

[42]
Zhang J, Li M, Ao Z Q, et al. 2018. Estimation of soil organic carbon storage of terrestrial ecosystem in arid western China. Journal of Arid Land Resources and Environment, 32(9): 132-137. (in Chinese)

[43]
Zhang Y, Shi F H, Zhang Y, et al. 2023b. Temporal and spatial changes and driving factors of soil erosion in the middle reaches of the Yellow River. Research of Soil and Water Conservation, 30(5): 1-12. (in Chinese)

[44]
Zhang Y Q, Zhao X, Gong J, et al. 2024. Effectiveness and driving mechanism of ecological restoration efforts in China from 2009 to 2019. Science of the Total Environment, 910: 168676, doi: 10.1016/j.scitotenv.2023.168676.

[45]
Zhao M M, He Z B, Du J, et al. 2019. Assessing the effects of ecological engineering on carbon storage by linking the CA-Markov and InVEST models. Ecological Indicators, 98: 29-38.

[46]
Zhu G F, Qiu D D, Zhang Z X, et al. 2021. Land-use changes lead to a decrease in carbon storage in arid region, China. Ecological Indicators, 127: 107770, doi: 10.1016/j.ecolind.2021.107770.

[47]
Zhuang D F, Liu J Y. 1997. Study on the model of regional differentiation of land use degree in China. Journal of Natural Resources, 12(2): 105-111. (in Chinese)

Outlines

/