Research article

Multi-scenario simulation of land use change and its impact on ecosystem services in the northeastern edge of the Qinghai-Xizang Plateau, China

  • ZHANG Xuebin , 1, * ,
  • LIU Yanni 1 ,
  • YIN Junfeng 2 ,
  • SHI Peiji 1 ,
  • FENG Haoyuan 1 ,
  • SHI Jing 3
Expand
  • 1College of Geography and Environmental Science, Northwest Normal University, Lanzhou 730070, China
  • 2Faculty of Geographic Sciences, Beijing Normal University, Beijing 100875, China
  • 3State Key Laboratory of Herbage Improvement and Grassland Agro-ecosystems, College of Ecology, Lanzhou University, Lanzhou 730000, China
*ZHANG Xuebin (E-mail: )

Received date: 2024-08-27

  Revised date: 2024-11-25

  Accepted date: 2025-01-27

  Online published: 2025-08-12

Abstract

The Qinghai-Xizang Plateau (QXP) serves as a crucial ecological barrier in China and Asia, exerting profound influences on global climate and biodiversity conservation. Gannan Tibetan Autonomous Prefecture (hereinafter referred as Gannan Prefecture), located on the northeastern edge of the QXP, represents a fragile alpine ecosystem in which land use change significantly impacts ecosystem services (ESs). This study established a comprehensive framework, utilizing the Patch-generating Land-Use Simulation (PLUS) model coupled with the Integrated Valuation of Ecosystem Services and Tradeoffs (InVEST) model to predict land use patterns under the natural development scenario, cultivated land protection scenario, and ecological protection scenario for Gannan Prefecture by 2030 and evaluated four critical ESs: habitat quality (HQ), water yield (WY), soil retention (SR), and carbon storage (CS). The primary aim is to elucidate the impacts of dynamic land use change on ESs. The results revealed that, from 2000 to 2020, HQ exhibited minimal variation, whereas CS experienced a slight decline. Conversely, WY and SR showed significant improvements. Under the natural development scenario, construction land was projected to increase by 4247.74 hm2, primarily at the expense of forest land. The cultivated land protection scenario anticipated an increase in farmland by 2634.36 hm2, which was crucial for maintaining food security. The ecological protection scenario predicted a notable expansion of forest land, accompanied by a restrained development rate of construction land. The ecological protection scenario also showed an increase in the ecosystem service index (ESI), encompassing 26.07% of the region. Forest land and grassland emerged as the primary contributors to ESs, while construction land substantially impacted WY. Water bodies exhibited minimal contribution to ESs. This study enhanced the understanding of land use change impacts on ESs in fragile and high-altitude ecosystems, offering essential theoretical frameworks and practical direction for forthcoming ecological policy and regional planning endeavors.

Cite this article

ZHANG Xuebin , LIU Yanni , YIN Junfeng , SHI Peiji , FENG Haoyuan , SHI Jing . Multi-scenario simulation of land use change and its impact on ecosystem services in the northeastern edge of the Qinghai-Xizang Plateau, China[J]. Journal of Arid Land, 2025 , 17(2) : 145 -166 . DOI: 10.1007/s40333-025-0091-x

1 Introduction

The impact of land use change on ecosystem services (ESs) has become increasingly significant due to intensified global climate change and human interventions, especially in vulnerable high-altitude ecosystems. Ecosystems provide numerous products and services that are essential for sustaining life and supporting societal frameworks (Costanza et al., 1997). The ESs, which are the benefits that humans gain from ecosystems, serve as an essential link between the natural environment and human well-being (Ke et al., 2021). Land use change is a pivotal factor influencing ESs, profoundly impacting Earth's energy balance and biogeochemical cycles. Global phenomena such as urbanization, economic development, and population growth have modified the spatial organization of regions worldwide, thereby intensifying competition for space and inducing changes in land use (Zou et al., 2024). The shifts in land use have adversely affected the structure and functioning of ecosystems, leading to a general decline in ecosystem health and services locally and globally (Fulford et al., 2022). Additionally, land use activities and various factors in the economy, society, and environment determine the changes in agriculture, urban infrastructures, and ecological systems in the regions (Cao et al., 2023; Qu et al., 2023). Land use change, serving as the direct and primary driving force behind the dynamic shifts in ecosystems, profoundly impacts a series of crucial ecological processes on land, including energy exchange, water cycling, and biogeochemical cycles (Ning et al., 2018; Zhang et al., 2021). Changes in land use types can lead to the loss and fragmentation of biological habitats, subsequently affecting the distribution and abundance of species (Gao et al., 2024). Changes in land use have an impact on the ecosystem in terms of both its physical and biological characteristics (Zheng et al., 2022; Xu et al., 2023b), exacerbating problems such as water deficiency and soil erosion. Consequently, these alterations in land use pose immediate threats to ecological security, as well as to economic development, social stability, and people's quality of life (Costanza et al., 2014).
An inaccurate assessment of ES poses a significant barrier to identifying the impacts of land use change on ESs and to effectively managing ecological environments (Tallis and Polasky, 2009). Presently, two primary research paradigms exist for quantifying ES levels: the value method and the material quantity method. The value method indirectly quantifies ESs through approaches such as emergy and monetary valuation. Conversely, the material quantity method involves the direct calculation of biophysical or conceptual quantities of ESs. The Integrated Valuation of Ecosystem Services and Tradeoffs (InVEST) model is a frequently used quality method. It is widely employed in complex decision-making processes that consider ESs because of its outstanding efficiency and reliability. The applications of InVEST model include evaluations of ES supply and demand (Shen et al., 2023; Yuan et al., 2023; Zhao et al., 2024), ES vulnerability (Xue et al., 2019; Jiang et al., 2021; Tang et al., 2021), and ES trade-offs and synergies (Hou et al., 2017; Qiao et al., 2019; Shen et al., 2020). The research methodologies frequently employed in ES studies include multiple linear regression (Xie et al., 2022), the Pressure-State-Response (P-S-R) model (Kang et al., 2019), emergy analysis (Xiao et al., 2022), scenario simulation (Wang et al., 2018), and life cycle assessment (Liu et al., 2020). Moreover, research on ESs encompasses a multi-scale analytical framework, spanning national (Sun et al., 2019), provincial (Yin et al., 2023), municipal (Wang et al., 2018), urban agglomeration (Liu et al., 2023b), and watershed scales (Yang et al., 2023). The focus of these investigations often lies in ecologically fragile areas and economically developed regions.
Numerous studies evaluating ESs across various spatial scales have integrated land use with ESs. Scholars have explored trends in land use change and their impacts on ESs. For example, Quintas-Soriano et al. (2016) looked into how land use changes affected key services in arid ecosystems, such as agriculture, water regulation, and tourism. Similarly, Feng et al. (2023) developed a framework to examine how land use influenced ESs in terms of structure, function, and dynamics. However, there remains a notable dearth of attention to the model simulation and effect assessment of land use change on ESs. Furthermore, simulations of future scenarios often neglect exploring changes under alternative scenarios in conjunction with national policies, instead focusing solely on natural development trajectories. Models such as the Markov model (Wang et al., 2022a), Cellular Automata model (Xu et al., 2023a), System Dynamics model (Gao et al., 2024), Future Land Use Simulation (FLUS) model (Liu et al., 2023a), and Conversion of Land Use and its Effects at Small Region Extent (CLUE-S) model (Hu et al., 2013), provide means to simulate future land use. The Patch-generating Land-Use Simulation (PLUS) model proposed by Liang et al. (2021) outperforms other models in excavating the causes of land use change and improving the accuracy of simulating future spatial patterns. It is widely utilized globally and regionally. Elucidating the nonlinear and complex relationships among land use, ESs, and policies is still an important field for future research. Considering the constraints of multiple sustainable development goals and the imperative to align with regional development needs, it is crucial to investigate the impact of land use change on ESs.
The Qinghai-Xizang Plateau (QXP) ecosystem is highly sensitive and vulnerable due to its unique geography and climate, making it weak in resisting external disturbances. Once damaged, recovery becomes extremely challenging (Liu et al., 2022). The increase in human activities has altered land use patterns and has exerted profound and lasting effects on the Qinghai-Xizang Plateau's environment. Located in the QXP, Gannan Tibetan Autonomous Prefecture, Gansu Province, China (hereinafter abbreviated as Gannan Prefecture), holds significant importance in the "Chinese Water Tower" region and possesses significant value and importance in its ES function. The region's environmental status is unstable, characterized by intensive anthropogenic impact and the requirement for the preservation of ecosystems. Thus, the interaction between global environmental changes and local human activities has caused significant ecological changes, which have affected the Yellow River Basin and have spread the consequences to other parts of Northwest China. In this study, we utilized PLUS model to forecast land use patterns under three scenarios (natural development, cultivated land protection, and ecological protection) in Gannan Prefecture in 2030. Additionally, we adopted the InVEST model to quantify four types of ESs in Gannan Prefecture: habitat quality (HQ), water yield (WY), soil retention (SR), and carbon storage (CS) from 2000 to 2030, incorporating the dynamics of land use as a key consideration. The objectives of this study are threefold: firstly, to map temporal and spatial variations in ES functionalities in Gannan Prefecture from 2000 to 2020; secondly, to model and contrast the impacts of diverse future land use scenarios up to 2030; and thirdly, to evaluate how land use change impacts on ESs, aiming to enhance the synergy between economic growth and ecological sustainability in ecologically sensitive and high-altitude regions. This study integrated multi-source data and methodologies to predict land use change in Gannan Prefecture under various future scenarios, subsequently forecasted trends in variations of ESs; and ultimately, identified potential ecological risks and issues. This paper can serve as the bedrock for formulating optimized land use allocation strategies and implementing ecosystem management in the future. Additionally, this study provides empirical evidence and decision-making assistance for reconciling economic development with environmental conservation in ecologically vulnerable and high-altitude regions.

2 Materials

2.1 Study area

Located on the northeastern edge of the QXP and the southwestern part of Gansu Province, Gannan Prefecture (33°06′-36°10′N, 100°46′-104°44′E) serves as a transitional area connecting the QXP, the Loess Plateau, and the Longnan Mountains. It adjoins the Aba Tibetan and Qiang Autonomous Prefecture in Sichuan Province to the south and the Huangnan Tibetan Autonomous Prefecture and Golog Tibetan Autonomous Prefecture in Qinghai Province to the southwest. In Gansu Province, Gannan Prefecture is bordered by Longnan City, Dingxi City, and Linxia Hui Autonomous Prefecture from east to north. Administratively, Gannan Prefecture consists of one city and seven counties: Hezuo City, Xiahe County, Luqu County, Maqu County, Lintan County, Jone County, Tewo County, and Zhugqu County (Fig. 1). With an elevation ranging from 1204 to 4688 m, generally ascending towards the northwest and declining towards the southeast, the prefecture covers an area of 4.50×10⁶ hm2. The northwest is characterized by alpine meadows and pastures, which make it as one of China's five major pastoral regions. The eastern part features rolling hills, while the southern section is predominantly occupied by the mountainous terrain of both the Minshan and Diego mountains. The climate is predominantly continental and seasonal, with an annual average temperature of around 3°C. There are large temperature differences among different regions. The annual average precipitation falls between 400 and 800 mm, mainly concentrated in summer. These environmental conditions contribute to the region's ecological significance within the Yellow River Basin. Protecting the ecological landscape in Gannan Prefecture is vital for water and soil conservation, climate regulation, and biodiversity preservation, thereby supporting regional socio-economic progress. Gannan Prefecture is home to various ethnic minorities, and its primary income sources are agriculture and livestock farming. Economic development and increased urban growth have exacerbated ecological vulnerabilities and intensified the conflict between human activities and environmental conservation (Wang et al., 2020; Zhang et al., 2020). Therefore, it is crucial to evaluate ESs and examine the linkages between land use and ecosystem benefits to promote ecological preservation and sustainable development in this region.
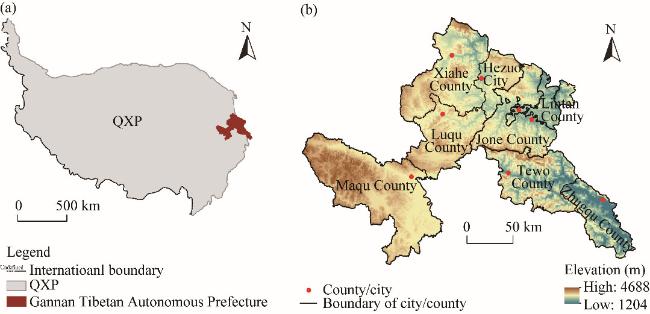
Fig. 1 Geographic location (a) and overview (b) of Gannan Tibetan Autonomous Prefecture, Gansu Province, China. The Gannan Tibetan Autonomous Prefecture is abbreviated as Gannan Prefecture in hereinafter figures. QXP, Qinghai-Xizang Plateau.

2.2 Data sources

Data on land use, sourced from the Resource and Environmental Science and Data Center of the Chinese Academy of Sciences (https://www.resdc.cn/), were converted from its original vector format to a raster format with a resolution of 30 m. Meteorological elements, such as precipitation, temperature, and potential evapotranspiration, were carefully interpolated from daily data recorded at various regional weather stations, all observations being provided by the same institution (https://www.resdc.cn/). Data on the root-restricting layer depth were obtained from a high-resolution (100 m) Chinese soil depth map authored by Yan et al. (2020). Plant-available water capacity (PAWC) was estimated using a non-linear fitting model developed by Zhou et al. (2005). This model incorporated inputs from the Harmonized World Soil Database (HWSD) and was supplemented with soil composition metrics provided by the National Tibetan Plateau Data Center, accessible via the website (https://data.tpdc.ac.cn/). The digital elevation model (DEM), necessary for topographical attributes like slope and orientation, was sourced from the Geospatial Data Cloud (https://www.gscloud.cn/). The normalized difference vegetation index (NDVI) was calculated using the maximum value composite method from monthly datasets provided by National Aeronautics and Space Administration (NASA; https://www.nasa.gov/). All raster-based datasets were converted to the Krasovsky_1940_Albers coordinate system to ensure alignment with the administrative boundaries of Gannan Prefecture. Additionally, gross domestic product (GDP) and population density were also acquired from the Resource and Environmental Science and Data Center (https://www.resdc.cn/). Details about highways, water systems, and government premises were obtained from the National Geographic Information Resource Catalog Service System (https://www.webmap.cn/main.do?method=index) and were processed to calculate Euclidean distances.

3 Methods

3.1 Analysis methods

The research methodology was structured around four key phases. Initially, it involved the gathering and processing of data. In the second phase, we analyzed land use patterns and changes through the application of land use transition matrices and spatial analyses using ArcGIS v.10.4 (Eris, Redlands, California, USA). Next, we utilized the PLUS model to simulate and predict future land use scenarios. The third phase involved evaluating historical ESs through the InVEST model and forecasting variations in these services under various scenarios based on the simulated land use data. Finally, this study explored the mechanisms through which land use change impacts ESs. The outcomes of this study were employed to develop specific policy recommendations and actions (Fig. 2).
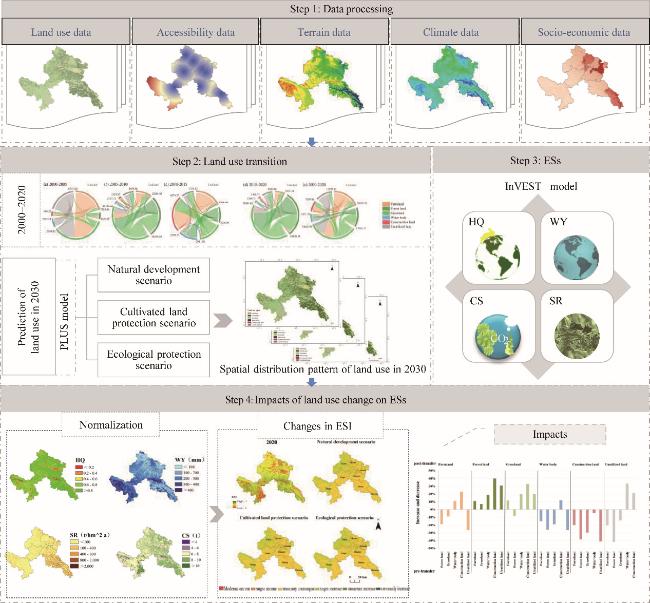
Fig. 2 Framework of this study on the impact of land use change on ecological services (ESs). PLUS, Patch-generating Land-Use Simulation; InVEST, Integrated Valuation of Ecosystem Services and Tradeoffs; HQ, habitat quality; WY, water yield; SR, soil retention; CS, carbon storage; ESI, ecosystem service index.

3.2 Land use transition matrix

The land use transition matrix is a core component of the Markov model, providing a quantitative description of land use change across different time dimensions and categories. This matrix systematically analyzes the area transitions between various land use types over a specified time interval, thereby elucidating the dynamics of land use change (Deng and Quan, 2023). Additionally, the model can be expressed mathematically as:
S a b = S 11 S 12 S 13 S 1 n S 21 S 22 S 23 S 2 n S 31 S 32 S 33 S 3 n S n 1 S n 2 S n 3 S n n ,
where S is the land area (hm2); a is the type of land use at the beginning of the analysis; b is the type of land use at the later stage of the analysis; and n is the total number of categories of land use involved. The values on the diagonal of the matrix indicate the changes in the area of the same land use type across different time periods.

3.3 Land use multi-scenario simulation

3.3.1 Scenario setting

The PLUS model is a newly developed and improved Cellular Automaton model built upon the FLUS model, integrating the rule mining framework of the Land Expansion Analysis Strategy (LEAS) and the Cellular Automaton based on Random Seed and multi-type patches (CARS) model. This integration not only enhances the ability to uncover various driving factors behind land use change but also improves the simulation accuracy of land use change at the patch level (Liang et al., 2021). In terms of driving land use change, this study took into account a variety of spatial variables, including natural factors (elevation, slope, annual precipitation, and annual average temperature), transportation and location factors (distance from government premises, distance from highway, and distance from water body), as well as socio-economic factors (GDP and population density).
Guided by the particular circumstances of the study area and the prevailing literature (Ma et al., 2023; Yin et al., 2023), this study established three distinct simulation scenarios. Each scenario is characterized by specific land use needs, neighborhood weights, conversion rules, and constraint conditions. The core principles and objectives defining these scenarios are outlined below:
In the natural development scenario, it is assumed that the patterns of land use change experienced in the past will continue without hindrances to the conversion of one type of land use to another and without restrictive policy measures. Forecasts of future situations relying on the conversion probabilities of the various land use types derived from the data collected from 2010 to 2020.
In the cultivated land protection scenario, areas recognized as important for agriculture are categorized as limited for conversion to ensure that these plots are not taken over by other land use types. The corresponding probabilities in the transfer matrix are adjusted to decrease the rate of conversion of farmland to construction land by 50.00%, the conversion probability of other land use types turning into farmland is increased by 20.00%.
In the ecological protection scenario, based on the "Ecological Protection and High-Quality Development Plan of the Yellow River Basin in Gansu Province", the land use conversion restricted zones include natural reserves and water bodies. This strategy aims to reduce the probability of forest land and grassland being converted to other land use types. Specifically, the transformation of forest land and grassland into construction land is decreased by 60.00% and 40.00%, respectively. Moreover, the probability of farmland being converted into construction land is reduced by 20.00%.

3.3.2 Model validation

The accuracy of land use projections were evaluated by the Kappa statistic and overall accuracy. The Kappa statistic higher than 0.80 proves the reliability of the simulation outcomes. In this study, data from the year 2010 were adopted as the baseline. The PLUS model estimated land use patterns through 2020, with its accuracy verified by comparing these projections to actual data from that year. The model's dependability was demonstrated by a Kappa statistic of 0.85 and an overall accuracy score of 0.89. This substantial precision laid the groundwork for forecasting land use trends up to 2030.

3.4 Quantification of ES

3.4.1 HQ

The HQ is evaluated by integrating assessments of landscape sensitivity with the intensity of external threats, which serves as critical indicator for assessing biodiversity health (Huang et al., 2020). Since various habitat types respond differently to environmental pressures, it is crucial to conduct sensitivity analyses tailored to the specific magnitudes of the external threats mentioned to ensure an accurate HQ assessment. The formula is as follows (Nelson et al., 2009):
Q x j = H j 1 ( D x j z D x j z + k z ) ,
where Qxj is the habitat quality of habitat type j in grid cell x; Hj is the habitat suitability of habitat type j; Dxj is the habitat degradation degree to habitat type j in grid cell x; and k and z are the half-saturation constant and the default parameter in the model, respectively.

3.4.2 WY

The WY serves as an effective indicator for evaluating the water supply capacity of a region (Wang et al., 2022b). The WY assessment model implemented in the InVEST employs the Budyko water-energy balance hypothesis to calculate the WY of each grid cell by subtracting the difference between the actual evapotranspiration and precipitation. The formulas are as follows (He et al., 2024):
WY x =(1 AET x P x ) × P x ,
AET x P x = 1 + PET x P x 1 + PET x P x ω x 1 / ω x ,
ω x = Z × AWC x P x + 1.25 ,
where WYx is the annual water yield of grid cell x (mm); AETx is the annual actual evapotranspiration of gird cell x (mm); Px is the annual precipitation of grid cell x (mm); PETx is the potential evapotranspiration of grid cell x (mm); ωx is a non-physical empirical param related to natural climate and soil properties; AWCx is the available water capacity for plants within grid cell x (mm); and Z is a seasonal constant that characterizes precipitation patterns within the study area.

3.4.3 SR

The SR is the capacity of natural systems to offer soil preservation functionalities. The SR is quantified using the foundational model of sediment interception, specifically through the universal soil loss equation. The formulas are as follows (Yan and Li, 2023):
SR = R × K × LS × ( 1 C × Q ) ,
where SR is the soil preservation capacity (t/(hm2•a)); R is the rainfall erosivity factor (MJ•mm/(hm2•h•a)); K is the soil erodibility factor (t•h/(MJ•mm)); LS is the slope length-slope steepness factor; C is the crop or vegetation management factor; and Q is the soil and water conservation measure factor. In this study, the Q was designated as follows: 0.40 for farmland, 0.60 for forest land, 0.50 for grassland, 0.00 for water body, 1.00 for construction land, and 0.00 for unutilized land (Wei et al., 2021).
R = 0.053 P 1.655,
K = 0.1317 × { 0.2 + 0.3 exp [ 0.0265 × SAN × ( 1 SIL 100 ) ] } × ( SIL CLA+SIL ) 0.3 × { 1 0.25 × OM OM + exp ( 3.72 2.95 × OM ) } × { 1 0.7 × ( 1 SAN 100 ) ( 1 SAN 100 ) + exp ( 22.9 × ( 1 SAN 100 ) 5.51 ) }
C = 1 , f g = 0.00 % 0.6508 0.3436 ln f g , 0.00 % < f g 78.30 % 0 , f g > 78.30 % ,
f g = ( NDVI NDVI min ) ( NDVI max NDVI min ) ,
where SAN is the sand content in the soil (%); SIL is the silt content in the soil (%); CLA is the clay content in the soil (%); OM is the organic matter content in the soil (%); fg is the vegetation coverage degree; NDVI is the Normalized Difference Vegetation Index; NDVImin is the the minimum value of NDVI; and NDVImax is the the maximum value of NDVI.

3.4.4 CS

The CS evaluations combine land use data with measurements across four carbon reservoirs (aboveground carbon density, underground carbon density, soil carbon density, and dead organic matter carbon density). This method enables a thorough evaluation of the current condition and temporal variations in landscape carbon storage capacity (Zhang et al., 2023). The formulas are as follows:
C i = C i - above + C i - below + C i - soil + C i - dead ,
C total = i = 1 n C i × S i ,
where Ci is the aggregate carbon density for land use type i (t/hm2); Ci-above is the carbon density in aboveground vegetation (t/hm2); Ci-below is the carbon density in live roots beneath the ground (t/hm2); Ci-soil is the carbon density of the soil (t/hm2); Ci-dead is the carbon density present in litter (t/hm2); Ctotal is the total carbon storage (t); and Si is the total area occupied by land use type i (hm2).

3.5 Calculation of ecosystem service index (ESI)

Developing an ESI allows for the representation and quantification of the cumulative impact of various ESs. Given that each ES indicator varies in attributes, scale, and units, direct comparison is not feasible. A numerical normalization procedure is implemented for addressing these disparities and ensuring comparability among the indicators (Chen et al., 2022). This ESI offers a comprehensive view of the overall condition of ecosystems across various regions, which makes it useful for governmental organizations when developing and implementing planning strategies. The methodology for calculating ESI is outlined as follows:
ESN r x = ES r x ES min ES max ES min ,
ESI x = r = 1 m E SN r x ,
where ESNrx is the normalized value of the rth ecosystem service within grid cell x; ESmax is the maximum value recorded for any ES across all grid cells; ESmin is the minimum value recorded for any ES across all grid cells; ESIx is the ecosystem service index for grid cell x; and m is the total number of ecosystem service types.
We analyzed the spatial variation of the ESI in Gannan Prefecture across different scenarios by calculating the difference in ESI from 2020 to 2030. And then, we classified the change values of ESI using the natural breaks method into the following categories: a moderate decline (< -0.280), a slight decline (-0.280- -0.100), basically unchanged (-0.100-0.008), a slight increase (0.008-0.270), a moderate increase (0.270-0.450), and an obvious increase (>0.450).
The land use transition matrix is an essential analytical tool that identifies the patterns of land use changes within a region, aiding land managers in understanding the distribution and clustering of these changes. By employing ArcGIS's zoning statistical tools, various land use transitions are systematically classified, facilitating the extraction of mean values and variances of ESI changes triggered by different types of land use alterations. This method assists land managers in grasping the spatial diversity of ESI changes and in crafting targeted zoning policies for effective land management (Fang et al., 2022).

4 Results

4.1 Dynamic changes in land use

4.1.1 Land use characteristics

Grassland and forest land were the predominant land covers in the region. In 2020, grassland accounted for 56.77% of the total area, while forest land accounted for 30.72%. Unutilized land and farmland accounted for 7.02% and 4.30%, respectively. Water bodies covered 0.70%, with construction land being the least extensive at 0.46%. Grassland, primarily located in Maqu County, Xiahe County, and Luqu County, formed the core pastoral areas of the prefecture and was essential to the QXP's ecological barrier. Forest land was abundant in Tewo County, Jone County, Zhogqu County, and Xiahe County, indicating significant forest resources in these counties. Unutilized land, mainly in Maqu County, Tewo County, and Luqu County, constituted 80.36% of the prefecture's unutilized land. Farmland was predominantly located along rivers in Lintan County, Zhugqu County, and Jone County, where water conservation projects were vital for improving crop yields. The region also featured extensive water systems, with areas of water body in Maqu County, Luqu County, and Zhugqu County accounting for 86.50% of the total area. Construction land, although limited, was concentrated around county towns and key transport routes, with Xiahe County and Lintan County having the highest values of 20.27% and 18.90%, respectively (Fig. 3).
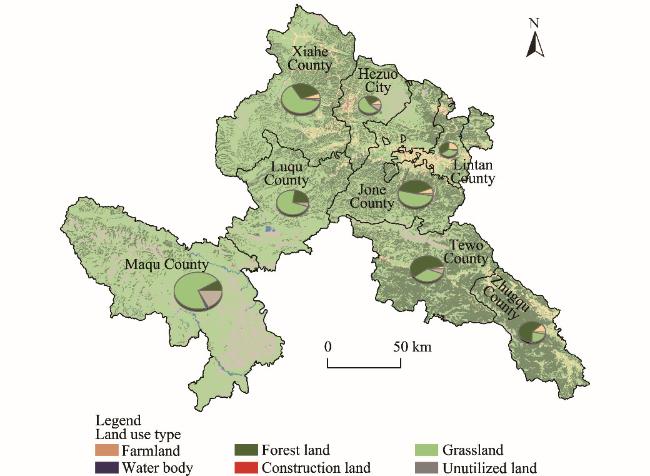
Fig. 3 Spatial distribution of land use in Gannan Prefecture in 2020
The chord diagram indicated that from 2000 to 2020, land use changes in Gannan Prefecture were primarily characterized by reciprocal conversions among grassland, forest land, and farmland (Fig. 4). During this period, grassland experienced a net increase, expanding by 2518.24 hm2. This shift was primarily due to the conversion of farmland and unutilized land into grassland, followed by the conversion of grassland into forest land. Meanwhile, farmland decreased by 10,788.81 hm2, primarily transitioning into grassland and construction land. This reduction largely resulted from ecological land retirement strategies and infrastructure development, which also led to an increase in construction land by 3965.52 hm2. The forest land saw a net increase of 4481.00 hm2, mainly from grassland conversions. Environmental conservation efforts including reforestation, grassland rehabilitation, and wetland protection facilitated the transformation of unutilized land into ecological zones, resulting in a decrease of 7750.46 hm2 in unutilized land, which was primarily converted into grassland and water bodies. Rapid urban expansion also contributed to the conversion of farmland near urban areas into construction land, leading to a significant net increase of 6763.64 hm2 in built environments. Furthermore, water bodies expanded by 5045.92 hm2, primarily due to the conversion of grassland and previously unutilized land.
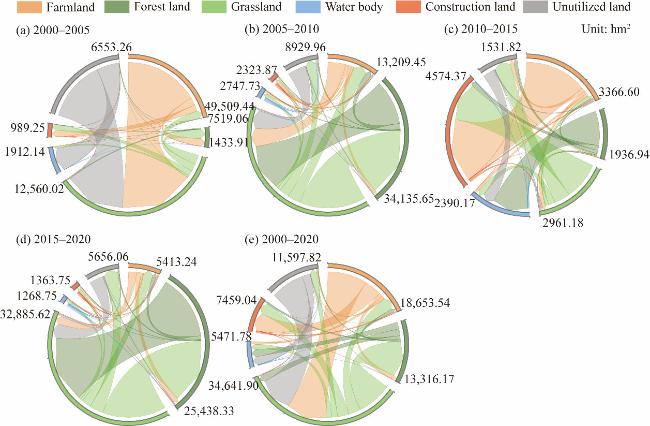
Fig. 4 Chord diagram illustrating land use changes in Gannan Prefecture from 2000 to 2020. (a), 2000-2005; (b), 2005-2010; (c), 2010-2015; (d), 2015-2020; (e), 2000-2020. The number is the sum of variation area of each land use type.

4.1.2 Land use multi-scenario simulation

Figure 5 illustrates the outcomes from various projected scenarios for land use in Gannan Prefecture by the year 2030. These projections suggested that the overall pattern of land distribution might mirror trends observed from 2000 to 2020, yet with discernible regional variations. According to the natural development scenario, the greatest reduction in land area pertained to farmland, which was projected to shrink by 2726.64 hm2 compared with 2020. This was followed by a decrease of 1983.12 hm2 in grassland. On the other hand, expansions were expected in construction land, water body, and unutilized land, increasing by 4247.74, 532.48, and 438.02 hm2, respectively. Of these, construction land was set to undergo the most extensive expansion, primarily through the transformation of forest land. In contrast, under the cultivated land protection scenario, increases were anticipated in the extents of farmland, water body, construction land, and unutilized land, whereas decreases were projected for forest land and grassland. Here, farmland was anticipated to see the largest growth, with an increase of 2634.36 hm2, as construction developments encroached upon forest land and grassland. Finally, the ecological protection scenario predicted a considerable rise in forest land, up by 3388.45 hm2, largely converting from unutilized land and farmland. Although construction land was expected to continue its growth under this scenario, the rate of expansion was forecasted to decelerate.
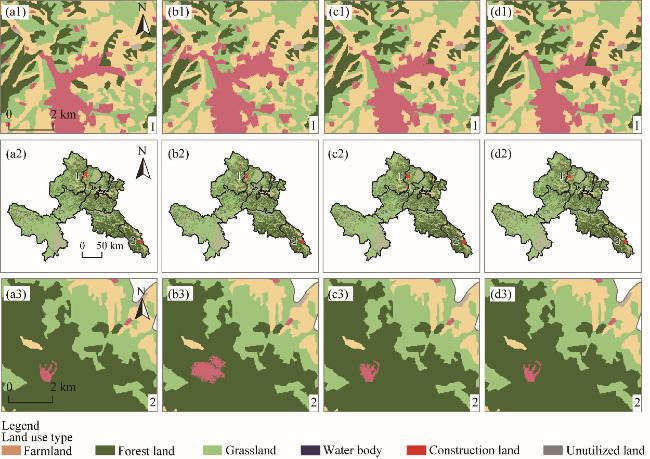
Fig. 5 Comparison of 2020 baseline land use with three predictive scenarios for 2030 in Gannan Prefecture. (a1-a3), 2020; (b1-b3), natural development scenario in 2030; (c1-c3), cultivated land protection scenario in 2030; (d1-d3), ecological protection scenario in 2030.

4.2 Spatio-temporal dynamics of ES

4.2.1 Spatio-temporal characteristics of ES from 2000 to 2020

From 2000 to 2020, HQ in Gannan Prefecture remained stable, averaging scores of 0.7543 in 2000, 0.7562 in 2010, and 0.7553 in 2020. Analysis showed that 35.00% of the region had achieved high HQ, while around 50.00% reached a relatively high level. Areas of relatively low and low HQ each constituted less than 5.00%, indicating generally favorable conditions. Spatial analysis revealed significant variance, with a "high-low-high" pattern from southeast to northwest. High HQ areas included forest land and grassland, whereas areas of low value were mainly associated with farmland and construction land, particularly in Lintan County, where human activities had a strong influence. The average value of HQ in Gannan Prefecture had surpassed 0.6000, indicating a consistent trend of improvement (Fig. 6a1-a3).
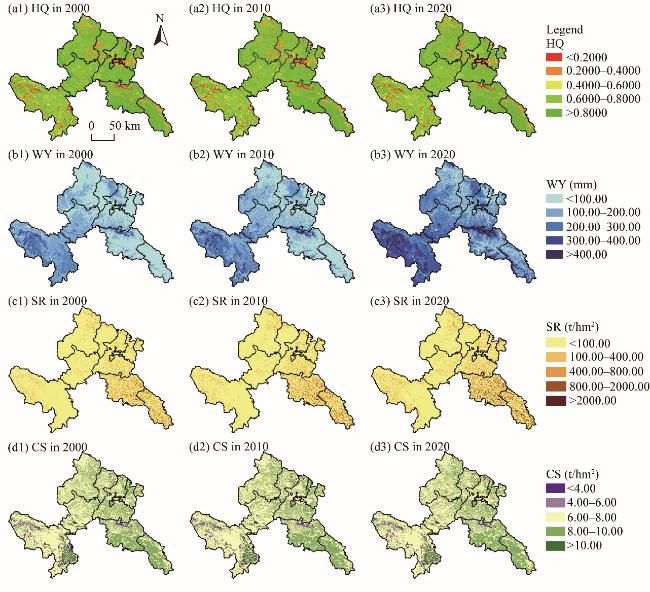
Fig. 6 Spatio-temporal dynamics in ESs in Gannan Prefecture from 2000 to 2020. (a1-a3), HQ; (b1-b3), WY; (c1-c3), SR; (d1-d3), CS.
From 2000 to 2020, Gannan Prefecture experienced a significant increase in WY. The lowest recorded WY was in 2000 at 111.02 mm depth, while the highest was in 2020 at 229.20 mm depth. This rise was attributed to higher precipitation in 2020. Spatially, WY decreased from southwest to northeast, with the highest yields in Maqu Countyand lower yields in Zhogqu County and Lintan County. Lower WY in grasslands and forest lands was due to higher evaporation compared with construction lands (Fig. 6b1-b3).
From 2000 to 2020, SR in Gannan Prefecture showed marked improvement, with values of 74.42 t/hm2 in 2000, 87.72 t/hm2 in 2010, and 128.16 t/hm2 in 2020. This enhancement had been partly due to increased vegetation coverage, which stabilizes soil, reduces erosion, and enhances SR. Spatially, high SR values had been concentrated in the southeast, particularly in Tewo County and Zhugqu County, with extensive forest land and grassland coverage. Lower SR values had been noted in the southwest, characterized by extensive unutilized land (Fig. 6c1-c3).
From 2000 to 2020, there was a marginal decline noted in the CS in Gannan Prefecture, from 26.45×10⁶ t in 2000 to 26.34×10⁶ t in 2020. The carbon density squared followed a similar trend, recorded at 7.22 t/hm2 in 2000, slightly dropping to 7.21 t/hm2 in 2010, and reaching 7.19 t/hm2 in 2020. Urban expansion into agricultural land primarily accounted for this reduction. Spatially, higher CS had been found in the southeast, diminishing toward the northwest. Forest land and grassland in Hezuo City, Zhugqu County, and Tewo County maintained elevated carbon levels, in contrast to Maqu County, where a large portion of land remained unutilized (62.60% of the area) and had sparse vegetation, resulting in lower CS (Fig. 6d1-d3).

4.2.2 Changes in ESs under multiple scenarios from 2020 to 2030

The analysis of changes in ESs in Gannan Prefecture from 2020 to 2030, conducted under three different scenarios—natural development, cultivated land protection, and ecological protection—is presented in Figure 7. Compared with the situation in 2020, HQ revealed a declining trend across all three scenarios. The natural development scenario showed the most significant reduction. This decline was primarily attributed to the swift expansion of urbanized land encroaching upon natural habitats. For WY, the spatial distribution generally aligned with these scenarios, being higher in the west and south compared with the east and north. Conversely, Zhugqu and Jone counties in the southeast exhibited lower precipitation due to geographical and climatic factors. Regarding SR, notable spatial disparities existed, with Tewo and Zhugqu counties in the southeast identified as high-value areas. However, future simulations predicted a considerable risk of SR reduction in these regions, potentially linked to further urban sprawl and ecological degradation. Notably, across all scenario simulations, CS demonstrated relatively minor fluctuations, indicating a certain level of stability.
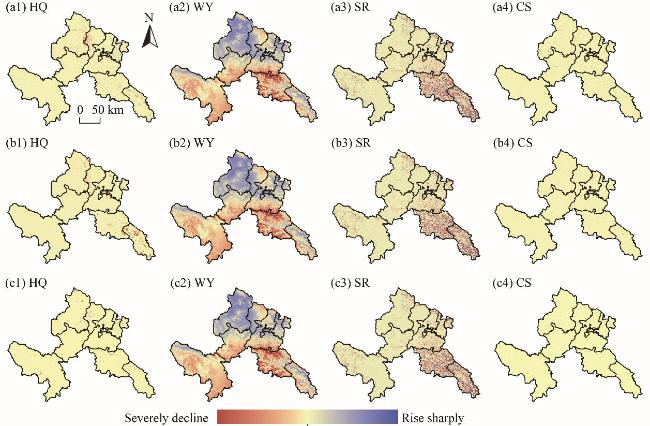
Fig. 7 Spatio-temporal dynamic changes of ESs under three predictive scenarios in Gannan Prefecture from 2020 to 2030. (a1-a4), natural development scenario; (b1-b4), cultivated land protection scenario; (c1-c4), ecological protection scenario.

4.3 Impact of land use change on ES

From 2000 to 2020, Gannan Prefecture experienced diverse shifts in land use patterns, as shown in Figure 8. In Tewo County, ecosystem functions were mainly affected by transitions from grassland to forest land and from farmland to grassland. In Hezuo City, the predominant changes involved converting farmland into grassland and construction land. Lintan County saw reciprocal transformations between farmland and grassland. In Luqu County, the primary shifts were from grassland to forest land and construction land, with additional conversions of unutilized land into water bodies noted. Maqu County mainly changed from unutilized land to grassland, followed by transitions from grassland to forest land. Xiahe County showed land use dynamics similar to Tewo County, with frequent interchanges among grassland, forest land, and farmland. In Zhugqu County, the primary land use transformation was the conversion of farmland to grassland. In Jone County, predominant shifts included transitions from farmland to grassland, from grassland to forest land, and to a lesser extent, transitions from farmland to construction land.
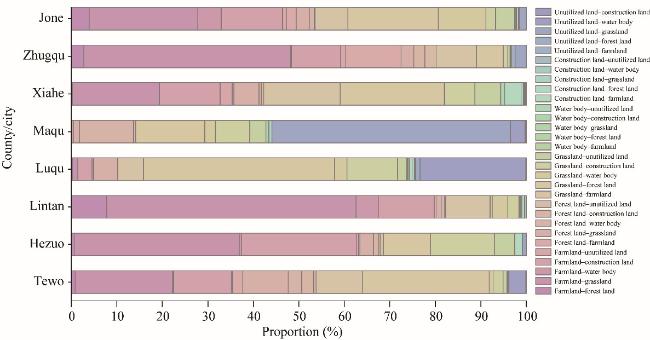
Fig. 8 Proportion of change in different land use types across various counties in Gannan Prefecture from 2000 to 2020
In the assessment of ES, forest land, grassland, and water body played pivotal roles, contributing 28.17%, 22.33%, and 24.43% to overall HQ, respectively in Gannan Prefecture from 2000 to 2020 (Fig. 9a). Conversely, construction land yielded the most WY at 40.16%, surpassing forest land, grassland, and water body due to the lower evaporation rates in built environments. Regarding SR, forest land was notable with a contribution of approximately 29.65%. Farmland also significantly contributed to CS, ranking just behind forest land, and its conversion to construction land greatly impacts CS reduction. Overall, while forest land and grassland were essential for maintaining ES, construction land strongly influenced WY, and water bodies provided lesser yet significant contributions to ES.
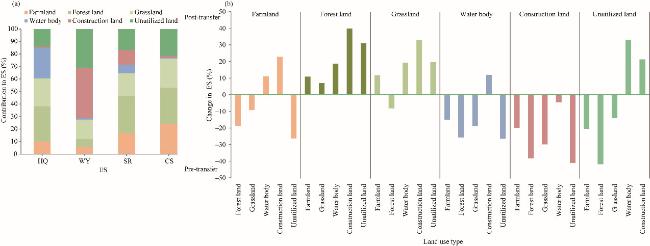
Fig. 9 Contribution percentage of distinct land use types (a) and impact of land use changes (b) on ESs in Gannan Prefecture from 2000 to 2020
Land use transformations significantly impacted the functionality of ES. Forest land, in particular, was the most significant contributor to these services, and transitions toward forest land from other land use types tended to enhance these benefits notably. For instance, converting construction land to forest land could increase ESs by approximately 39.70%, while transforming farmland into forest land would result in an increase of about 10.80% (Fig. 9b). In contrast, construction land and unutilized land offered minimal ES benefits. Thus, replacing grassland, forest land, farmland, or water body with unutilized land or construction land led to a marked reduction in ESs, with a decrease of 38.30% and 41.80%, respectively when forest land was converted to construction land or unutilized land.
The gradient effect of land use change on ES is evident (Ouyang et al., 2021), and alterations in land use structure are crucial to ecological security. At altitudes between 1000 and 2000 m, significant shifts included a reduction in farmland and an increase in construction land, indicating a loss of high-quality agricultural land, especially in farmland zones. As altitude increased, forest land and grassland became predominant. Above 2000 m, grassland occupied a larger proportion than any other land use types (Fig. 10). Differences in the ES across various land use types were marked (Fig. 11). Forest land and grassland more effectively enhanced HQ across different altitudes than other land use types. The WY was higher from construction and unutilized lands compared with other land use types at various altitudes. Forest land was paramount in contributing to SR within the 1000-2000 m altitude range. Across varying altitudes, farmland, forest land, and grassland consistently contributed to CS without notable variation. Hence, crafting policies for land utilization and devising ecological stewardship approaches that can accommodate the varied consequences of land use are crucial for maximizing ecological functionality.
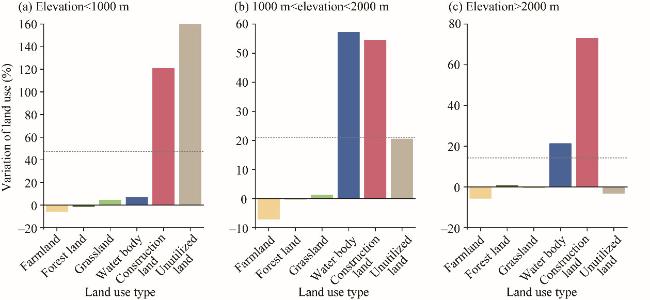
Fig. 10 Variation of land use under different elevations in Gannan Prefecture from 2000 to 2020. (a), elevation<1000 m; (b), 1000 m<elevation<2000 m; (c), elevation>2000 m.
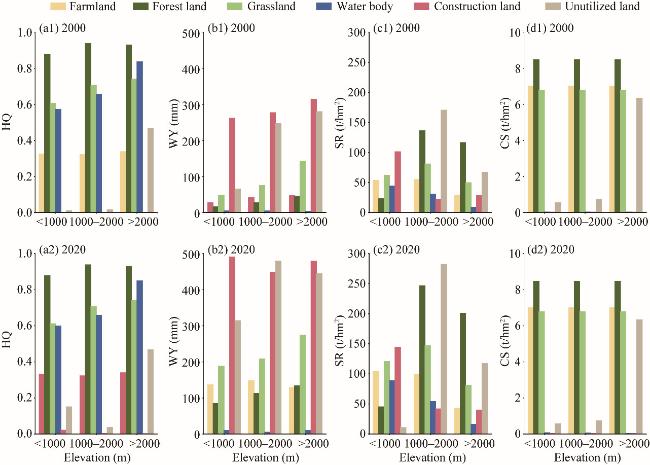
Fig. 11 ESs under different land use types and elevations in Gannan Prefecture in 2000 and 2020. (a1 and a2), HQ; (b1 and b2), WY; (c1 and c2), SR; (d1 and d2), CS.

4.4 Impact of different development patterns on ES

The baseline ESI in 2020 was 0.591, with projections indicating an increase to 0.626, 0.638, and 0.651 under scenarios of natural development, cultivated land protection, and ecological protection in 2030, respectively. This suggested a potential improvement in the level of ESs. Regions with high ESI, such as Tewo, Jone, and Zhugqu counties, benefited from extensive forest land and grassland coverage. In contrast, regions including Xiahe County, western Maqu County, and the border parts of Jone and Tewo counties showed lower ESI due to challenging topography and sparse vegetation. In the natural development scenario, a notable decline in ESI was observed, primarily due to increased construction land. The cultivated land protection scenario showed relative stabilization of ESI across 74.80% of the area. In the ecological protection scenario, areas experiencing an increase in ESI made up the largest share, at 26.07%, with minimal regions undergoing severe or moderate degradation (Fig. 12).
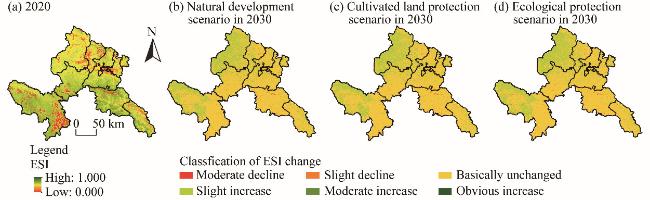
Fig. 12 Spatio-temporal pattern of ESI in 2020 (a) and ESI change under three predictive scenarios in 2030 compared with 2020 (b, c, and d) in Gannan Prefecture

5 Discussion

5.1 Changes in ES caused by different land use types

This study comprehensively examined the intricate relationship between land use dynamics and ESs in Gannan Prefecture. The research findings revealed significant spatio-temporal characteristics of ESs in Gannan Prefecture from 2000 to 2020. Specifically, except for a slight decline in CS and stable HQ, WY and SR exhibited upward trends. The notable increase in WY was primarily attributed to the dual influence of climate change and ecological policies. On the one hand, the intensified implementation of ecological conservation strategies and the enhanced vegetation cover improved the region's water storage and retention capabilities (Zhou et al., 2022). On the other hand, increased annual precipitation directly facilitated water recharge. Meanwhile, the enhancement of SR was mainly due to the "Grain for Green" program, where vegetation roots stabilized the soil and significantly reduced the risk of soil erosion, thereby improving SR (Tang et al., 2022). In contrast, the slight decline in CS was primarily caused by the rapid expansion of construction land encroaching upon farmland, driven by urbanization. Although HQ remained stable overall, localized degradation was observed in specific regions, reflecting the profound impact of human activities on the ecological environment. Land use simulation predictions for 2030 indicated that under the ecological conservation scenario, the ESI reached its highest level, while HQ showed a slight decline. This demonstrated that ESI, as a comprehensive evaluation index, through its internal weight balancing mechanism, could reflect the complex relationships among various ESs (Wu and Fan, 2022; Zhang et al., 2024). For instance, the improvement in WY and SR may have partially compensated for localized habitat degradation, highlighting the complexity of interactions and influences among ESs (Xia et al., 2023).
This study further analyzed the impact of land use type conversion on ESs. The increase in forest land, particularly due to the effective implementation of a series of ecological restoration measures such as the "Grain for Green Program" significantly enhanced ESs in Gannan Prefecture. The transition from construction land to forest land contributed notably to the improvement of ESs, with an increase of 39.7%. However, when forest land was converted into construction land, ESs declined by 38.3%. Similarly, the disorderly expansion of unutilized land led to a decrease of 41.8%. These changes reflect the importance of giving high priority to ecological conservation during the urbanization process to achieve coordinated economic, social, and environmental development (Li and Yi, 2020). This study explored the cascading effects among "land use change-ecosystem services (ESs)" within a multi-scenario simulation framework. Under the ecological conservation scenario, by effectively restricting the disorderly expansion of construction land and promoting forest land restoration, a synergistic enhancement of ESs was achieved. In contrast, under the natural development scenario, the conflict between the reduction of farmland and the disorderly expansion of construction land significantly exacerbated the contradiction between economic development and ecological conservation. By quantitatively analyzing the impacts of different land use type conversions on ESs, this study provided a reference for formulating scientific and reasonable land use policies and implementing effective ecological conservation measures.

5.2 Implications for land use management

This study identifies the diverse impacts of different types of land use change on ESs, providing decision-making support for determining the intensity of land development while further considering the balance between economic development and ecological conservation (Peng et al., 2011; Li et al., 2021). Land use change is driven not only by natural conditions but also by the rapid expansion of construction land during urbanization and the transformation of agricultural production methods (Han et al, 2009; Zhou et al., 2023). Issues such as the disorderly expansion of construction land, tension in farmland resources, and grassland degradation like Hezuo City and Tewo County all impacted ESs. The frequent conversion between farmland and grassland in Lintan County during agricultural restructuring might reduce ESs. Additionally, Luqu and Maqu counties faced challenges in managing water resources and protecting grasslands, while Xiahe, Zhugqu, and Jone counties exhibited a complex relationship between ecological protection and agricultural development. The sharp increase in land demand during urbanization also highlights the discord between urban planning and ecological protection (Zhang et al., 2019). Multi-scenario simulation results further emphasized the urgency of future land use management in Gannan Prefecture. Under a natural development scenario, the reduction of farmland and grassland, along with the encroachment of construction land on forest land, indicates a potential decline in ESs. Conversely, while the ecological protection scenario can promote an increase in forest land, the ongoing expansion of construction land remains an urgent issue that needs to be addressed. Although the cultivated land protection scenario can alleviate the trend of farmland reduction to some extent, it may also trigger new ecological issues.
In the future, macro-control over land use should be strengthened to ensure its scientific and forward-looking nature, with policies tailored to the ecological characteristics of each region (Cao et al., 2021; Yang et al., 2024). Hezuo City should clearly define boundaries for farmland protection, strictly controlling the expansion of construction land to alleviate the tension in farmland resources. Tewo County should establish a compensation mechanism for farmland and grassland conversion, promote the renovation of inefficient forest land, designate ecological resettlement areas, and reduce the intensity of human activity interference in the forest-grassland ecotone. Additionally, Lintan County should actively promote sustainable agricultural techniques such as crop rotation and intercropping to improve soil quality and ESs. Luqu and Maqu counties must enhance water resource management and implement scientific grazing systems. Furthermore, Xiahe County can explore integrated forestry-grassland management models to facilitate the conversion of ecological products into economic value. Zhogqu County should prioritize engineered conversion of farmland into grassland, improve slope runoff harvesting systems, and establish a mechanism for withdrawing land used for construction in geological disaster areas. Jone County needs to strictly enforce ecological reviews for the conversion of farmland into construction land and develop industrial chains for the forest understory economy.

5.3 Limitations and prospects

This study presented a novel framework by amalgamating the PLUS-InVEST model, thereby enhancing the ability to simulate and assess land use transformations. Such integration supports a detailed exploration of how these changes affect ESs, alongside their spatial and temporal variations. However, the difficulty in obtaining high-precision data over a long time series inevitably affects the analysis results due to data resampling (Su et al., 2023). The PLUS model predicts future trends based on historical land use change (Yang and Su, 2022). However, it is vital to note that external factors such as climate change and policy interventions may significantly influence the actual land use conditions (Fang et al., 2022). Moreover, the mechanisms behind changes in ESs are complex and result from the interplay of multiple factors (Hasan et al., 2020). The inherent uncertainty of the model and the sensitivity of param settings can also lead to deviations in the evaluation results (Sun and Shi, 2020). Additionally, the types of ES are diverse, this study focuses only on four main service types, which may not fully capture the overall state of the ecosystem. Furthermore, the impact of land use change on ES exhibits scale effects, while this study examined the issue solely from a raster scale. Therefore, future research should emphasize the deep integration of high-precision remote sensing data and ground-measured data to enhance the timeliness and spatial resolution of data, thereby improving the efficiency and accuracy of simulations. It is also necessary to construct a comprehensive dynamic coupling model that systematically integrates factors such as climate change, socio-economic development trends, and policy interventions. Additionally, establishing unified evaluation standards for ESs can help reduce discrepancies and uncertainties in assessment results, thereby enhancing the scientific rigor and comparability of evaluations. Future research directions should adopt a more comprehensive multidimensional perspective, focusing not only on the direct impacts of land use change on ESs but also exploring their indirect effects, cumulative impacts, and the resilience, disturbance resistance, and recovery capabilities of ecosystems under different land use patterns.

6 Conclusions

This study employed the PLUS model to project land use configurations for 2030 under several scenarios and evaluated ESs—HQ, WY, SR, and CS—in Gannan Prefecture from 2000 to 2030. The analysis of land use dynamics on these ESs produced several pivotal findings: grassland and forest land dominated the landscape in Gannan Prefecture, covering 56.77% and 30.72% of the total area, respectively. From 2000 to 2020, CS experienced a slight decline, HQ remained largely stable, and WY and SR showed positive trends. In scenarios projecting natural development, the expansion of construction land was particularly pronounced, indicating the greatest change. Increased construction land tended to encroach on ecological lands, resulting in reductions in both CS and SR. Under the cultivated land protection scenario, farmland area expanded by 2,726.64 hm2, which significantly bolstered food security, but also affected regional HQ due to intensified human activities. The ecological protection scenario saw a notable increase in forest land, with slower construction activity, which contributed substantially to improvement in HQ, SR, and CS. Forest land and grassland primarily enhanced ESs, whereas construction land significantly contributed to WY. The ecological protection scenarios have significantly optimized the ESs in Gannan Prefecture, achieving an average ESI value of 0.65. This underscores the core value of adopting an eco-priority strategy for the sustainable development of plateau ecological barrier regions. Future research should delve deeper and adopt a more diversified approach by focusing not only on integrating various land use scenarios to comprehensively understand their compound effects on ES functionalities, but also by emphasizing the significance of strategic land use planning and sustainable management that incorporate high-precision data integration, dynamic coupling models, and comprehensive evaluation standards. These efforts are crucial for effectively harnessing and enhancing the multifaceted benefits of ecosystems.

Conflict of interest

The authors declare that they have no known competing financial interests or personal relationships that could have appeared to influence the work reported in this paper.

Acknowledgements

This research was funded by the National Natural Science Foundation of China (42101276), the Major Project of Key Research Bases for Humanities and Social Sciences Funded by the Ministry of Education of China (22JJD790015), and the Science and Technology Project of Gansu Province, China (20JR5RA529).

Author contributions

Conceptualization: ZHANG Xuebin, LIU Yanni; Methodology: ZHANG Xuebin, LIU Yanni; Formal analysis: LIU Yanni, YIN Junfeng, SHI Jing; Writing - original draft preparation: LIU Yanni, YIN Junfeng; Writing - review and editing: SHI Peiji, FENG Haoyuan; Funding acquisition: ZHANG Xuebin; Resources: ZHANG Xuebin; Supervision: ZHANG Xuebin, SHI Peiji, FENG Haoyuan. All authors approved the manuscript.
Open Access This article is licensed under a Creative Commons Attribution 4.0 International License, which permits use, sharing, adaptation, distribution and reproduction in any medium or format, as long as you give appropriate credit to the original author(s) and the source, provide a link to the Creative Commons licence, and indicate if changes were made. The images or other third party material in this article are included in the article's Creative Commons licence, unless indicated otherwise in a credit line to the material. If material is not included in the article's Creative Commons licence and your intended use is not permitted by statutory regulation or exceeds the permitted use, you will need to obtain permission directly from the copyright holder. To view a copy of this licence, visit http://creativecommons.org/licenses/by/4.0/.
[1]
Cao M, Tian Y, Wu K, et al. 2023. Future land-use change and its impact on terrestrial ecosystem carbon pool evolution along the Silk Road under SDG scenarios. Science Bulletin, 68(7): 740-749.

[2]
Cao Y N, Kong L Q, Zhang L F, et al. 2021. The balance between economic development and ecosystem service value in the process of land urbanization: A case study of China's land urbanization from 2000 to 2015. Land Use Policy, 108(2): 105536, doi: 10.1016/j.landusepol.2021.105536.

[3]
Chen D S, Zhao Q Q, Jiang P H, et al. 2022. Incorporating ecosystem service to assess progress towards sustainable development goals: A case study of the Yangtze River Economic Belt, China. Science of the Total Environment, 806(Part 3): 151277, doi: 10.1016/j.scitotenv.2021.151277.

[4]
Costanza R, d'Arge R, de Groot R, et al. 1997. The value of the world's ecosystem services and natural capital. Nature, 387(6630): 253-260.

[5]
Costanza R, de Groot R, Sutton P, et al. 2014. Changes in the global value of ecosystem services. Global Environmental Change, 26: 152-158.

[6]
Deng Z W, Quan B. 2023. Intensity analysis to communicate detailed detection of land use and land cover change in Chang-Zhu-Tan Metropolitan Region, China. Forests, 14(5): 939, doi: 10.3390/f14050939.

[7]
Fang Z, Ding T H, Chen J Y, et al. 2022. Impacts of land use/land cover changes on ecosystem services in ecologically fragile regions. Science of the Total Environment, 831: 154967, doi: 10.1016/j.scitotenv.2022.154967.

[8]
Feng X H, Li Y, Wang X Z, et al. 2023. Impacts of land use transitions on ecosystem services: A research framework coupled with structure, function, and dynamics. Science of the Total Environment, 901: 166366, doi: 10.1016/j.scitotenv.2023.166366.

[9]
Fulford R S, Russell M, Myers M, et al. 2022. Models help set ecosystem service baselines for restoration assessment. Journal of Environmental Management, 317: 115411, doi: 10.1016/j.jenvman.2022.115411.

[10]
Gao J, Gong J, Li Y, et al. 2024. Ecological network assessment in dynamic landscapes: Multi-scenario simulation and conservation priority analysis. Land Use Policy, 139: 107059, doi: 10.1016/j.landusepol.2024.107059.

[11]
Han J, Hayashi Y, Cao X, et al. 2009. Evaluating land-use change in rapidly urbanizing China: Case study of Shanghai. Journal of Urban Planning and Development, 135(4): 166-171.

[12]
Hasan S S, Zhen L, Miah M G, et al. 2020. Impact of land use change on ecosystem services: A review. Environmental Development, 34: 100527, doi: 10.1016/j.envdev.2020.100527.

[13]
He L J, Xie Z Y, Wu H Q, et al. 2024. Exploring the interrelations and driving factors among typical ecosystem services in the Yangtze River Economic Belt, China. Journal of Environmental Management, 351: 119794, doi:10.1016/j.jenvman.2023.119794.

[14]
Hou Y, Y, Chen W, et al. 2017. Temporal variation and spatial scale dependency of ecosystem service interactions: a case study on the central Loess Plateau of China. Landscape Ecology, 32: 1201-1217.

[15]
Hu Y, Zheng Y M, Zheng X Q. 2013. Simulation of land-use scenarios for Beijing using CLUE-S and Markov composite models. Chinese Geographical Science, 23: 92-100.

[16]
Huang Z D, Bai Y, Alatalo J M, et al. 2020. Mapping biodiversity conservation priorities for protected areas: A case study in Xishuangbanna Tropical Area, China. Biological Conservation, 249: 108741, doi: 10.1016/j.biocon.2020.108741.

[17]
Jiang Y J, Shi B, Su G J, et al. 2021. Spatiotemporal analysis of ecological vulnerability in the Tibet Autonomous Region based on a pressure-state-response management framework. Ecological Indicators, 130: 108054, doi: 10.1016/j.ecolind.2021.108054.

[18]
Kang P, Chen W P, Hou Y, et al. 2019. Spatial-temporal risk assessment of urbanization impacts on ecosystem services based on pressure-status-response framework. Scientific Reports, 9(1): 16806, doi: 10.1038/s41598-019-52719-z.

[19]
Ke X L, Wang X Y, Guo H X, et al. 2021. Urban ecological security evaluation and spatial correlation research—based on data analysis of 16 cities in Hubei Province of China. Journal of Cleaner Production, 311: 127613, doi: 10.1016/j.jclepro.2021.127613.

[20]
Li J S, Guo X M, Chuai X W, et al. 2021. Reexamine China's terrestrial ecosystem carbon balance under land use-type and climate change. Land Use Policy, 102: 105275, doi: 10.1016/j.landusepol.2020.105275.

[21]
Li W W, Yi P T. 2020. Assessment of city sustainability—Coupling coordinated development among economy, society and environment. Journal of Cleaner Production, 256: 120453, doi: 10.1016/j.jclepro.2020.120453.

[22]
Liang X, Guan Q F, Clarke K C, et al. 2021. Understanding the drivers of sustainable land expansion using a patch-generating land use simulation (PLUS) model: A case study in Wuhan, China. Computers, Environment and Urban Systems, 85: 101569, doi: 10.1016/j.compenvurbsys.2020.101569.

[23]
Liu J, Xiong J N, Chen Y B, et al. 2023a. An integrated model chain for future flood risk prediction under land-use changes. Journal of Environmental Management, 342: 118125, doi: 10.1016/j.jenvman.2023.118125.

[24]
Liu M B, Xiong Y F, Zhang A L. 2023b. Multi-scale telecoupling effects of land use change on ecosystem services in urban agglomerations—A case study in the middle reaches of Yangtze River urban agglomerations. Journal of Cleaner Production, 415: 137878, doi: 10.1016/j.jclepro.2023.137878.

[25]
Liu X Y, Bakshi B R, Rugani B, et al. 2020. Quantification and valuation of ecosystem services in life cycle assessment: Application of the cascade framework to rice farming systems. Science of the Total Environment, 747: 141278, doi: 10.1016/j.scitotenv.2020.141278.

[26]
Liu Y J, Zou X T, Chen J, et al. 2022. Impacts of protected areas establishment on pastoralists' livelihoods in the Three-River-Source Region on the Qinghai-Tibetan Plateau. Land Use Policy, 115: 106018, doi: 10.1016/j.landusepol.2022.106018.

[27]
Ma R R, Zhou W, Ren J, et al. 2023. Multi-scenario simulation and optimization control of ecological security based on GeoSOS-FLUS model in ecological fragile area in Northeast Qinghai-Tibet Plateau, China. Ecological Indicators, 151: 110324, doi: 10.1016/j.ecolind.2023.110324.

[28]
Nelson E, Mendoza G, Regetz J, et al. 2009. Modeling multiple ecosystem services, biodiversity conservation, commodity production, and tradeoffs at landscape scales. Frontiers in Ecology and the Environment, 7(1): 4-11.

[29]
Ning J, Liu J Y, Kuang W H, et al. 2018. Spatiotemporal patterns and characteristics of land-use change in China during 2010-2015. Journal of Geographical Sciences, 28: 547-562.

[30]
Ouyang X, Tang L S, Wei X, et al. 2021. Spatial interaction between urbanization and ecosystem services in Chinese urban agglomerations. Land Use Policy, 109: 105587, doi: 10.1016/j.landusepol.2021.105587.

[31]
Peng J, Xu Y Q, Cai Y L, et al. 2011. The role of policies in land use/cover change since the 1970s in ecologically fragile karst areas of Southwest China: A case study on the Maotiaohe Watershed. Environmental Science & Policy, 14(4): 408-418.

[32]
Qiao X N, Gu Y Y, Zou C X, et al. 2019. Temporal variation and spatial scale dependency of the trade-offs and synergies among multiple ecosystem services in the Taihu Lake Basin of China. Science of the Total Environment, 651: 218-229.

[33]
Qu Y B, Zhang Y J, Wang S L, et al. 2023. Coordinated development of land multi-function space: An analytical framework for matching the supply of resources and environment with the use of land space for ecological protection, agricultural production and urban construction. Journal of Geographical Sciences, 33(2): 311-339.

[34]
Quintas-Soriano C, Castro A J, Castro H, et al. 2016. Impacts of land use change on ecosystem services and implications for human well-being in Spanish drylands. Land Use Policy, 54: 534-548.

[35]
Shen J S, Li S C, Liang Z, et al. 2020. Exploring the heterogeneity and nonlinearity of trade-offs and synergies among ecosystem services bundles in the Beijing-Tianjin-Hebei urban agglomeration. Ecosystem Services, 43: 101103, doi: 10.1016/j.ecoser.2020.101103.

[36]
Shen J S, Li S C, Wang H, et al. 2023. Understanding the spatial relationships and drivers of ecosystem service supply-demand mismatches towards spatially-targeted management of social-ecological system. Journal of Cleaner Production, 406: 136882, doi: 10.1016/j.jclepro.2023.136882.

[37]
Su Y Q, Feng Q, Liu W, et al. 2023. Improved understanding of trade-offs and synergies in ecosystem services via fine land-use classification and multi-scale analysis in the arid region of Northwest China. Remote Sensing, 15(20): 4976, doi: 10.3390/rs15204976.

[38]
Sun S, Shi Q. 2020. Global spatio-temporal assessment of changes in multiple ecosystem services under four IPCC SRES land-use scenarios. Earth's Future, 8(10): e2020EF001668, doi: 10.1029/2020EF001668.

[39]
Sun Y X, Liu S L, Dong Y H, et al. 2019. Spatio-temporal evolution scenarios and the coupling analysis of ecosystem services with land use change in China. Science of the Total Environment, 681: 211-225.

[40]
Tallis H, Polasky S. 2009. Mapping and valuing ecosystem services as an approach for conservation and natural-resource management. Annals of the New York Academy of Sciences, 1162(1): 265-283.

[41]
Tang Q, Wang J M, Jing Z R, et al. 2021. Response of ecological vulnerability to land use change in a resource-based city, China. Resources Policy, 74: 102324, doi: 10.1016/j.resourpol.2021.102324.

[42]
Tang Z X, Zhou Z X, Wang D, et al. 2022. Impact of vegetation restoration on ecosystem services in the Loess Plateau, a case study in the Jinghe Watershed, China. Ecological Indicators, 142, 109183, doi: 10.1016/j.ecolind.2022.109183.

[43]
Wang N F, Chen X P, Zhang Z L, et al. 2022a. Spatiotemporal dynamics and driving factors of county-level carbon storage in the Loess Plateau: A case study in Qingcheng County, China. Ecological Indicators, 144: 109460, doi: 10.1016/j.ecolind.2022.109460.

[44]
Wang S J, Liu H, Yu Y, et al. 2020. Evaluation of groundwater sustainability in the arid Hexi Corridor of Northwestern China, using GRACE, GLDAS and measured groundwater data products. Science of the Total Environment, 705: 135829, doi: 10.1016/j.scitotenv.2019.135829.

[45]
Wang Y, Li X M, Zhang Q, et al. 2018. Projections of future land use changes: Multiple scenarios-based impacts analysis on ecosystem services for Wuhan City, China. Ecological Indicators, 94: 430-445.

[46]
Wang Y X, Wang H M, Liu G, et al. 2022b. Factors driving water yield ecosystem services in the Yellow River Economic Belt, China: Spatial heterogeneity and spatial spillover perspectives. Journal of Environmental Management, 317: 115477, doi: 10.1016/j.jenvman.2022.115477.

[47]
Wei J M, Li C B, Wu L, et al. 2021. Study on soil erosion in northwestern Sichuan and southern Gansu (NSSG) based on USLE. Journal of Soil and Water Conservation, 35(2): 31-37. (in Chinese).

[48]
Wu L L, Fan F L. 2022. Assessment of ecosystem services in new perspective: A comprehensive ecosystem service index (CESI) as a proxy to integrate multiple ecosystem services. Ecological Indicators, 138, 108800, doi: 10.1016/j.ecolind.2022.108800.

[49]
Xia H, Yuan S F, Prishchepov A V. 2023. Spatial-temporal heterogeneity of ecosystem service interactions and their social-ecological drivers: Implications for spatial planning and management. Resources, Conservation and Recycling, 189, 106767, doi: 10.1016/j.resconrec.2022.106767.

[50]
Xiao X, Wang Q Z, Guan Q Y, et al. 2022. Assessing the sustainability of ecosystems over fourteen years of cultivation in Longnan City of China based on emergy analysis method. Journal of Environmental Management, 307: 114513, doi: 10.1016/j.jenvman.2022.114513.

[51]
Xie L, Wang H W, Liu S H. 2022. The ecosystem service values simulation and driving force analysis based on land use/land cover: A case study in inland rivers in arid areas of the Aksu River Basin, China. Ecological Indicators, 138: 108828, doi: 10.1016/j.ecolind.2022.108828.

[52]
Xu Q L, Zhu A X, Liu J. 2023a. Land-use change modeling with cellular automata using land natural evolution unit. Catena, 224: 106998, doi: 10.1016/j.catena.2023.106998.

[53]
Xu W J, Song J X, Long Y Q, et al. 2023b. Analysis and simulation of the driving mechanism and ecological effects of land cover change in the Weihe River basin, China. Journal of Environmental Management, 344: 118320, doi: 10.1016/j.jenvman.2023.118320.

[54]
Xue L Q, Wang J, Zhang L C, et al. 2019. Spatiotemporal analysis of ecological vulnerability and management in the Tarim River Basin, China. Science of the Total Environment, 649: 876-888.

[55]
Yan F P, Shangguan W, Zhang J, et al. 2020. Depth-to-bedrock map of China at a spatial resolution of 100 m. Scientific Data, 7(1): 2, doi: 10.1038/s41597-019-0345-6.

[56]
Yan X, Li L H. 2023. Spatiotemporal characteristics and influencing factors of ecosystem services in Central Asia. Journal of Arid Land, 15(1): 1-19.

[57]
Yang Q, Liu G Y, Lombardi G V, et al. 2023. Attribution of upstream-downstream transitive natural and human imprint on watershed ecosystem services variations. Journal of Cleaner Production, 413: 137421, doi: 10.1016/j.jclepro.2023.137421.

[58]
Yang S, Su H. 2022. Multi-scenario simulation of ecosystem service values in the Guanzhong Plain Urban Agglomeration, China. Sustainability, 14(14): 8812, doi: 10.3390/su14148812.

[59]
Yang Y, Yuan X F, An J J, et al. 2024. Drivers of ecosystem services and their trade-offs and synergies in different land use policy zones of Shaanxi Province, China. Journal of Cleaner Production, 452: 142077, doi: 10.1016/j.jclepro.2024.142077.

[60]
Yin Z L, Feng Q, Zhu R, et al. 2023. Analysis and prediction of the impact of land use/cover change on ecosystem services value in Gansu Province, China. Ecological Indicators, 154: 110868, doi: 10.1016/j.ecolind.2023.110868.

[61]
Yuan Y, Bai Z K, Zhang J J, et al. 2023. Investigating the trade-offs between the supply and demand for ecosystem services for regional spatial management. Journal of Environmental Management, 325: 116591, doi: 10.1016/j.jenvman.2022.116591.

[62]
Zhang D, Wang X R, Qu L P, et al. 2020. Land use/cover predictions incorporating ecological security for the Yangtze River Delta region, China. Ecological Indicators, 119: 106841, doi: 10.1016/j.ecolind.2020.106841.

[63]
Zhang K R, Jin Y Z, Li D Y, et al. 2024. Spatiotemporal variation and evolutionary analysis of the coupling coordination between urban social-economic development and ecological environments in the Yangtze River Delta cities. Sustainable Cities and Society, 111: 105561, doi: 10.1016/j.scs.2024.105561.

[64]
Zhang W T, Wang H J, Cao K, et al. 2019. Ecological conservation-and economic development-based multiobjective land-use optimization: Case study of a rapidly developing city in central China. Journal of Urban Planning and Development, 145(1): 05018023, doi: 10.1061/(ASCE)UP.1943-5444.0000481.

[65]
Zhang Z, Jiang W G, Peng K F, et al. 2023. Assessment of the impact of wetland changes on carbon storage in coastal urban agglomerations from 1990 to 2035 in support of SDG15.1. Science of the Total Environment, 877: 162824, doi: 10.1016/j.scitotenv.2023.162824.

[66]
Zhang Z M, Peng J, Xu Z H, et al. 2021. Ecosystem services supply and demand response to urbanization: A case study of the Pearl River Delta, China. Ecosystem Services, 49: 101274, doi: 10.1016/j.ecoser.2021.101274.

[67]
Zhao X Q, Xu Y F, Pu J W, et al. 2024. Achieving the supply-demand balance of ecosystem services through zoning regulation based on land use thresholds. Land Use Policy, 139: 107056, doi: 10.1016/j.landusepol.2024.107056.

[68]
Zheng H N, Peng J, Qiu S J, et al. 2022. Distinguishing the impacts of land use change in intensity and type on ecosystem services trade-offs. Journal of Environmental Management, 316: 115206, doi: 10.1016/j.jenvman.2022.115206.

[69]
Zhou J L, Liu Q, Liang L Q, et al. 2022. More portion of precipitation into soil water storage to maintain higher evapotranspiration induced by revegetation on China's Loess Plateau. Journal of Hydrology, 615, 128707, doi: 10.1016/j.jhydrol.2022.128707.

[70]
Zhou W Z, Liu G H, Pan J J, et al. 2005. Distribution of available soil water capacity in China. Journal of Geographical Sciences, 15: 3-12.

[71]
Zhou Y, Zhong Z, Cheng G Q. 2023. Cultivated land loss and construction land expansion in China: Evidence from national land surveys in 1996, 2009 and 2019. Land Use Policy, 125: 106496, doi: 10.1016/j.landusepol.2022.106496.

[72]
Zou Y, Meng J J, Zhu L K, et al. 2024. Characterizing land use transition in China by accounting for the conflicts underlying land use structure and function. Journal of Environmental Management, 349: 119311, doi: 10.1016/j.jenvman.2023.119311.

Outlines

/