Research article

Applying joint species distribution modelling to assess the relative influence of ecological filters on community assembly in the El Bayadh steppe, Algeria

  • Patrick-Nino OLOUMANE , 1, * ,
  • Carlo PREVIL 2 ,
  • Wael El ZEREY 3 ,
  • Asma El ZEREY-BELASKRI 4
Expand
  • 1Department of Environmental Sciences, Forest Research Institute, University of Quebec, Rouyn-Noranda J9X 5E4, Canada
  • 2Laboratory of Methodologies for Supporting Territorial Decision-Making and Applications, University of Quebec, Rouyn- Noranda J9X 5E4, Canada
  • 3Faculty of Earth and Universe Sciences, Departement of geography and Urban planning, University of Oran 2, Oran 31000, Algeria
  • 4Laboratory of Rhizobia Biotechnology and Plant Improvement, Faculty of Natural and Life Sciences, University of Oran 1, Oran 31000, Algeria
*Patrick-Nino OLOUMANE (E-mail: )

Received date: 2025-01-02

  Revised date: 2025-03-29

  Accepted date: 2025-04-03

  Online published: 2025-08-12

Abstract

Understanding plant community assembly is crucial for effective ecosystem conservation and restoration. The ecological filter framework describes community assembly as a process shaped by dispersal, environmental, and biotic filters. Additionally, functional traits and phylogenetic relationships are increasingly recognized as important factors influencing species coexistence and community structure. However, both the ecological filter framework and the roles of functional traits and phylogeny in community assembly remain underexplored in the Algerian steppes—particularly in the El Bayadh region, where ongoing vegetation degradation threatens ecosystem stability. This study applied Hierarchical Modeling of Species Communities (HMSC) as an integrative approach to assess how ecological filters influence plant community assembly in the El Bayadh steppe and to evaluate the roles of functional traits and phylogenetic relationships in this process. Environmental data—including soil properties, topography, precipitation, and land use types (grazing and exclosure)—were collected across 50 plots in April and October, 2023, along with functional traits from 24 species. These traits include root length, leaf area, specific leaf area, clonality, life history, and seed mass. HMSC results revealed that soil properties and precipitation were the primary drivers of community structure, while sand height and elevation had a moderate influence. In contrast, competition and grazing played relatively minor roles. Species responses to environmental covariates were heterogeneous: soil fertility and texture had mixed effects, benefiting some species while limiting others; sand encroachment and precipitation variability generally had negative impacts, whereas grazing exclusion favored many species. A weak phylogenetic signal was recorded, indicating that community assembly was driven more by environmental filtering than by shared evolutionary history. Functional trait responses to environmental variation reflected plant strategies that balanced resource acquisition and conservation. Specifically, seed mass, leaf area, and root length increased under higher soil moisture and nutrient availability but declined in response to salinity, precipitation variability, and sand height. Clonality and perennial life history traits enhanced the survival of plant species under harsh conditions. Overall, this study provides a holistic understanding of community assembly processes in the El Bayadh steppe and offers valuable insights for ecosystem management and restoration in arid and degraded ecosystem environments.

Cite this article

Patrick-Nino OLOUMANE , Carlo PREVIL , Wael El ZEREY , Asma El ZEREY-BELASKRI . Applying joint species distribution modelling to assess the relative influence of ecological filters on community assembly in the El Bayadh steppe, Algeria[J]. Journal of Arid Land, 2025 , 17(7) : 979 -996 . DOI: 10.1007/s40333-025-0082-y

1 Introduction

Understanding the mechanisms and drivers of plant community assembly is a key challenge in ecology and is crucial for developing effective ecosystem conservation and restoration strategies (Weiher and Keddy, 2001; Keddy and Laughlin, 2021; Wang et al., 2022). The literature identifies two fundamental theories that explain community assembly (Weiher et al., 2011; Ovaskainen and Abrego, 2020; Lv et al., 2024). The first niche theory posits that community assembly is primarily driven by deterministic processes, where species interactions (e.g., competition and facilitation) and abiotic factors (e.g., climate and soil characteristics) act as key filters shaping the community (Grinnell, 1917; Elton, 1927). According to this theory, each species occupies a distinct ecological niche, and niche differentiation—through partitioning resources—facilitates coexistence by minimizing competitive overlap (Dong et al., 2019; Braun and Lortie, 2024). The second theory, proposed by Hubbell (2001), assumes that species within the same trophic level are ecologically equivalent and that stochastic processes, including dispersal limitation, ecological drift, and random extinction events, shape community composition. Since these two theories are not mutually exclusive, ecological research has developed integrative frameworks to explain community assembly processes. Among these, the community assembly rule framework, commonly referred to as ecological filtering, has been widely applied in plant and animal communities to assess the relative influence of abiotic and biotic constraints on species coexistence (Weiher and Keddy, 2001; Keddy and Laughlin, 2021). The ecological filter framework posits that community composition emerges from selecting species from a regional pool through ecological filters, including dispersal, environmental, and biotic filters (Lortie et al., 2004; Keddy and Laughlin, 2021). Dispersal filtering selects species based on their ability to reach and establish themselves within the local community. Environmental filtering, encompassing physicochemical factors (e.g., soil properties, precipitation, temperature, and topography), selects species capable of tolerating abiotic stressors. Conversely, biotic filtering selects species based on their ability to cope with biotic interactions such as competition, facilitation, or herbivory (Schamp et al., 2022). The ecological filter framework constitutes an integrated approach to understanding community assembly by simultaneously analyzing all the processes that govern the establishment and persistence of species within an ecosystem (Lortie et al., 2004). This approach enables the development of more effective conservation strategies specifically tailored to the ecological characteristics of each ecosystem. However, despite its theoretical advancements, practical applications of this framework remain limited, particularly in arid and semi-arid ecosystems such as the Algerian steppes, notably in those of the El Bayadh region (Slimani and Aidoud, 2018).
The El Bayadh steppe, located in the northwest of Algeria, are low-productivity environments characterized by limited precipitation and high temperatures. In its viable state, this ecosystem provides essential ecosystem services, including forage provision for livestock, carbon sequestration in soils, climate regulation, and soil stabilization (Maatoug and Kharytonova, 2018). It also supports plant biodiversity specifically adapted to arid conditions (Okkacha et al., 2014). However, for several decades, this ecosystem has suffered degradation of its vegetation cover, soil, and floristic biodiversity due to human activities and increasing aridity (Alliouche and Kouba, 2023). Addressing this degradation requires a thorough understanding of the ecological filters driving community assembly, which is crucial for developing effective ecosystem management and restoration strategies (Slimani and Aidoud, 2018).
Current studies on ecological filters in the El Bayadh region mainly focus on the influence of precipitation and grazing, which are considered the primary ecological filters driving the assembly of plant communities in the steppe ecosystem of the El Bayadh region (El Zerey et al., 2009; Amghar et al., 2012; Belala et al., 2018; Bekai et al., 2019; Frih et al., 2021; Zouidi et al., 2023). While these two factors significantly impact arid ecosystems, this focus limits the exploration of other important ecological filters. In addition to precipitation and grazing, factors such as edaphic variables (Adjabi et al., 2019), sand encroachment (Bouallala et al., 2023), topography (Abdelghani et al., 2016), and competition (Stubbs and Bastow, 2004) substantially affect community assembly in arid and semi-arid areas. Edaphic factors play a crucial role in structuring plant communities in arid and semi-arid areas (Kargar-Chigani et al., 2017). The soils of the El Bayadh region are characterized by a high alkaline pH, low fertility, elevated temperatures, and significant limestone content (Belaroui et al., 2014). These harsh soil conditions act as an environmental filter, allowing only species capable of tolerating such constraints to thrive, thereby limiting overall species diversity. Sand encroachment further exacerbates these edaphic challenges, as the deposition of sand from the Saharan area and ongoing soil degradation favor psammophilous plant species that are well-adapted to sandy environments (Bouallala et al., 2023). Furthermore, topography also serves as an environmental filter by modulating local environmental conditions, particularly microclimates and soil properties (Kumar et al., 2023). By influencing temperature, moisture, and nutrient availability, topography selects species capable of adapting to specific conditions. Variations in elevation and slope create diverse microclimates, where certain areas provide favorable conditions for plant growth, while others impose stricter abiotic constraints (Yang et al., 2020). Finally, competition plays a role in shaping plant communities (Stubbs and Bastow, 2004). While environmental filtering generally predominates in arid environments (Li et al., 2018; Erdős et al., 2024; Lv et al., 2024), some studies suggest that competition can intensify under increasingly stressful environmental conditions. For instance, Wang et al. (2021) demonstrated that competition intensity increases along a desertification gradient. Given the ongoing aridification of the El Bayadh steppe (El Zerey et al., 2009), it is crucial to assess the role of competition as a biotic filter to better understand the mechanisms driving community assembly.
The taxonomic approach remains the most widely used analytical framework in studies conducted in the El Bayadh region (Ghezlaoui et al., 2013; Habib et al., 2014; Ghiloufi et al., 2015; Kouba et al., 2021; Attaoui et al., 2024). However, the broader literature highlights several limitations of this method. It fails to generalize ecological principles beyond the studied areas, and it does not account for the influence of functional traits and phylogenetic relationships on plant responses to environmental variations (Mcgill et al., 2006; Garnier and Navas, 2012; Laughlin et al., 2015). Nevertheless, the functional and phylogenetic dimensions are crucial for understanding species adaptation strategies and their persistence under changing environmental conditions (Weiher and Keddy, 1995).
The most used statistical frameworks in studies conducted in the El Bayadh region are ordination methods, including canonical correspondence analysis (CCA), non-metric multidimensional scaling (NMDS), and detrended correspondence analysis (DCA) (Ghezlaoui et al., 2013; Ghiloufi et al., 2015; Naouel and Sirine, 2020; Sahnouni and Abdesselam, 2023). While useful for visualizing ecological gradients and species distribution patterns, these methods have significant limitations. They do not allow for quantifying the relative influence of each ecological filter nor account for species co-occurrence phenomena (Ovaskainen and Abrego, 2020). These limitations hinder a mechanistic understanding of community assembly processes, thereby restricting the development of ecologically relevant management and restoration strategies.
To address these limitations, recent advances in ecological community modelling propose integrated frameworks capable of simultaneously accounting for the influence of multiple ecological filters while incorporating functional and phylogenetic dimensions (Tikhonov et al., 2020; Zhang et al., 2020b). Joint species distribution models (JSDMs), such as the Hierarchical Modeling of Species Communities (HMSC), offer a robust alternative to traditional taxonomic and ordination-based approaches (Ovaskainen and Abrego, 2020). HMSC is a multivariate hierarchical Bayesian model that jointly models species occurrences as a function of environmental covariates, species traits, and spatial structure (Seoane et al., 2023). By integrating fixed and random effects, HMSC captures the influence of environmental filtering, the influence of functional traits and phylogenetic relationships in the response of species to environment change, and species co-occurrence patterns, making it particularly effective in revealing mechanisms such as competition and dispersal limitation (Ovaskainen and Abrego, 2020). Moreover, functional traits and species phylogeny are increasingly used as key variables for improving the accuracy of ecological models (Shipley et al., 2011; Laughlin et al., 2012; Laughlin and Laughlin, 2013). Traits represent a species' morphological, physiological, or phenological characteristics that influence its performance within a habitat (Ovaskainen et al., 2017; Seoane et al., 2023). Incorporating these traits into assembly community modelling allows for a more nuanced evaluation of plant responses to environmental covariates and improves the accuracy in determining the influence of ecological filters (Violle et al., 2007; Lavorel et al., 2011). Furthermore, species that are closely related from an evolutionary perspective often share similar physical characteristics and ecological behaviors (Kraft and Ackerly, 2010). We can better capture these similarities and differences by including phylogenetic data in community assembly modelling, thereby improving prediction accuracy (Xu et al., 2017). This is especially helpful for species that have not been extensively studied empirically (Emerson and Gillespie, 2008; Peterson et al., 2021).
This study assessed the influence of each ecological filter on community assembly using the HMSC model. Specifically, we aim to answer the following questions: (1) what is the contribution of each ecological filter to community assembly in the El Bayadh steppe? and (2) how do functional traits and phylogeny affect species responses to environmental changes?

2 Materials and methods

2.1 Study area

The study area (33°30′-34°28′N, 00°10′W-01°06′E; Fig. 1) is located in the northern part of the El Bayadh Province, Algeria. It serves as a transition zone between the Tell Atlas and the Sahara (El Zerey et al., 2009). The altitudes range from 900 to 1400 m (Negadi et al., 2014). The climate is semi-arid, characterized by cold winters and hot and dry summers (González et al., 2009). Precipitation is low, with an annual average of 230 mm recorded between 1990 and 2020. The mean annual temperature is 18.0°C (-0.9°C in winter and 36.7°C in summer) (Slimani and Aidoud, 2018). The soil is alkaline with a high calcium carbonate content. It contains low organic matter and humidity, and its texture varies from sandy to sandy-loamy and loamy.
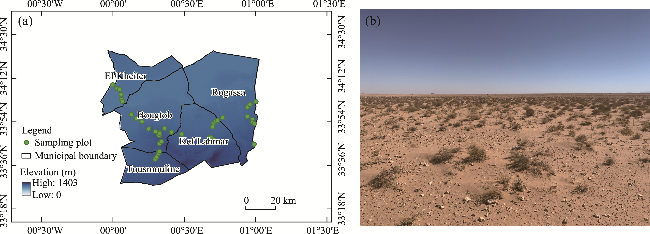
Fig. 1 Geographical distribution of vegetation sampling plots across the study area (a) and example of a degraded steppe in Kef Lahmar municipality, El Bayadh Province, Algeria (b)
The vegetation of the El Bayadh steppe is well-adapted to arid and semi-arid conditions. In the 1980s, the dominant species included Stipa tenacissima and Artemisia herba-alba, however, since the 1990s, desertification has significantly altered the plant composition (Slimani et al., 2010). The current plant community primarily consists of psammophilous species such as Thymelaea microphylla, Lygeum spartum, Stipagrostis pungens, and Atractylis serratuloides (Slimani and Aidoud, 2018). This steppe provides diverse and essential ecosystem services, including forage for grazing livestock, cropland productivity, and carbon storage, which are critical for both human livelihoods and environmental stability (Nedjraoui et al., 2016; Nasrallah et al., 2020).

2.2 Vegetation sampling

The land use changes in the study area from 1980 to 2020 were analyzed using ArcGIS to quantify the decline of steppe vegetation cover and identify various ecological patterns. A total of 50 plots, each measuring 64 m×64 m, were selected for this study. We organized the sampling process based on the aridity gradient at the overall scale of the study area. Furthermore, at the community level, sampling was refined by considering vegetation cover density, management type (grazed or ungrazed), and topographical characteristics. Specifically, 19 plots were established in ungrazed areas, including Kef Lahmar (8), Tousmouline (2), Rogassa (6), Bougtob (1), and El Kreither (2), while 31 plots were designed in the grazed areas Kef Lahmar (8), Tousmouline (9), Rogassa (3), Bougtob (6), and El Kreither (5). Data collection on vegetation occurrence in the sampling plots was conducted in April and October, 2023, corresponding to the optimal periods for plant growth in the Algerian steppe (El Zerey et al., 2009). In each plot, species abundance was estimated using the point intercept method. This involves systematically placing a small-diameter sampling pole (or pins) along diagonal transects within the plot and recording the plant species that come into direct contact with the sampling points (Bonham, 1989). This method is preferred over the quadrat technique due to its suitability for the low vegetation density characteristic of steppe regions (Frenette, 2013).

2.3 Functional traits and phylogenetic data

We selected six functional traits from a core list relevant to understanding plant responses to ecological filters (Table 1). Leaf area and specific leaf area were chosen to assess plant responses to abiotic factors. Root length, clonality, and life history were selected to assess plant responses to biotic filters. Seed mass was the only trait related to dispersal (Weiher et al., 1999). Trait values were measured in the field at the plot level on species representing at least 80% of the vegetation cover in each plot (Pakeman and Quested, 2007; Lavorel et al., 2011). Individuals randomly selected from each species were used to measure traits, and the average was used to represent the mean trait and its variability for each species. A tape measure was employed to record root length. The plant was carefully removed from the soil to measure root length accurately and minimize measurement errors.
Table 1 Functional traits and their ecological function
Functional trait Ecological function Ecological filter
Specific leaf area Acquisition, retention, and growth Environmental
Leaf area Acquisition and retention Environmental
Seed mass Dispersion and germination Dispersal
Life history Persistence Biotic
Clonality Space acquisition Biotic
Root length Resource acquisition Biotic
The sampling and treatment of leaves used for measuring specific leaf area and leaf area were conducted according to the protocol described by Garnier et al. (2001). The leaves were harvested from 25 individuals of each species and placed in bottles filled with deionized water before being transported to the laboratory in a cooler (Garnier et al., 2001). The leaf surface was obtained by analyzing pictures of fresh leaves with ImageJ software v.1.8 (National Institutes of Health, Bethesda, USA). Then, the leaves were dried at 60.0°C to a constant weight, and the specific leaf area was calculated (Yu et al., 2023). Seed mass data were obtained from the work of Frenette (2013) and Kouider and Maifi (2018). Clonality and life history were collected by observation in the field. A phylogenetic tree was created by transforming the taxonomy data in R v.4.4.2 using the phylo feature from the 'ape' package (Paradis and Schliep, 2019).

2.4 Explanatory variables

Climatic data, soil characteristics, topography, and land use types (grazing and exclosure) were collected for the 50 plots. We selected 12 climatic variables from 1990 to 2020 from the TerraClimate dataset (http://www.climatologylab.org/terraclimate.html). TerraClimate is a dataset that provides monthly climate and climatic water balance data for terrestrial surfaces worldwide (Abatzoglou et al., 2018). These variables encompass annual and seasonal precipitation (winter, autumn, summer, and spring), potential evapotranspiration, Palmer Drought Severity Index, average annual temperature, and both maximum and minimum temperatures. To mitigate the risks of multicollinearity and model overfitting, we performed a principal component analysis (PCA) to reduce the number of climatic variables (Seoane et al., 2023). The precipitation-related variables were reduced to two principal components, P1 and P2, which explained 90% of the total variance in precipitation within the study area. Component P1 (explaining 70% of the total variance in precipitation) represented a north-south humidity gradient, while Component P2 (explaining 20% of the total variance in precipitation) captured seasonal variability. Additionally, temperature variables were synthesized into a single principal component, T1 (explaining 60% of the total variance in temperature), reflecting a general temperature gradient. Furthermore, a Spearman correlation test was conducted between species occurrence and the climatic principal components (P1, P2, and T1) to select the most explanatory variables (Pratt et al., 2022). P1 and P2 were found significantly correlated with species occurrence, while T1 was not significantly correlated. Based on this analysis, we used P1 and P2 as the climatic data in the Species Distribution Model (SDM).
Additionally, we analyzed eight soil property variables. The chemical variables included pH, soil moisture, carbon-to-nitrogen ratio, salinity, electrical conductivity, and calcium carbonate (CaCO3). The physical variables were granulometry and sand height. We reduced the chemical variables to two principal components. The first component (S1) captured a gradient related to salinity and electrical conductivity, while the second component (S2) represented a gradient of fertility and moisture. The soil samples applied to analyze the physical and chemical properties were collected from designated plots used for vegetation sampling. Soil pH, salinity, and electrical conductivity were measured using an Oakton WD-35634-35 pH meter (Oakton Instruments, Vernon Hills, USA). Soil moisture content was determined by calculating the difference between the fresh and dry masses of the soil (Barbagelata, 2006). The CHN analyzer (Flash 2000, Thermo Fisher Scientific, Waltham, USA) was used to determine the soil's carbon and nitrogen contents (Telek and Marshall, 1974). CHN analyzers combust the soil samples at high temperatures, converting the carbon and nitrogen into gases that are then quantified (Telek and Marshall, 1974). The proportion of soil CaCO3 was determined by the soil's reaction to hydrochloric acid (HCl). The intensity and duration of effervescence provide qualitative insights into the amount of CaCO3 in the soil (Paltseva, 2024). To determine soil texture, we used the sedimentation method, which relies on the principle that larger, heavier particles settle more rapidly in water than smaller, lighter particles (Yudina et al., 2020). Sand height was measured in the field using tape (Wang et al., 2021). We measured the height of the sand from the level of the firm ground as a reference up to the maximum height of the sand present in the plot. Elevation was identified as the most relevant topographic variable in this study, as it showed the strongest Spearman correlation with species occurrence among all topographic variables. It was measured in the field using the Trimble Geo 7X GPS (Trimble Inc., Sunnyvale, USA).

2.5 Structure of HMSC and linking with ecological filters

HMSC is a joint species distribution model featuring a hierarchical structure that enables us to evaluate how environmental and biotic filters influence community assembly (Ovaskainen and Abrego, 2020). HMSC also accounts for the study design and the geographical coordinates of the study area to quantify stochastic processes at the local level (plots). HMSC is a multivariate hierarchical generalized linear mixed model fitted with Bayesian inference (Ovaskainen et al., 2017; Ovaskainen and Abrego, 2020). Thus, for plot i, the distribution of species j (Yij) can be expressed as: Yij~D(Lij, σj2), where D is a statistical distribution (Probit, normal, or Poisson) suitable for the type of data used in Yij; Lij is the linear predictor; and σj2 is a variance term for the distribution of species j. The linear predictor Lij is modelled from a fixed part LF, and a random part LR. LF represents the distribution of species j that is explained by the environmental covariates. It can be expressed as a linear regression: Lij=∑(xikβjk), where xik represents the value of covariate k in the plot i and βjk represents the response of species j to covariate k. βjk depends on the value of the functional traits and phylogeny and is modelled as follows: βjk~Normal(uj, V⨂[ρC+(1-ρ)I]), where uj represents the expected fundamental niche of species j; V is the variation around this expectation; ⨂ represents the Kronecker product; ρ measures the strength of the phylogenetic signal; and C and I represent the phylogenetic relationship matrix and the identity matrix, respectively. The paramater uj accounts for the trait's effect on plant response to covariate k and can be modelled as: uj=∑(tjlγlk), where tjl represents the value of trait l for species j and γlk represents the effect of trait l on the species response to covariate k. ρ ranges from 0 to 1; when ρ=0, the residual variance is independent among species, indicating that closely related species do not have more similar environmental niches than distantly related ones (Ovaskainen and Abrego, 2020). As ρ approaches 1, the species' environmental niches are fully structured by their phylogeny, with closely related species exhibiting greater niche similarity than expected by chance, reflecting niche conservatism (Ovaskainen and Abrego, 2020). The random term LR enables modelling the variations in species occurrence and co-occurrence that cannot be attributed to species responses to the environmental covariates. LR can be expressed as follows: LR=εijS, where ε refers to a random effect that operates at the level of the sampling unit S. These random effects will be modelled as: εijS~Normal(0, Ω𝑆), where Ω𝑆 is a species-by-species residual variance-covariance matrix.
HMSC can be conceptually linked to the assembly rules framework (Ovaskainen et al., 2017). The fixed effects (LF) component of HMSC models environmental filtering—that is, how the interplay between species' niches and environmental heterogeneity influences species occurrence and abundance. The random effects (LR) part of HMSC models biotic filtering, namely how the ecological interactions among species influence their occurrences, particularly their co-occurrences. A key parameter of this part of HMSC is the species-to-species association matrix Ω, which describes those species pairs that are found together either more or less often than expected by chance (Ovaskainen et al., 2017; Ovaskainen and Abrego, 2020). Dispersal limitation also causes variations in species occurrence that environmental filtering cannot explain, resulting, for example, in a species being absent from an area where the environmental conditions are suitable. Therefore, the influences of dispersal limitation will also be reflected in the random effects part of HMSC (Ovaskainen and Abrego, 2020).

2.6 SDM for the El Bayahd steppe by HMSC

Two models were developed to evaluate whether incorporating functional traits and phylogeny improves model accuracy and performance (Ovaskainen and Abrego, 2020). The full model (PA) included all input data, such as species occurrence (presence/absence), environmental covariates, functional traits, the phylogenetic tree, and the study design, while the environmental model (PA.Env) excluded functional traits and the phylogenetic tree. We built a probit regression model (with species presence/absence as the response variable) for the occurrences of 24 species, including the 8 environmental covariates described above (P1, P2, S1, S2, soil texture, elevation, sand height, and land use type) as fixed effects. The model also incorporated random effects for spatial variation among the sampling plots. Additionally, we included the 7 species traits described in Table 1. To determine if a phylogenetic signal was present in our data, we integrated a phylogenetic tree created by transforming the taxonomy data in R version 4.4.2 using the 'phylo' feature of the 'ape' package (Paradis and Schliep, 2019). We fitted the two models using the R package 'Hmsc', employing the default prior distributions (Ovaskainen et al., 2017; Ovaskainen and Abrego, 2020). The posterior distribution was sampled using two Markov Chain Monte Carlo (MCMC) runs, each run for 600,000 iterations. The convergence of MCMC was evaluated using the potential scale reduction factors (PSRFs) (Gelman and Rubin, 1992). Additionally, we performed two-fold cross-validation on models thinned by a factor of 200. We used both coefficients Tjur's R2 and Area Under the Curve (AUC) as the indice of model performance. Tjur's R2 is asymptotically equivalent to the coefficient of determination (R2) and AUC summarizes model accuracy (Zhang et al., 2020a). The units of AUC and Tjur's R2 are different; a model that behaves as well as by chance will yield an AUC of 0.50 and a Tjur's R2 of 0.00, whereas a model that perfectly discriminates empty and occupied sampling units will have an AUC of 1.00 and a Tjur's R2 of 1.00 (Ovaskainen et al., 2017; Ovaskainen and Abrego, 2020).

3 Results

3.1 Model performance

The fitted model PA (which incorporates all the input data) demonstrated strong explanatory power (AUC=0.95 and Tjur's R2=0.51) and moderate predictive power (AUC=0.63 and Tjur's R2=0.16). Similarly, PA.Env (which excludes functional traits and phylogeny) exhibited good explanatory power (AUC=0.93 and Tjur's R2=0.30) but lower predictive power (AUC=0.59 and Tjur's R2=0.07). These findings suggested that PA outperforms PA.Env, indicating that incorporating functional traits and phylogeny into the model enhances its overall performance. Therefore, we further presented the results related to PA below.

3.2 Relative influence of each environmental filter using variance partitioning

Our results indicated that the two soil principal components of soil, S1 (salinity and electrical conductivity) and S2 (fertility and moisture), contributed the most to explaining the variance (28%). This was followed by the two precipitation principal components, P1 and P2 (22%), elevation (16%), sand height (11%), soil texture (10%), and land use type (7%). The community-level random effect accounted for 7% of the variance proportions (Fig. 2).
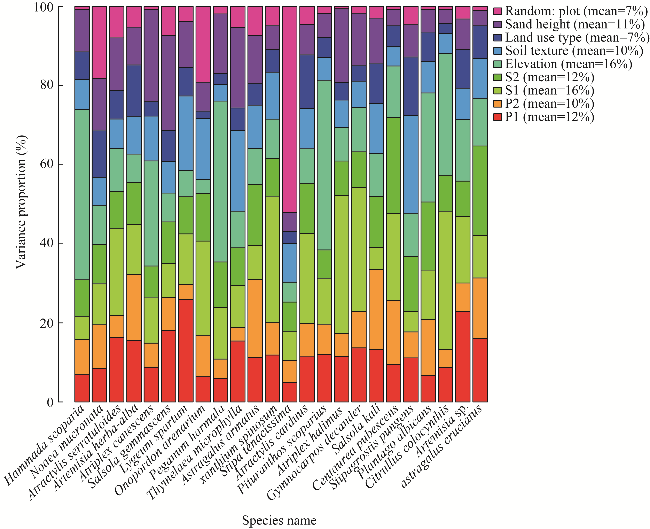
Fig. 2 Variance Partitioning. The values in the legend summarize the mean variance proportion of covariates over the species. Random: plot, random effect at the plot level; P1, precipitation principal component related to north-south humidity gradient; P2, precipitation principal component related to seasonal variability; S1, soil principal component reflecting the gradient of salinity and electrical conductivity; S2, soil principal component reflecting fertility and moisture.

3.3 Species responses to environmental filters

Regarding soil variables (Fig. 3), statistical support (with at least 75% posterior probability) indicated a positive response to S1 in 21% of species, specifically Atriplex halimus and Salsola kali, while 46% of species showed a negative response, including Atractylis serratuloides and Artemisia herba-alba. For S2, 29% of species demonstrated exclusively negative responses, such as Thymelaea microphylla. Similarly, soil texture significantly influenced species responses, with 21% of species responding positively to sandy texture, while 25% of species exhibited a negative response. In terms of sandy-loamy texture, 12% of species responded positively, whereas 8% of species, including Artemisia herba-alba, showed a negative response.
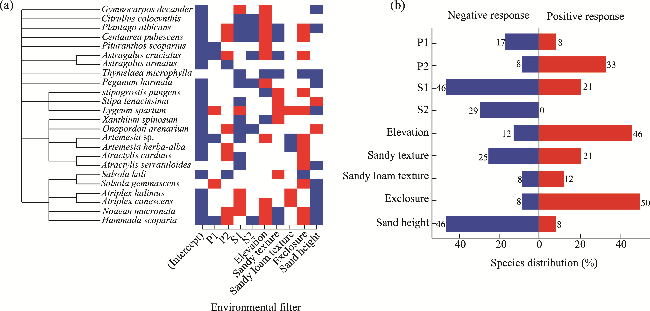
Fig. 3 Species responses to environmental filters. (a), directional trend; (b), response distribution for each environmental filter. The species are ordered according to their phylogeny as illustrated by the phylogenetic tree. The red color indicates a positive response of species with at least a 75% posterior probability, while the blue color indicates a negative response of species with at least a 75% posterior probability. A weak statistical relevance is shown by the white color.
Sand height negatively affected 45% of species (Peganum harmala, Thymelaea microphylla, Hammada scoparia, Atractylis carduus, Salsola gemmascens, and Atractylis serratuloides), with only 8% showing a positive response. Exclosure positively affected 50% of species (Peganum harmala, Atriplex halimus, Artemisia herba-alba, Atractylis carduus, and Atractylis serratuloides), while only 8% of species showed a negative response. For precipitation-related principal components, 33% of species (Noaea mucronata, Salsola kali, and Lygeum spartum) showed a positive response to P2, whereas 8% of species exhibited a negative response. In contrast, P1 excited positive responses in 8% of species and negative responses in 17% of species. Elevation positively affected 46% of species, while 12% of species had a negative response.

3.4 Responses of functional traits and phylogeny to environmental filters

Regarding phylogeny, we found a weak signal (ρ=0.19). This indicated that closely related species do not show similar patterns of responses to environmental factors (Fig. 4). Additionally, our analysis indicated that all functional traits respond differently to various explanatory variables (Fig. 5). For instance, seed mass increased with P1, S2, and soil texture (sandy and sandy loam). However, seed mass decreased with S1, P2, and exclosure. Additionally, leaf area responded positively to P1, sand height, and sandy texture but decreased with S1. Specific leaf area increased with P2 but decreased with factors such as S2, elevation, and sandy texture. Root length increased with S1 and both sandy and sandy loam textures decreased with exlosure and sand height. Finally, clonality decreased with increasing P1 and elevation, while it responded positively to S1, sandy texture, and exclosure. Perennial plants responded positively to P1 and elevation but negatively to salinity and sand height.
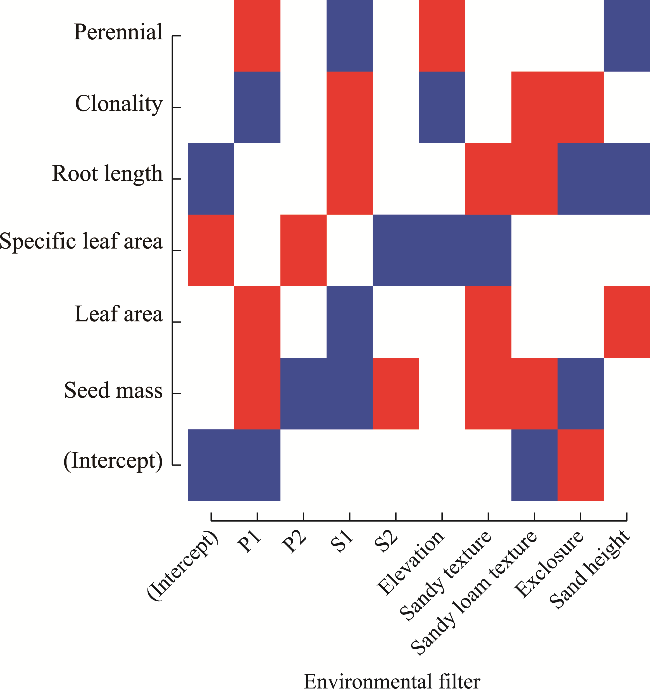
Fig. 4 Responses of functional traits to environmental filters. The intercept represents the expected value of the trait when the environmental variable equals zero. Although the value zero may not always be ecologically meaningful, the intercept is included in the regression model for mathematical completeness and accurate estimation of the relationship.
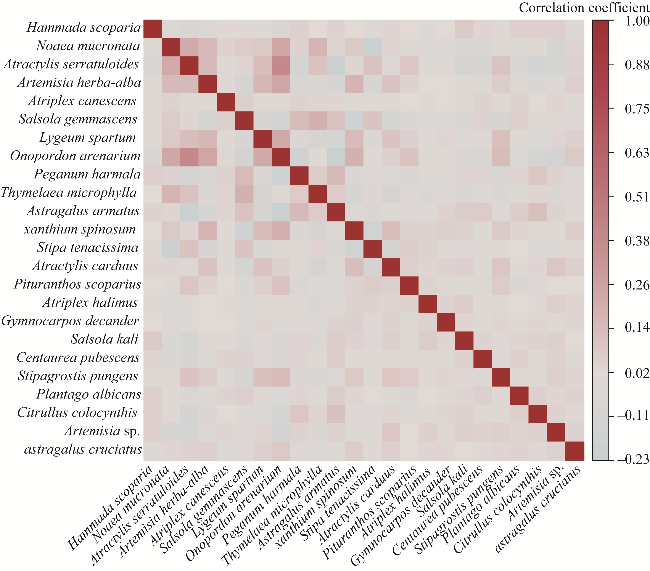
Fig. 5 Species-to-species association matrix highlighting the interspecific relationships

3.5 Effects of biotic filters based on species-to-species association matrix

The species-to-species association matrix provides insight into the interspecific relationships within the plant community by illustrating the strength and direction of pairwise correlations between species (Fig. 5). Most correlations were relatively weak or close to zero, with the mean correlation coefficient of 0.0026 and variance correlation coefficient of 0.0056, suggesting that strong interspecific interactions such as competition or facilitation are limited. However, some species pairs, such as Onopordon arenarium and Atractylis serratuloides, displayed moderate positive correlations, which could reflect coexistence through niche complementarity. In contrast, several species pairs, such as Atractylis serratuloides with Astragalus armatus and Noaea mucronata with Stipa tenacissima, exhibited moderate negative correlations, potentially indicating competition for resources.

4 Discussion

4.1 Drivers of community assembly in the El Bayadh steppe

In this study, our primary objective was to identify the ecological filters driving community assembly at the local scale in the El Bayadh steppe. Our results indicated that soil properties were the most influential factor, explaining 38% of the variance, followed by precipitation (22%), elevation (16%), sand height (11%), and land use type (7%). In contrast, species-to-species associations revealed that most species were not significantly associated with one another, suggesting that biotic filters—such as competition—played a minimal role in shaping species distribution in the El Bayadh steppe.
The dominance of soil properties as the primary drivers of species distribution in the El Bayadh steppe indicated that most species at the local scale are selected based on their ability to tolerate the region's edaphic constraints. These results align with those found by Yang et al. (2020), who reported that soil physical and chemical properties are the most important factors modulating plant diversity in arid and semi-arid ecosystems in China. In the El Bayadh steppe, as in most arid and semi-arid ecosystems, plants face multiple soil-related challenges, including high salinity, particularly in the northern part of the study area with low fertility, limited moisture, and sandy-limestone texture (Kargar-Chigani et al., 2017; Alliouche and Kouba, 2023). High salinity stresses plants by reducing water uptake and causing ion toxicity, which limits the number of species that can thrive in these areas (Koull and Chehma, 2016; Bidalia et al., 2019). This phenomenon is evident in the negative response of 45% of species to salinity observed in our study (Fig. 3a). However, some species, such as Atriplex halimus, exhibited a positive response to salinity, illustrating their adaptation to these harsh conditions. Additionally, the low soil fertility in the region presents another challenge, as only plants capable of efficiently acquiring and utilizing nutrients can survive and reproduce (Hag et al., 2021). Interestingly, 29% of species exhibited a negative response to fertility (Fig. 3a), which contrasts with our expectation of a positive response. This suggested that a moderate increase in fertility may serve as a stress factor. This phenomenon can be attributed to the fact that in areas with high salinity—corresponding to regions with greater nutrient content—the moderate increase in soil fertility fails to benefit plant establishment, as salinity remains the primary limiting factor. Additionally, the soil texture in El Bayadh region, like much of the soil in the Algeria steppes, is predominantly sandy and sandy limestone, which impacts water retention capacity and further restricts plant growth (Alliouche and Kouba, 2023). However, certain species, such as Lygeum spartum, responded positively to these soil textures (Fig. 3a). These results are consistent with previous studies in the El Bayadh steppe, which observed the replacement of dominant species like Stipa tenacissima by psammophilous species such as Lygeum spartum, Thymelaea microphylla, and Stipagrostis pungens (Slimani et al., 2010; Slimani and Aidoud, 2018).
Although soil properties were identified as the most important drivers, precipitation significantly influenced species distribution in the El Bayadh steppe (accounting for 28% of the variance explained). This finding is consistent with Slimani et al. (2010) and Slimani and Aidoud (2018), who demonstrated a significant correlation between temporal variations in species composition and long-term annual precipitation (during 1976-2016) in the El Bayadh steppe. Their work suggested that seasonal and spatial precipitation variability are critical drivers of species distribution in the El Bayadh steppe.
Furthermore, our results revealed that elevation and sand height were less influential, accounting for 16% and 11% of the variance in species distribution in the El Bayadh steppe, respectively. The limited impact of elevation can be attributed to the low topographical variability within the study area (Hamlat et al., 2024). Potential threshold effects can explain the weak influence of sand height. Specific threshold levels of sand height may be critical for influencing species distribution; if most measurements fall below this threshold, the overall impact of sand height may appear minimal (Bouallala et al., 2022, 2023). Future studies could concentrate on this aspect to enhance understanding of the impact of sand encroachment. In this study, 45% of species responded negatively to sand height, while only 12% of species responded positively. This indicated that sand encroachment presents a significant issue for the El Bayadh steppe, and conservation efforts should take this factor into account. These results align with those of Bouallala et al. (2023) that sand encroachment induced significant changes in plant community variables, including reductions in plant density, species rarity, species composition, morphological types, and adaptations to aridity.
The lack of significant correlation (negative or positive) among species (Fig. 5) suggested that competition (negative correlation among species) is not an important driver of community assembly in this environment. In areas under highly stressful conditions, like the El Bayadh steppe, environmental filtering tends to overshadow biotic interactions such as competition (Wang et al., 2021; Hu et al., 2022; Zhao et al., 2023; Tu et al., 2024). Additionally, land use type, recognized as an important driver of species distribution in the El Bayadh steppe, was found to have the weakest effect (7% of variance), indicating no significant difference between grazed and ungrazed areas in terms of species composition. These findings raise questions about the influence of exclosure on steppe rehabilitation. Exclosure involves removing the constraint of livestock to allow for the regeneration of plants (Wang et al., 2019). However, in this study, exclusion did not lead to a significant change in species composition, suggesting that the expected vegetation recovery may not have occurred. This implies that, beyond grazing exclusion, other ecological or environmental factors—such as improving soil quality or moisture availability—should be considered to achieve effective rehabilitation of Algerian steppe ecosystems.

4.2 Responses of functional traits and phylogeny to environmental filters

The phylogenetic signal was not strong (ρ=0.19), indicating that functional trait responses to environmental change differed among closely related species. This suggested that traits associated with specific ecological strategies, such as stress tolerance or ruderal characteristics, are not consistently shared among closely related species. Each species appears to evolve its traits in response to ecological pressures from environmental filters. These results align with those of Dong et al. (2019), who found a weak environmental effect on community phylogeny. This phenomenon occurs particularly when environmental change happens rapidly (Dong et al., 2019). From a conservation perspective, this suggests that predicting a species' trait response solely based on its phylogenetic relatedness may generate species occurrence patterns that do not reflect field reality, which can affect the effectiveness of established conservation strategies.
Our analysis also showed that all functional traits responded to multiple explanatory variables. Seed mass increased under favorable conditions, as shown by its positive relationship with precipitation and S2, and decreased in response to harsher environmental conditions such as S1 and P2 (Fig. 5). This aligns with the established relationship between seed size and stress (Hallett et al., 2011; Gao et al., 2023). In more stressful environments, plants tend to produce smaller seeds, likely due to the reduced availability of resources, which limits investment in each offspring. Conversely, in areas with higher water and nutrient availability, plants can invest in larger seeds, which provide greater energy reserves and enhance offspring survival, particularly in competitive environments (Qi et al., 2015). Furthermore, the increase in leaf traits, such as leaf area and specific leaf area with P1, is consistent with plant adaptation to water availability (De Micco and Aronne, 2012). Plants develop larger, thinner leaves in favorable conditions to optimize resource acquisition. Conversely, under stress, such as water scarcity, plants typically have smaller leaves to minimize water loss through transpiration (Iqbal et al., 2020; Marasco et al., 2022). This could explain the negative correlation between leaf traits and salinity, as saline environments often induce water stress (Koull and Chehma, 2016; Bidalia et al., 2019). However, the decrease in specific leaf area with soil fertility and elevation (Fig. 4) appears to contradict the ecological theory that plants should increase specific leaf area in response to greater resource availability (De Micco and Aronne, 2012). This could be explained by the possibility that plants in these environments may adopt a more conservative strategy. In this case, plants might limit resource loss to ensure long-term survival, even when water and nutrients are relatively abundant. This strategy may help plants maintain resilience in environments where conditions are prone to fluctuations or where the long-term stability of resources is uncertain (Fan et al., 2024). Further research should investigate this phenomenon in greater detail to enhance our understanding of plant adaptation strategies in the El Bayadh steppe and other semi-arid steppe ecosystems. The positive correlation of root length with S1 and sandy texture supports the expectation that plants with deeper or more extensive root systems thrive in areas with limited water availability (Iqbal et al., 2020). This adaptation helps them reach deeper water reserves. Additionally, the negative correlation between root length and exclosure may be attributed to increased water availability in exclosure areas, as livestock generally decrease water access through soil compaction (Abdalla et al., 2018). However, the negative correlation between root length and sand height raises important questions about how plants respond to sand encroachment. According to the literature, plants generally develop deeper root systems in stressful environments to improve water acquisition (Iqbal et al., 2020). Sand encroachment generally reduces the soil's water retention capacity, which should, in theory, prompt plants to deeper roots (Bouallala et al., 2023). These findings underscore the complexity of plant responses to sand encroachment, indicating that the relationship between sand and root systems may not be straightforward. Additionally, our results demonstrated a negative correlation between clonality and both precipitation and elevation. This observation aligns with plant strategy adaptation to harsh conditions, where clonality assists plants in coping with the challenges posed by arid environments (Zhang and Wu, 2014). By reproducing vegetatively through methods like rhizomes and stolons, clonal plants can effectively access localized resources and enhance their chances of survival (Liu et al., 2007). Additionally, this strategy allows for resilience, as clonal populations can recover from stressors such as drought, even if parts of the plant die (O'Brien et al., 2014). Finally, the positive response of perennial plants to P1 and elevation but the negative response to S1 and sand height are consistent with the general ecological understanding that perennials thrive in more stable environments with consistent water availability.

4.3 Models' performance

The findings of this study suggested that PA outperforms PA.Env, indicating that incorporating functional traits and phylogeny allows the model to better capture the underlying ecological processes shaping community assembly. This aligns with ecological literature emphasizing the importance of functional traits and phylogeny in species establishment and persistence within a community (Ovaskainen and Abrego, 2020; Keddy and Laughlin, 2021). However, we observed moderate predictive power for both models (PA and PA.Env), suggesting that while functional traits and phylogeny enhance our understanding of community structure, the current model may not fully capture additional factors influencing species distribution. These factors could include unmeasured environmental variables, species interactions, or stochastic events. Furthermore, the predictive power could potentially improve by increasing the sample size, which would provide more robust data for the model to detect finer-scale patterns (Crossa et al., 2022). Future research should explore the identification and integration of these additional variables to strengthen the model's predictive power and more effectively inform conservation strategies in the El Bayadh steppe.

5 Conclusions

This study aimed to identify the ecological filters influencing community assembly in the El Bayadh steppe. The use of HMSC as an integrated approach was proved to be a powerful tool for assessing how ecological filters shape community assembly, providing valuable insights into species-environment relationships and trait-based responses. Our findings revealed that soil properties and precipitation were the primary drivers of species distribution, while sand height and elevation exerted a moderate influence. In contrast, competition and exclosure played only minor roles. Species responses to environmental variables varied: sand height and P2 had predominantly negative effects, whereas exclosure and elevation demonstrated positive influences. Our results also indicated that trait clustering was driven more by ecological filtering than by evolutionary selection. Additionally, the dynamics of plants functional traits in the El Bayadh steppe reflected a balance between resource acquisition and resource conservation. However, the weak influence of exclosure raises questions about the effectiveness of natural plant regeneration in this region. Furthermore, the model's limited predictive power suggested that future research should incorporate additional variables and a larger sample size to enhance species distribution modeling in the El Bayadh steppe. From a conservation perspective, our findings highlighted the need to integrate soil properties and precipitation variability into management and restoration strategies. Finally, sand encroachment should be recognized as a major ecological threat, requiring targeted interventions to mitigate its impact on plant communities and ensure the long-term stability of the El Bayadh steppe ecosystem.

Conflict of interest

The authors declare that they have no known competing financial interests or personal relationships that could have appeared to influence the work reported in this paper.

Acknowledgements

This study was supported by the Foundation of the University of Quebec in Abitibi-Témiscamingue (FUQAT). We would also like to thank the Quebec Research Fund (FRQ) (2021-SE7-282961). We gratefully acknowledge their financial contribution. We also sincerely thank the reviewers and editors for their valuable suggestions.

Author contributions

Conceptualization: Patrick-Nino OLOUMANE, Carlo PRÉVIL, Wael El ZEREY; Methodology: Patrick-Nino OLOUMANE; Formal analysis and investigation: Patrick-Nino OLOUMANE, Asma El ZEREY-BELASKRI; Writing - original draft preparation: Patrick-Nino OLOUMANE; Writing - review and editing: Patrick-Nino OLOUMANE; Funding acquisition: Carlo PRÉVIL, Wael El ZEREY; Resources: Carlo PRÉVIL, Wael El ZEREY, Asma El ZEREY-BELASKRI; Supervision: Carlo PRÉVIL, Wael El ZEREY, Asma El ZEREY-BELASKRI. All authors approved the manuscript.
[1]
Abatzoglou J T, Dobrowski S Z, Parks S A, et al. 2018. TerraClimate, a high-resolution global dataset of monthly climate and climatic water balance from 1959-2015. Scientific Data, 5: 170191, 10.1038/sdata.2017.191.

[2]
Abdalla M, Hastings A, Chadwick D R, et al. 2018. Critical review of the impacts of grazing intensity on soil organic carbon storage and other soil quality indicators in extensively managed grasslands. Agriculture, Ecosystems & Environment, 253: 62-81.

[3]
Abdelghani Z, Fateh M, Benkherif M, et al. 2016. Diversity and plant distribution according to the topographical factors in Djebel Messaad forest (M'Sila - Algeria). Advances in Environmental Biology, 10: 27-38.

[4]
Adjabi A, Sidi H, Bounar R, et al. 2019. Floristic distribution according to the edaphic parameters of a steppe zone, case of study: The Nature Reserve "el-Mergueb" M'sila, Algeria. Ekologia Bratislava, 38(4): 336-352.

[5]
Alliouche A, Kouba Y. 2023. Modelling the spatiotemporal dynamics of land susceptibility to desertification in Algeria. CATENA, 23: 107437, doi: 10.1016/j.catena.2023.107437.

[6]
Amghar F, Forey E, Margerie P, et al. 2012. Grazing exclosure and plantation: a synchronic study of two restoration techniques improving plant community and soil properties in arid degraded steppes (Algeria). Ecology Review, 67(3): 257-269. (in French)

[7]
Attaoui W, Benaradj A, Bourahla L. 2024. Floristic characterization of grassy steppe groups in Naama Region (Algeria). Annals of "Valahia" University of Târgovişte. Agriculture, 16: 13-18.

[8]
Barbagelata P A. 2006. Evaluation of potassium soil tests and methods for mapping soil fertility properties in lowa corn and soybean fields. PhD Dissertation. Ames: lowa State University.

[9]
Bekai F, Kadik L, Nedjimi B. 2019. Effects of deferring grazing on the floristic diversity of Stipa tenacissima Loefl. ex L. rangelands in central Algerian steppe. African Journal of Ecology, 57(3): 363-370.

[10]
Belala F, Hirche A, Muller S D, et al. 2018. Rainfall patterns of Algerian steppes and the impacts on natural vegetation in the 20th century. Journal of Arid Land, 10(4): 561-573.

[11]
Belaroui K, Djediai H, Megdad H. 2014. The influence of soil, hydrology, vegetation and climate on desertification in El-Bayadh region (Algeria). Desalination and Water Treatment, 52(10-12): 2144-2150.

[12]
Bidalia A, Vikram K, Yamal G, et al. 2019. Effect of salinity on soil nutrients and plant health. In: Akhtar M S. Salt Stress, Microbes, and Plant Interactions: Causes and Solution (Volume 1). Singapore: Springer, 273-297.

[13]
Bonham C D. 1989. Measurements for Terrestrial Vegetation. New York: Wiley, 75-97.

[14]
Bouallala M, Bradai L, Chenchouni H. 2022. Effects of sand encroachment on vegetation diversity in the Sahara Desert. In: Chenchouni H, Chaminé H I, Khan M F, et al. New Prospects in Environmental Geosciences and Hydrogeosciences. CAJG 2019. Advances in Science, Technology & Innovation. Cham: Springer, 133-138.

[15]
Bouallala M, Neffar S, Bradai L, et al. 2023. Do aeolian deposits and sand encroachment intensity shape patterns of vegetation diversity and plant functional traits in desert pavements? Journal of Arid Land, 15(6): 667-694.

[16]
Braun J, Lortie C J. 2024. Environmental filtering mediates desert ant community assembly at two spatial scales. Oecologia, 205: 231-244.

[17]
Crossa J, Montesinos-López O A, Pérez-Rodríguez P, et al. 2022. Genome and environment-based prediction models and methods of complex traits incorporating genotype×environment interaction. Methods in Molecular Biology, 2467: 245-283.

[18]
De Micco V, Aronne G. 2012. Morpho-anatomical traits for plant adaptation to drought. In: ArocaR. Berlin, Plant Responses to Drought Stress:From Morphological to Molecular Features. Heidelberg: Springer, 37-61.

[19]
Dong L, Liang C Z, Li F Y, et al. 2019. Community phylogenetic structure of grasslands and its relationship with environmental factors on the Mongolian Plateau. Journal of Arid Land, 11(4): 595-607.

[20]
El Zerey W, Bachir B S, Benslimane M, et al. 2009. The desertification of the steppe ecosystem: the case of the El Bayadh region, Algeria. VertigO - The Electronic Journal in Environmental Sciences, 9(2), doi: 10.4000/vertigo.8821. (in French)

[21]
Elton C S. 1927. Animal Ecology. New York: Macmillan Company.

[22]
Emerson B C, Gillespie R G. 2008. Phylogenetic analysis of community assembly and structure over space and time. Trends in Ecology & Evolution, 23(11): 619-630.

[23]
Erdős L, Ho K V, Bede-Fazekas Á, et al. 2024. Environmental filtering is the primary driver of community assembly in forest-grassland mosaics: A case study based on CSR strategies. Journal of Vegetation Science, 35(1): e13228, doi: 10.1111/jvs.13228.

[24]
Fan B L, Westerband A C, Wright I J, et al. 2024. Shifts in plant resource use strategies across climate and soil gradients in dryland steppe communities. Plant and Soil, 497: 277-296.

[25]
Frenette D C. 2013. Community assembly in arid environments:a functional approach. PhD Dissertation. Sherbrooke: University of Sherbrooke. (in French)

[26]
Frih B, Oulmi A, Guendouz A. 2021. Study of the drought tolerance of some durum wheat (Triticum durum Desf.) genotypes growing under semi-arid conditions in Algeria. International Journal of Bio-resource and Stress Management, 12(2): 137-141.

[27]
Gao C J, Liu F Y, Miao Y C, et al. 2023. Variation in seed number/mass trade-off for Pinus yunnanensis along a natural climate gradient in the mountains of Southwest China. Plant Ecology, 224: 203-219.

[28]
Garnier E, Shipley B, Roumet C, et al. 2001. A standardized protocol for the determination of specific leaf area and leaf dry matter content. Functional Ecology, 15(5): 688-695.

[29]
Garnier E, Navas M L. 2012. A trait-based approach to comparative functional plant ecology: concepts, methods and applications for agroecology. A review. Agronomy for Sustainable Development, 32: 365-399.

[30]
Gelman A, Rubin D B. 1992. Inference from iterative simulation using multiple sequences. Statistical Science, 7(4): 457-472.

[31]
Ghezlaoui B D, Benabadji N, Benabadji N. 2013. Phytoecological and phytoedaphological characterization of steppe plant communities in the south of Tlemcen (western Algeria). Open Journal of Ecology, 3(8): 495-504.

[32]
Ghiloufi W, Quéro-Pérez J L, García-Gómez M, et al. 2015. Assessment of species diversity and state of Stipa tenacissima steppes. Turkish Journal of Botany, 39(2): 227-237.

[33]
González A, Mederbal K, Josa R, et al. 2009. Steppe ecosystems (case of Brezina-El Bayadh). International Seminar: Preservation and Enhancement of the Steppe Ecosystem. M'Sila: Department of Agronomy, University of M'Sila. (in French)

[34]
Grinnell J. 1917. The Niche-Relationships of the California Thrasher. The Auk, 34(4): 427-433.

[35]
Habib B, Gros R, Okkacha H. 2014. Impact of over-grazing on vegetation and physico-chemical characters of soil steppiques in western Algerian. International Journal of Basic and Applied Sciences, 3(3): 328-334.

[36]
Hag H H, Lucke B, Bäumler R, et al. 2021. A contribution to soil fertility assessment for arid and semi-arid lands. Soil Systems, 5(3): 42, doi: 10.3390/soilsystems5030042.

[37]
Hallett L M, Standish R J, Hobbs R J. 2011. Seed mass and summer drought survival in a Mediterranean-climate ecosystem. Plant Ecology, 212: 1479-1489.

[38]
Hamlat A, Habibi B, Guidoum A, et al. 2024. Water supply and demand balancing and forecasting in a semi-arid region of Algeria using the WEAP model: a case study of El Bayadh province. Sustainable Water Resources Management, 10: 34, doi: 10.1007/s40899-023-01006-x.

[39]
Hu D, Jiang L M, Hou Z F, et al. 2022. Environmental filtration and dispersal limitation explain different aspects of beta diversity in desert plant communities. Global Ecology and Conservation, 33: e01956, doi: 10.1016/j.gecco.2021.e01956.

[40]
Hubbell S P. 2001. The Unified Neutral Theory of Biodiversity and Biogeography. Princeton: Princeton University Press, 14-375.

[41]
Iqbal A, Fahad S, Iqbal M, et al. 2020. Special Adaptive Features of Plant Species in Response to Drought. Cham: Springer, 77-118.

[42]
Kargar-Chigani H, Javadi S A, Zahedi-Amiri G, et al. 2017. Vegetation composition differentiation and species-environment relationships in the northern part of Isfahan Province, Iran. Journal of Arid Land, 9(2): 161-175.

[43]
Keddy P A, Laughlin D C. 2021. A Framework for Community Ecology:Species Pools, Filters and Traits (1st ed.). Cambridge: Cambridge University Press.

[44]
Kouba Y, Merdas S, Mostephaoui T, et al. 2021. Plant community composition and structure under short-term grazing exclusion in steppic arid rangelands. Ecological Indicators, 120: 106910, doi: 10.1016/j.ecolind.2020.106910.

[45]
Kouider B, Maifi H. 2018. Contribution to the collection and conservation of plant seeds in the central steppe regions (Djelfa et Msila). MSc Thesis. Djelfa: University of Djelfa. (in French)

[46]
Koull N, Chehma A. 2016. Soil characteristics and plant distribution in saline wetlands of Oued Righ, northeastern Algeria. Journal of Arid Land, 8(6): 948-959.

[47]
Kraft N J B, Ackerly D D. 2010. Functional trait and phylogenetic tests of community assembly across spatial scales in an Amazonian forest. Ecological Monographs, 80(3): 401-422.

[48]
Kumar G, Kurothe R S, Viswakarma A K, et al. 2023. Assessment of soil vulnerability to erosion in different land surface configurations and management practices under semi-arid monsoon climate. Soil and Tillage Research, 230: 105698, doi: 10.1016/j.still.2023.105698.

[49]
Laughlin D C, Joshi C, van B P M, et al. 2012. A predictive model of community assembly that incorporates intraspecific trait variation. Ecology Letters, 15(11): 1291-1299.

[50]
Laughlin D C, Laughlin D E. 2013. Advances in modeling trait-based plant community assembly. Trends in Plant Science, 18(10): 584-593.

[51]
Laughlin D C, Joshi C, Richardson S J, et al. 2015. Quantifying multimodal trait distributions improves trait-based predictions of species abundances and functional diversity. Journal of Vegetation Science, 26(1): 46-57.

[52]
Lavorel S, Karl G, Lamarque P, et al. 2011. Using plant functional traits to understand the landscape distribution of multiple ecosystem services. Journal of Ecology, 99(1): 135-147.

[53]
Li Y Z, Shipley B, Price J N, et al. 2018. Habitat filtering determines the functional niche occupancy of plant communities worldwide. Journal of Ecology, 106(3): 1001-1009.

[54]
Liu H D, Yu F H, He W M, et al. 2007. Are clonal plants more tolerant to grazing than co-occurring non-clonal plants in inland dunes? Ecology Research, 22: 502-506.

[55]
Lortie C J, Brooker R W, Choler P, et al. 2004. Rethinking plant community theory. Oikos, 107(2): 433-438.

[56]
Lv T, Ding H, Wang N J, et al. 2024. The roles of environmental filtering and competitive exclusion in the plant community assembly at Mt. Huangshan are forest-type-dependent. Global Ecology and Conservation, 51: e02906, doi: 10.1016/j.gecco.2024.e02906.

[57]
Marasco R, Mosqueira M J, Cherif A, et al. 2022. Diversity and plant growth-promoting properties of microbiomes associated with plants in desert soils. In: RamondJ B, CowanD A. Microbiologyof Hot Deserts. Cham: Springer, 205-233.

[58]
Mcgill B, Enquist B, Weiher E, et al. 2006. Rebuilding community ecology from functional traits. Trends in Ecology & Evolution, 21(4): 178-185.

[59]
Naouel M, Sirine N. 2020. The influence of environmental factors on the distribution and composition of plant species in Oued Charef dam, northeast of Algeria. Biodiversitas Journal of Biological Diversity, 22(1): 346-353.

[60]
Nasrallah Y, Aouadj S A, Khatir H. 2020. Impact of the exploitation of medicinal plants on biodiversity conservation in Saida and El Bayadh regions, Algeria. Biodiversity Research and Conservation, 60(1): 11-22.

[61]
Nedjraoui D, Hirche A, Boughani A, et al. 2016. Long-term monitoring of steppe ecosystems and desertification assessment: Case of the South-West Oranese steppe (Algeria). Biocenoses, 7: 5-21. (in French)

[62]
Negadi M, Hassani A, Farid B, et al. 2014. Study of floristic diversity in the El Bayadh region (Algeria): Rare and threatened flora. Review of Ecology and Environnement, 10: 50-55. (in French)

[63]
O'Brien E K, Denham A J, Ayre D J. 2014. Patterns of genotypic diversity suggest a long history of clonality and population isolation in the Australian arid zone shrub Acacia carneorum. Plant Ecology, 215: 55-71.

[64]
Okkacha H, Hassiba M, Habib B, et al. 2014. Evaluation of Characteristics Floristico-Edaphic of the Steppes at Alfa (Stipa tenacissima L.) in the Saida Region (western Algeria). Open Journal of Ecology, 4(14): 883-891.

[65]
Ovaskainen O, Tikhonov G, Norberg A, et al. 2017. How to make more out of community data? A conceptual framework and its implementation as models and software. Ecology Letters, 20(5): 561-576.

[66]
Ovaskainen O, Abrego N. 2020. Joint Species Distribution Modelling. Cambridge: Cambridge University Press.

[67]
Pakeman R J, Quested H M. 2007. Sampling plant functional traits: What proportion of the species need to be measured? Applied Vegetation Science, 10(1): 91-96.

[68]
Paltseva A. 2024. How can carbonate content be estimated? In: PaltsevaA. The Urban Soil Guide:A Field and Lab Manual. Cham: Springer, 83-86.

[69]
Paradis E, Schliep K. 2019. ape 5.0: an environment for modern phylogenetics and evolutionary analyses in R. Bioinformatics, 35(3): 526-528.

[70]
Peterson K, Ruffley M, Parent C. 2021. Phylogenetic diversity and community assembly in a naturally fragmented system. Ecology and Evolution, 1(24): 18066-18080.

[71]
Pratt C J, Denley D, Metaxas A. 2022. Selection of predictor variables for species distribution models: a case study with an invasive marine bryozoan. Oecologia, 198(2): 319-336.

[72]
Qi W, Bu H Y, Cornelissen J H C, et al. 2015. Untangling interacting mechanisms of seed mass variation with elevation: insights from the comparison of inter-specific and intra-specific studies on eastern Tibetan angiosperm species. Plant Ecology, 216: 283-292.

[73]
Sahnouni R, Abdesselam S. 2023. Arid rangeland degradation and its driving forces in Southern Hodna, Algeria. Journal of Landscape Ecology, 16(2): 114-128.

[74]
Schamp B S, Gridzak R, Greco D A, et al. 2022. Examining the relative influence of dispersal and competition on co-occurrence and functional trait patterns in response to disturbance. PLoS ONE, 17(10): e0275443, doi: 10.1371/journal.pone.0275443.

[75]
Seoane J, Estrada A, Jones M M, et al. 2023. A case study on joint species distribution modelling with bird atlas data: Revealing limits to species' niches. Ecological Informatics, 77: 102202, doi: 10.1016/j.ecoinf.2023.102202.

[76]
Shipley B, Laughlin D C, Sonnier G, et al. 2011. A strong test of a maximum entropy model of trait-based community assembly. Ecology, 92(2): 507-517.

[77]
Slimani H, Aidoud A, Rozé F. 2010. 30 Years of protection and monitoring of a steppic rangeland undergoing desertification. Journal of Arid Environments, 74(6): 685-691.

[78]
Slimani H, Aidoud A. 2018. Forty years of monitoring in the South Oranese steppe (Algeria): changes in floristic diversity and composition. Review of Ecology, 73(3): 293-308.

[79]
Stubbs W J, Bastow W J. 2004. Evidence for limiting similarity in a sand dune community. Journal of Ecology, 92(4): 557-567.

[80]
Telek G, Marshall N. 1974. Using a CHN analyzer to reduce carbonate interference in particulate organic carbon analyses. Marine Biology, 24: 219-221.

[81]
Tikhonov G, Opedal Ø H, Abrego N, et al. 2020. Joint species distribution modelling with the r-package Hmsc. Methods in Ecology and Evolution, 11(3): 442-447.

[82]
Tu W Q, Lu W X, Gu J Q, et al. 2024. The species diversity and phylogenetic structure patterns of desert plant communities in the Turpan-Hami region, Xinjiang. Global Ecology and Conservation, 55: e03239, doi: 10.1016/j.gecco.2024.e03239.

[83]
Violle C, Navas M L, Vile D, et al. 2007. Let the concept of trait be functional! Oikos, 116(5): 882-892.

[84]
Wang J M, Li M X, Xu L, et al. 2022. Divergent abiotic stressors drive grassland community assembly of Tibet and Mongolia Plateau. Functional Plant Ecology, 12: 715730, doi: 10.3389/fpls.2021.715730.

[85]
Wang S Z, Fan J W, Li Y Z, et al. 2019. Effects of grazing exclusion on biomass growth and species diversity among various grassland types of the Tibetan Plateau. Sustainability, 11(6): 1705, doi: 10.3390/su11061705.

[86]
Wang X, Song N P, Yang X G, et al. 2021. Inferring community assembly mechanisms from functional and phylogenetic diversity: The relative contribution of environmental filtering decreases along a sand desertification gradient in a desert steppe community. Land Degradation & Development, 32(7): 2360-2370.

[87]
Weiher E, Keddy P A. 1995. Assembly rules, null models, and trait dispersion: New questions from old patterns. Oikos, 74(1): 159-164.

[88]
Weiher E, Werf A V, Thompson K, et al. 1999. Challenging Theophrastus: A common core list of plant traits for functional ecology. Journal of Vegetation Science, 10(5): 609-620.

[89]
Weiher E, Keddy P A. 2001. Ecological Assembly Rules:Perspectives, Advances, Retreats. Cambridge: Cambridge University Press.

[90]
Weiher E, Freund D, Bunton T, et al. 2011. Advances, challenges and a developing synthesis of ecological community assembly theory. Philosophical Transactions of the Royal Society B: Biological Sciences, 366(1576): 2403-2413.

[91]
Xu J S, Chen Y, Zhang L X, et al. 2017. Using phylogeny and functional traits for assessing community assembly along environmental gradients: A deterministic process driven by elevation. Ecology and Evolution, 7(14): 5056-5069.

[92]
Yang J, El-Kassaby Y A, Guan W B. 2020. The effect of slope aspect on vegetation attributes in a mountainous dry valley, Southwest China. Scientific Report, 10: 16465, doi: 10.1038/s41598-020-73496-0.

[93]
Yu Z W, Wang M L, Sun Z Y, et al. 2023. Changes in the leaf functional traits of mangrove plant assemblages along an intertidal gradient in typical mangrove wetlands in Hainan, China. Global Ecology and Conservation, 48: e02749, doi: 10.1016/j.gecco.2023.e02749.

[94]
Yudina A V, Fomin D S, Valdes-Korovkin I A, et al. 2020. The ways to develop soil textural classification for laser diffraction method. Eurasian Soil Science, 53(11): 1579-1595.

[95]
Zhang C L, Chen Y, Xu B D, et al. 2020a. Temporal transferability of marine distribution models in a multispecies context. Ecological Indicators, 117: 106649, doi: 10.1016/j.ecolind.2020.106649.

[96]
Zhang C L, Chen Y, Xu B D, et al. 2020b. Evaluating the influence of spatially varying catchability on multispecies distribution modelling. ICES Journal of Marine Science, 77(5): 1841-1853.

[97]
Zhang J Y, Wu Y X. 2014. Changes in diversity and importance of clonal plants during sand dune succession in northeastern China. Ecological Research, 29(3): 393-399.

[98]
Zhao K F, Zeng Y, Wang Y H, et al. 2023. Mechanisms for the construction of plant communities in the Gurbantunggut Desert, China. Ecological Indicators, 154: 110615, doi: 10.1016/j.ecolind.2023.110615.

[99]
Zouidi M, Hachem K, Terras I, et al. 2023. Effect of salinity and drought on the germination of Lygeum spartum L. in the region of Saïda (western Algerian steppe). Ekologia (Bratislava), 42(2): 159-164.

Outlines

/