Research article

Spatiotemporal dynamic and drivers of ecological environmental quality on the Chinese Loess Plateau: Insights from kRSEI model and climate-human interaction analysis

  • XI Ruiyun 1 ,
  • PEI Tingting 1 ,
  • CHEN Ying , 1, * ,
  • XIE Baopeng 1 ,
  • HOU Li 1 ,
  • WANG Wen 2, 3
Expand
  • 1College of Management, Gansu Agricultural University, Lanzhou 730070, China
  • 2Gansu Natural Resources Planning and Research Institute, Lanzhou 730070, China
  • 3Gansu Branch of the Key Laboratory of Land Use, Ministry of Natural Resources of the People's Republic of China, Lanzhou 730070, China
*CHEN Ying (E-mail: )

Received date: 2025-02-23

  Revised date: 2025-06-08

  Accepted date: 2025-06-20

  Online published: 2025-08-12

Abstract

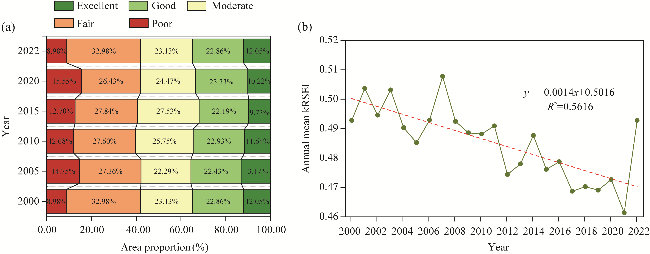
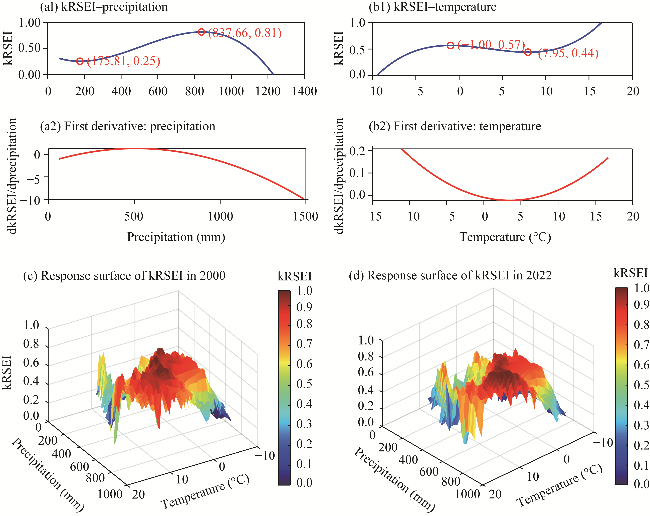
The Loess Plateau (LP), one of the most ecologically fragile regions in China, is affected by severe soil erosion and environmental degradation. Despite large-scale ecological restoration efforts made by Chinese government in recent years, the region continues to face significant ecological challenges due to the combined impact of climate change and human activities. In this context, we developed a kernal Remote Sensing Ecological Index (kRSEI) using Moderate Resolution Imaging Spectroradiometer (MODIS) products on the Google Earth Engine (GEE) platform to analyze the spatiotemporal patterns and trends in ecological environmental quality (EEQ) across the LP from 2000 to 2022 and project future trajectories. Then, we applied partial correlation analysis and multivariate regression residual analysis to further quantify the relative contributions of climate change and human activities to EEQ. During the study period, the kRSEI values exhibited significant spatial heterogeneity, with a stepwise degradation pattern in the southeast to northwest across the LP. The maximum (0.51) and minimum (0.46) values of the kRSEI were observed in 2007 and 2021, respectively. Trend analyses revealed a decline in EEQ across the LP. Hurst exponent analysis predicted a trend of weak anti-persistent development in most of the plateau areas in the future. A positive correlation was identified between kRSEI and precipitation, particularly in the central and western regions; although, improvements were limited by a precipitation threshold of 837.66 mm/a. A moderate increase in temperature was shown to potentially benefit the ecological environment within a certain range; however, temperature of -1.00°C-7.95°C often had a negative impact on the ecosystem. Climate change and human activities jointly influenced 65.78% of LP area on EEQ, primarily having a negative impact. In terms of contribution, human activities played a dominant role in driving changes in EEQ across the plateau. These findings provide crucial insights for accurately assessing the ecological state of the LP and suggest the design of future restoration strategies.

Cite this article

XI Ruiyun , PEI Tingting , CHEN Ying , XIE Baopeng , HOU Li , WANG Wen . Spatiotemporal dynamic and drivers of ecological environmental quality on the Chinese Loess Plateau: Insights from kRSEI model and climate-human interaction analysis[J]. Journal of Arid Land, 2025 , 17(7) : 958 -978 . DOI: 10.1007/s40333-025-0104-9

1 Introduction

The concept of ecological environmental quality (EEQ) refers to the status and accessibility of elements critical for societal development in a given environment, such as water, soil, biodiversity, and climatic conditions (Yao et al., 2021; Strassburg et al., 2022). This concept reflects the dynamic equilibrium between anthropogenic systems and natural ecosystems (Bai et al., 2023a; Yuan et al., 2024). As documented by the Intergovernmental Panel on Climate Change (IPCC, 2023), anthropogenic climate warming has accelerated in recent decades, causing more frequent and intense extreme weather events. Such environmental transformations threaten arid areas particularly, globally recognized as ecologically vulnerable areas (Zhang et al., 2022a), where amplified hydrological cycles under warming conditions increase climate sensitivity (Wang et al., 2022a). Chinese Loess Plateau (LP), which possesses the world's largest loess deposits, is faced with distinctive environmental challenges, including soil erosion and ecosystem fragility. The government has implemented large-scale projects such as the Grain-for-Green program (implemented since 1999) and the Three-North Shelterbelt project in the region to address these issues (Du et al., 2016; Yu et al., 2021). Here, systematic evaluation of EEQ enabled evidence-based policy making for ecological restoration, which is a priority given the increasing pressure due to climate change and human-induced environmental stresses.
Evaluating EEQ is a complex and challenging task, and numerous mathematical models and methods have been recently developed for this purpose (Hamel et al., 2017). For example, EEQ is frequently assessed at the county, provincial, and eco-regional levels using Ecological Index (EI). However, the application of EI is constrained by its reliance on costly ground monitoring data and significant human intervention, and its inability to provide visualization, which makes it challenging to achieve high-precision, real-time, and rapid large-scale ecological monitoring and assessment (Zhu et al., 2021). Remote sensing technology enables ecological evaluations across large areas, long time series, and different spatial scales (Kamran and Yamamoto, 2023). Various remote sensing-based ecological indices have been developed to assist in quantifying and mapping ecosystem functions and characteristics (Xu et al., 2018). For instance, Normalized Difference Vegetation Index (NDVI) is used to characterize vegetated areas (Li et al., 2021), Permanent Vegetation Fraction (PVF) serves as an indicator of vegetation coverage (Naseri and Mostafazadeh, 2023), and Land Surface Temperature (LST) describes variations in surface temperature (Alexander, 2020). However, relying solely on a single index is insufficient for comprehensively assessing complex ecosystems (Zheng et al., 2022). The Remote Sensing Ecological Index (RSEI) enables the integration of different ecosystem components into a composite indicator to assess ecological conditions (Xu, 2013a). By applying principal component analysis (PCA) to generate load values, this method objectively determines the weight of each component, thereby eliminating subjective human influence. This approach not only simplifies the evaluation process but also enhances the efficiency of ecological assessments (Yang et al., 2024). The RSEI has been widely applied to EEQ studies at different scales, including in urban areas (Zhang et al., 2022a; Gan et al., 2024), river basins (Xiong et al., 2021; Yuan et al., 2021), mining areas (Yang et al., 2023), and ecological conservation areas (Peng et al., 2023; Wen et al., 2025), demonstrating strong practical utility.
Currently, methods such as geographical detectors (An et al., 2022), multiple linear regression (Zhang et al., 2022b), and correlation analysis (Boori et al., 2021) are commonly employed to assess the impacts of climate change and human activities on EEQ (Cao et al., 2022; Bai et al., 2023a). Among the influencing factors, temperature variations directly affect vegetation growth (Qin et al., 2024), whereas extreme precipitation events may trigger natural disasters such as debris flows, floods, and landslides (Luo et al., 2024). At the same time, rapid urban expansion disrupts soil and topographical structures, indirectly exerting a negative impact on the spatial distribution of RSEI (Zhang et al., 2022c). Research has indicated that, due to the combined effect of global climate change and human activities, the trends in EEQ are more complex. However, most studies on EEQ primarily focus on the assessment of regional conditions and analysis of single factors. Only a few have investigated the combined effects of environmental alterations and anthropogenic factors on EEQ. To avoid the saturation problem when calculating RSEI, Feng et al. (2023) replaced the traditional NDVI with the kernel NDVI (kNDVI), revealing a greater stability and robustness of this modified index in describing various environments, such as dense forests, grasslands, and mixed woodlands, compared with both NDVI and the near-infrared reflectance of vegetation (NIRV) index. Compared with NDVI, kNDVI captures more accurately vegetation growth dynamics and addresses more effectively limitations related to atmospheric noise, soil background interference, and saturation errors (Camps-Valls et al., 2021; Wang et al., 2023).
In this study, we analyzed Moderate Resolution Imaging Spectroradiometer (MODIS) images of the LP from 2000 to 2022 deriving from the Google Earth Engine (GEE) platform, introducing kNDVI instead of the traditional NDVI as a greenness indicator to develop an adjusted ecological index for EEQ assessment, referred to as kernel Remote Sensing Ecological Index (kRSEI). The aims are to: (1) quantify EEQ on the LP from 2000 to 2022 and analyze its spatiotemporal evolution; (2) investigate the trends in EEQ during the 23-a period and forecasting future scenarios; (3) evaluate the respective impacts of climate change and human activities on EEQ on the LP; and (4) propose restoration strategies for various ecological areas within the plateau.

2 Materials and methods

2.1 Study area

The LP is one of the most densely populated areas in China, where the conflict between population growth and the preservation of natural resources (namely environmental health) is particularly pronounced (Chen et al., 2023). Located in north-central China, the plateau spans from approximately 33°43′ to 41°16′N and from 100°54′ to 114°33′E, covering an area of about 6.40×10⁵ km2. It extends westward to the Qilian Mountains, eastward to the Taihang Mountains, southward to the Qinling Mountains, and reaches the Great Wall in the north. The LP is characterized by highly undulating terrain (with elevation ranging from 83 to 5022 m) and the predominance of loess hills, tablelands, and gully landscapes (Fig. 1). The area experiences a warm temperate continental monsoon climate, with an annual mean temperature of 4.00°C-14.00°C, and annual precipitation ranging from 200.00 to 800.00 mm, increasing from the northwest to the southeast. The strong seasonality and spatial variability of precipitation make the regional ecosystem highly sensitive to climate change, as fluctuations in humidity and temperature directly impact vegetation growth and ecosystem stability. The main land cover types are grasslands, forests, and farmlands, which make the plateau a key dryland agricultural zone in China. Administratively, the LP spans several provinces, including Henan Province, Shanxi Province, Shaanxi Province, Gansu Province, Qinghai Province, Inner Mongolia Autonomous Region, and Ningxia Hui Autonomous Region, and has a total population of approximately 1.08×10⁸. Over time, intensive human activities have exacerbated the fragility of the ecosystem, and the region's environmental quality is increasingly shaped by the combined effects of human activities and climate change, which pose significant challenges for sustainable development.
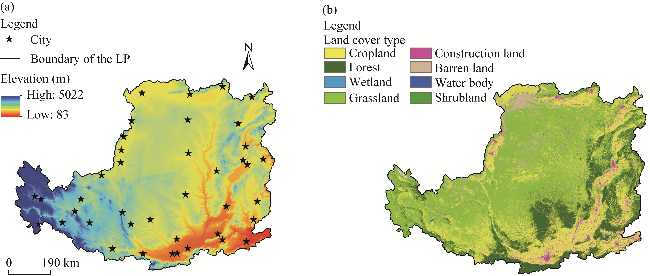
Fig. 1 Elevation (a) and land cover of the Loess Plateau (LP). Note that the figures of the LP region were sourced from the Global Change Research Data Publishing & Repository (https://www.geodoi.ac.cn/WebCn/doi.aspx?Id=199), and the boundary has not been modified.

2.2 Data sources and processing

The GEE remote sensing platform offers a robust solution for the analysis and visualization of geospatial data, enabling the processing of large-scale remote sensing data over extended temporal and spatial ranges without the need for preliminary steps such as atmospheric and radiometric corrections (Yuan et al., 2021). In this study, the GEE platform was leveraged to extract annual MOD13A1 NDVI, MOD11A2 LST, and MOD09A1 surface reflectance data for the LP during the vegetation growing season (April-October) spanning from 2000 to 2022. Data preprocessing involved removing cloud contamination and masking water bodies using the Cloud and Cloud Shadow Mask (CFMASK) algorithm and Modified Normalized Difference Water Index (MNDWI), respectively (Xu, 2005). These processed datasets were then employed for the calculation of kRSEI and subsequent analysis.
The source of precipitation data from 2000 to 2022 was the European Centre for Medium-Range Weather Forecasts (ECMWF) Reanalysis v5 (ERA5)-Land dataset; the annual temperature records for the same timeframe were retrieved from the National Xizang Plateau Data Center; and the land cover dataset for China (at a resolution of 30 m) was obtained from the Earth System Science Data released in 2021.

2.3 Research methods

2.3.1 Construction and improvement of kRSEI model

Functioning as an integrated geospatial indicator, RSEI enables the systematic quantification of ecological conditions by synthesizing surface parameters critical for EEQ assessment, i.e., greenness, wetness, dryness, and heat, via PCA (Xu, 2013a). The equations describing the four parameters (greenness, wetness, dryness, and heat) critical for EEQ assessment are reported below (Xu et al., 2019; Qin et al., 2024). In this study, kNDVI was adopted as the greenness metric instead of the conventional NDVI to develop kRSEI. This modification was intended to provide a more accurate representation of EEQ on the LP. The formulas are as follows (Camps-Valls et al., 2021):
$\mathrm{NDVI}=\frac{\rho_{\mathrm{nir}}-\rho_{\mathrm{red}}}{\rho_{\mathrm{nir}}+\rho_{\mathrm{red}}}$,
$\mathrm{kNDVI}=\tanh \left(\mathrm{NDVI}^{2}\right),$
where ρnir and ρred are the reflectance of the near-infrared and red bands, respectively; NDVI is the Normalized Difference Vegetation Index; and kNDVI is the kernel Normalized Difference Vegetation Index, which represents greenness.
Using a hat transformation on the MOD09A1 dataset, the humidity component closely associated with vegetation and soil moisture was extracted. The formula for calculating Wetness Index (WI) is as follows (Yuan et al., 2021):
$\mathrm{WI}=0.2408 \rho_{\text {blue }}+0.3132 \rho_{\text {green }}+0.1147 \rho_{\text {red }}+0.2489 \rho_{\text {nir1 }}-0.3122 \rho_{\text {nir2 }}-0.6416 \rho_{\text {mir1 }}-0.5087 \rho_{\text {mir2 }},$
where ρblue, ρgreen, ρnir1, ρnir2, ρmir1, and ρmir2 are the surface reflectance of the blue, green, near-infrared infrared 1 (841-876 nm), near-infrared 2 (1230-1250 nm), mid-infrared 1 (1628-1652 nm), and mid-infrared 2 (2105-2155 nm) bands, respectively.
The Normalized Difference Built-up Soil Index (NDBSI) was used to represent surface dryness, which includes built-up and bare soil two dry components. The formulas are as follows (Sun et al., 2022):
$\mathrm{SI}=\frac{\left(\rho_{\min }+\rho_{\mathrm{red}}\right)-\left(\rho_{\mathrm{nir} 1}+\rho_{\text {blue }}\right)}{\left(\rho_{\mathrm{min}}+\rho_{\mathrm{red}}\right)+\left(\rho_{\mathrm{nir} 1}+\rho_{\text {blue }}\right)},$
$\mathrm{IBI}=\frac{\frac{2 \rho_{\mathrm{mir} 1}}{\rho_{\mathrm{mir} 1}+\rho_{\mathrm{nir} 1}}-\left[\frac{\rho_{\mathrm{nir} 1}}{\rho_{\mathrm{nir} 1}+\rho_{\mathrm{red}}}+\frac{\rho_{\mathrm{green}}}{\rho_{\mathrm{green}}+\rho_{\mathrm{mir} 1}}\right]}{\frac{2 \rho_{\mathrm{mir} 1}}{\rho_{\mathrm{mir} 1}+\rho_{\mathrm{nir} 1}}+\left[\frac{\rho_{\mathrm{nir} 1}}{\rho_{\mathrm{nir} 1}+\rho_{\mathrm{red}}}+\frac{\rho_{\mathrm{green}}}{\rho_{\mathrm{green}}+\rho_{\mathrm{mir} 1}}\right]},$
$\mathrm{NDBSI}=\frac{(\mathrm{SI}+\mathrm{IBI})}{2},$
where SI and IBI are the soil index and soil brightness index, respectively.
In this study, the MOD11A2 LST product served as an indicator for heat parameter (Gong et al., 2023):
$\mathrm{LST}=0.02 \mathrm{DN}-273.1,$
where DN is the digital number for the MOD11A2 image.
After the calculation of the four indices, the kRSEI was determined by PCA (Gou and Zhao, 2020).
$\mathrm{kRSEI}_{0}=\mathrm{PCl}[f(\mathrm{kNDVI}, \mathrm{WI}, \mathrm{NDBSI}, \mathrm{LST})],$
$\mathrm{kRSEI}=1-\mathrm{kRSEI}_{0},$
where kRSEI is the kernal Remote Sensing Ecological Index; and kRSEI0 is the initial value of kRSEI.
The kRSEI was further normalized between 0.00 and 1.00. Based on Boori et al. (2021) and Cheng et al. (2023), this study classified kRSEI values into five distinct categories representative of EEQ: poor (0.00-0.20), fair (0.20-0.40), moderate (0.40-0.60), good (0.60-0.80), and excellent (0.80-1.00).

2.3.2 Sen's slope analysis and Mann-Kendall (MK) test

Sen's slope is a nonparametric technique employed to determine linear trends in time series data. Here, it was applied to assess variations in kRSEI on the LP from 2000 to 2022. The following equation was used for calculations:
$\text { slope }=\text { median }\left(\frac{x_{j}-x_{i}}{j-i}\right)$
where slope is the key indicator used to quantify the changes in kRSEI; and xi and xj are the kRSEI values at time points i and j, respectively. The median function allows precise calculation of the slope, whose value directly indicates the dynamic change in kRSEI over time. Specifically, a positive slope value indicates an upward trend, suggesting a gradual improvement in EEQ; a slope value equal to zero signifies stability over time, with no change in EEQ; and a negative slope value points to a downward trend, reflecting a deterioration in EEQ.
The MK test was employed to assess the significance of the observed variation in kRSEI over time. The Z value, a standardized test statistic in the MK test, quantifies the statistical significance of a time series trend. For a given significance level α, if the test statistic was less than or equal to $|Z| \leq Z_{1-\alpha / 2}$, the variation was not significant at that level. Conversely, if it exceeded$|Z| \leq Z_{1-\alpha / 2}$, the variation was significant. We identified statistically significant trends based on Z value exceeding the following critical thresholds: 1.65 (90.00% confidence), 1.96 (95.00% confidence), and 2.58 (99.00% confidence). The intervals for kRSEI variation are summarized in Table 1.
Table 1 Change category of ecological environmental quality (EEQ) variation based on Sen's slope analysis and Mann-Kendall (MK) test
Slope value Z value Change category Trend characteristic
Slope>0.0000 2.58<Z 4 Extremely significant increase
1.96<Z≤2.58 3 Significant increase
1.65<Z≤1.96 2 Slight increase
Z1.65 1 No significant increase
Slope=0.0000 - 0 No change
Slope<0.0000 Z≤1.65 -1 No significant decrease
1.65<Z≤1.96 -2 Slight decrease
1.96<Z≤2.58 -3 Significant decrease
2.58<Z -4 Extremely significant decrease

Note:The Z value is a standardized test statistic in the MK test, which is used to determine the statistical significance of a time series trend. "-", no value.

2.3.3 Hurst exponent analysis

The Hurst exponent analysis was used to quantitatively characterize the persistence of trends in EEQ on the LP. This index, which is derived from rescaled range analysis (Xu, 2013b), generally ranges between 0.00 and 1.00. A Hurst index (H) value close to 0.50 signifies little correlation between past and future trends in EEQ. At H values between 0.00 and 0.50, the time series demonstrates anti-persistence, meaning future trends are likely to be opposite to those observed in the past, whereas values between 0.50 and 1.00 indicate persistence, suggesting that future trends will maintain the same direction as the past ones (Bai et al., 2023a). The projected trends in kRSEI based on the results of Sen's slope analysis are summarized in Table 2.
Table 2 Classification of future trends in EEQ based on Hurst exponent analysis
Slope value Hurst index (H) Future trend category Trend characteristic
Slope< -0.0005 0.65<H<1.00 1 Strong sustained degradation
Slope< -0.0005 0.50<H<0.65 2 Weak sustained degradation
Slope≥0.0005 0.00<H<0.35 3 Reversed strong sustained improvement
Slope≥0.0005 0.35<H<0.50 4 Reversed weak sustained improvement
Slope< -0.0005 0.35<H<0.50 5 Reversed weak sustained degradation
Slope< -0.0005 0.00<H<0.35 6 Reversed strong sustained degradation
Slope≥0.0005 0.50<H<0.65 7 Weak sustained improvement
Slope≥0.0005 0.65<H<1.00 8 Strong sustained improvement
-0.0005Slope<0.0005 - 9 No change

Note: When -0.0005Slope<0.0005, the trend of the time series is statistically insignificant (approaching a stationary state). Under this condition, the long-term memory (sustained or reversed weak sustained) analyzed by the Hurst exponent may lose statistical significance due to noise dominance, and thus no H value is assigned. "-", no value.

2.3.4 Partial correlation analysis

Partial correlation analysis was used to examine the relationship between climate variables and kRSEI variation. The following equation was used for calculation (Shao et al., 2024):
$r_{x y, z}=\frac{r_{x y}-r_{x z} r_{y z}}{\sqrt{\left(1-r_{x z}^{2}\right)\left(1-r_{y z}^{2}\right)}},$
where rxy,z is the partial correlation coefficient between x and y, controlling for z; and rxy, rxz, and ryz are the simple correlation coefficients between x and y, x and z, and y and z, respectively. A t-test was conducted for statistical analysis at the pixel level, with significance set at 0.05. Based on the results, the following five levels of partial correlation were identified: significant positive correlation (rxy,z>0; P<0.05), significant negative correlation (rxy,z<0; P<0.05), non-significant positive correlation (rxy,z>0; P≥0.05), non-significant negative correlation (rxy,z<0; P≥0.05), and no linear correlation (rxy,z=0).

2.3.5 Multivariate regression residual analysis

Multivariate regression residual analysis was employed to assess the impacts and relative contributions of human activities and climate change to kRSEI variation. The following two equations were used for calculations (Qi et al., 2024):
$\operatorname{kRSEI}_{\mathrm{CC}}=a \times T+b \times P+c,$
$\mathrm{kRSEI}_{\mathrm{HA}}=\mathrm{kRSEI}_{\mathrm{obs}}-\mathrm{kRSEI}_{\mathrm{cc}},$
where kRSEICC and kRSEIobs are the predicted kRSEI value based on the regression model, reflecting the influence of climate change on kRSEI and the observed kRSEI value derived from remote sensing images, respectively; a, b, and c are model parameters; T and P are average temperature (°C) and cumulative precipitation (mm), respectively; and kRSEIHA is the residual of kRSEI representing the influence of human activities.

2.3.6 Determination of the drivers of kRSEI variation

The linear trends observed for kRSEICC and kRSEIHA from 2000 to 2022 revealed the distinct impacts of environmental factors and human activities on kRSEI variation over time across the LP. Specifically, positive trends suggest a stimulating effect, while negative ones reflect a restraining influence on kRSEI. The analysis of these linear trends in kRSEIobs, allowed the identification of the main contributors to kRSEI variation and quantification of their relative contributions (Table 3).
Table 3 Assessment criteria for identifying the drivers of kernel Remote Sensing Ecological Index (kRSEI) variation and calculation of contribution rate
Slope(kRSEIobs) Driver Criteria for determining driver Contribution rate
Slope(kRSEICC) Slope(kRSEIHA) Climate change Human activities
>0.0000 Climate change and human activities >0.0000 >0.0000 $\frac{\text { Slpoe }\left(\mathrm{kRSEI}_{\mathrm{CC}}\right)}{\text { Slpoe }\left(\mathrm{kRSEI}_{\text {obs }}\right)} \times 100 \%$ $\frac{\text { Slpoe }\left(\text { kRSEI }_{\text {HA }}\right)}{\text { Slpoe }\left(\text { kRSEI }_{\text {obs }}\right)} \times 100 \%$
Climate change >0.0000 <0.0000 100% 0%
Human activities <0.0000 >0.0000 0% 100%
<0.0000 Climate change and human activities <0.0000 <0.0000 $\frac{\text { Slpoe }\left(\mathrm{kRSEI}_{\mathrm{CC}}\right)}{\text { Slpoe }\left(\mathrm{kRSEI}_{\text {obs }}\right)} \times 100 \%$ $\frac{\text { Slpoe }\left(\mathrm{kRSEI}_{\mathrm{HA}}\right)}{\text { Slpoe }\left(\mathrm{kRSEI}_{\text {obs }}\right)} \times 100 \%$
Climate change <0.0000 >0.0000 100% 0%
Human activities >0.0000 <0.0000 0% 100%

Note: Slope(kRSEIobs) is the changing trend of the observed kRSEI values; Slope(kRSEICC) is the changing trend of the predicted kRSEI values, denoting the trends in kRSEI resulting from climate change; and Slope(kRSEIHA) is the changing trend of the residual kRSEI values, reflecting the trends in kRSEI resulting from human activities.

3 Results

3.1 Spatiotemporal variation of EEQ on the LP

The PCA of the four combined indices (kNDVI, WI, LST, and NDBSI) revealed that the contribution of the first principal component (PC1) to the overall variance in kRSEI consistently exceeded 80.00% from 2000 to 2022. Specifically, the contribution rates were 88.69% in 2000, 90.14% in 2005, 88.78% in 2010, 91.05% in 2015, 87.55% in 2020, and 89.08% in 2022, which suggested that PC1 accounted for most of the variance among the four indices. This finding demonstrated the validity of using PC1 to construct the kRSEI for evaluating EEQ on the LP. In PC1, kNDVI and WI showed positive values, while NDBSI and LST had negative values (Fig. 2).
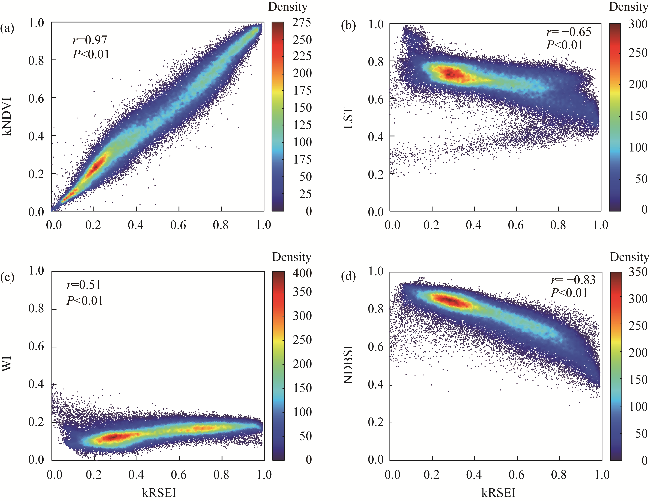
Fig. 2 Scatterplot of kernal Remote Sensing Ecological Index (kRSEI) with Normalized Difference Vegetation Index (NDVI; a), Land Surface Temperature (LST; b), Wetness Index (WI; c), and Normalized Difference Built-up Soil Index (NDBSI; d)
The average kRSEI values for the LP from 2000 to 2022 were calculated. As shown in Figure 3, higher values for this index, which indicate an improved EEQ, were distributed in the southeast, whereas lower values were detected in the northwest, forming a spatial gradient of decline in the southeast to the northwest. Areas with good or excellent EEQ were mainly concentrated in southern Shanxi Province, southern Yan'an City in Shaanxi Province, Pingliang and Tianshui cities in Gansu Province, and Xining City in Qinghai Province. Additionally, EEQ in the Hetao Plain region was relatively high, reflecting the prevalence of developed river systems in this area. In contrast, areas with poor or fair EEQ were primarily located in central Inner Mongolia Autonomous Region, northern Yan'an and Yulin cities in Shaanxi Province, Ningxia Hui Autonomous Region, and parts of Gansu Province, including Dingxi, Lanzhou, Baiyin, and Wuwei cities. This spatial distribution of EEQ was attributed to the inland location of the LP, where only the southeastern areas benefit from favorable temperature and humidity conditions determined by the summer monsoon, whereas the central and northwestern regions experience limited precipitation and are characterized by sandy soils and challenging conditions for vegetation growth. Starting from the year 2000, areas with moderate EEQ or higher gradually expanded, and the boundaries shifted northwestward. However, after 2015, this trend reversed, with the boundary contracting and moving back southeastward.
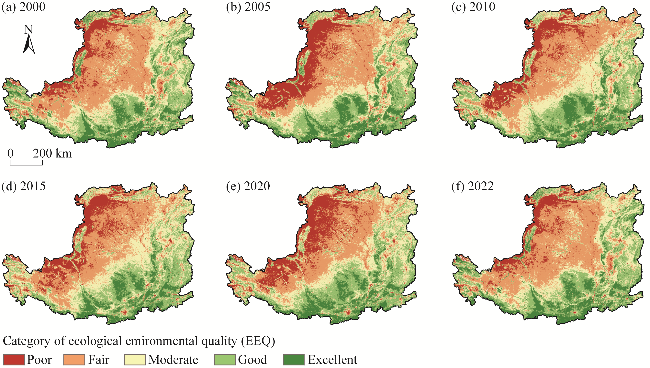
Fig. 3 Spatial distribution of ecological environmental quality (EEQ) levels on the LP from 2000 to 2022. (a), 2000; (b), 2005; (c), 2010; (d), 2015; (e), 2020; (f), 2022.
The trends in EEQ on the LP from 2000 to 2022 were further analyzed by visualizing the proportions of areas with different EEQ levels (Fig. 4a). Overall, fair level accounted for the largest area, covering 29.20% of the plateau on average, followed by moderate level (24.39%) and then by good (22.76%), poor (12.17%), and excellent (11.45%) levels. These proportions exhibited minimal variation from 2000 to 2022, with lower-than-moderate levels consistently occupying a larger area than higher-than-moderate levels. By calculating the annual mean kRSEI values for the study area and fitting a linear regression trend, it was possible to describe the regional trends in EEQ (Fig. 4b). During the study period, the overall EEQ on the LP showed a general declining trend at a rate of 0.0014/a from 2000 to 2022. The highest (0.51) and lowest (0.46) kRSEI values were recorded in 2007 and 2021, respectively. Notable low inflection points were observed in 2005 and 2012, followed by brief periods of rapid but temporary increases. These low values were likely associated with extreme climate events that occurred in parts of the LP during those years. The calculation of the interannual variation in EEQ based on the mean kRSEI values of all pixels across the entire region indicated that localized degradation due to such extreme events may have had a significant impact on the overall EEQ, even if the disturbances were spatially limited. The overall EEQ on the LP was consistently moderate throughout the study period.
Fig. 4 Proportion of area with different EEQ levels on the LP (a) and linear fit of the annual mean kRSEI values from 2000 to 2022 (b)

3.2 Trends in EEQ on the LP

3.2.1 Sen's slope analysis and MK test

The variation in EEQ on the LP from 2000 to 2022 was further investigated by employing Sen's slope estimation and MK test to analyze the trends in kRSEI at the pixel level. The results are presented in Figure 5.
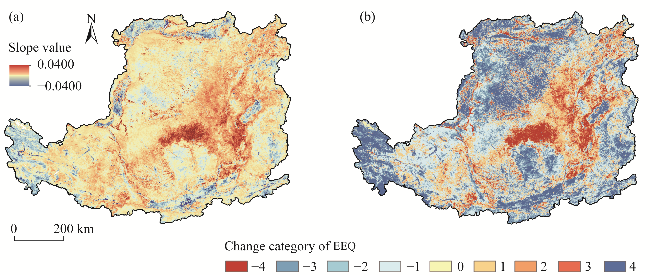
Fig. 5 Spatial distribution of slope values (a) and EEQ change categories (b) on the LP from 2000 to 2022
From 2000 to 2022, EEQ on the LP exhibited an overall declining trend. Areas with improved EEQ accounted for 32.73% of the total area and were concentrated in northern Yan'an City and central Yulin City in Shaanxi Province as well as in Linfen and Lüliang cities in Shanxi Province. These are key regions included in the Grain-for-Green program, and the significant improvements observed highlight the effectiveness of this initiative. Conversely, the areas with declining EEQ made up 67.27% of the total area, dominating the overall trend. This decline was most prominent in Xi'an, Weinan, and Xianyang cities in Shaanxi Province; Jincheng, and Changzhi cities in Shanxi Province; Yinchuan City in Ningxia Hui Autonomous Region; Baotou and Bayannur cities in Inner Mongolia Autonomous Region; Wuwei City in Gansu Province; and Qinghai Province. These areas are typically characterized by high population density, intense urbanization, industrial development, and long-term agricultural exploitation. The pressures resulting from these factors, such as rapid land-use change, over-extraction of groundwater, and soil salinization, have led to significant ecological stress. In addition, increasing climate variability and the occurrence of extreme weather events have further exacerbated the ecological degradation in these regions. The MK test was employed to assess more accurately the increases or decreases in EEQ on the LP at various levels of significance, allowing for trend classification and statistical analysis of area proportions. As shown in Table 4, the area showing no significant decrease in EEQ was the largest (30.28%), followed by that showing no significant increase in EEQ (19.54%). The remaining trends, i.e., extremely significant decrease, significant decrease, slight decrease, extremely significant increase, significant increase, and slight increase, were observed in areas covering 17.46%, 12.03%, 6.46%, 5.62%, 4.70%, and 2.87% of the LP, respectively. Over the 23 a, 1.04% of the area showed no change in EEQ, with no specific concentration.
Table 4 Results of MK test showing the trends in EEQ on the LP from 2000 to 2022 and corresponding areas
Change category Trend characteristic Area proportion (%)
4 Extremely significant increase 5.62
3 Significant increase 4.70
2 Slight increase 2.87
1 No significant increase 19.54
0 No change 1.04
-1 No significant decrease 30.28
-2 Slight decrease 6.46
-3 Significant decrease 12.03
-4 Extremely significant decrease 17.46

3.2.2 H

The H was calculated for the kRSEI values for each pixel. This index, along with Sen's slope analysis at the 95.00% confidence level, allowed the determination of both future and past trends in EEQ on the LP (Fig. 6). The average H value was 0.43, with 34.40% and 65.60% of the area showing H>0.50 and <0.50, respectively. When H approached 0.50, the correlation between historical and subsequent variations progressively decreased. Based on the H values, we identified four distinct persistence patterns in terms of strength and direction strong reverse sustainability (0.00<H<0.35), weak reverse sustainability (0.35<H<0.50), weak same-direction sustainability (0.50<H<0.65), and strong same-direction sustainability (0.65<H<1.00). Therefore, the above findings implied that most regions of the LP will experience a relatively weak reverse sustainability trend in EEQ in the future. By integrating Hurst exponent analysis with kRSEI trends, it was possible to effectively predict the evolutionary trajectory and magnitude of kRSEI fluctuations (Table 5).
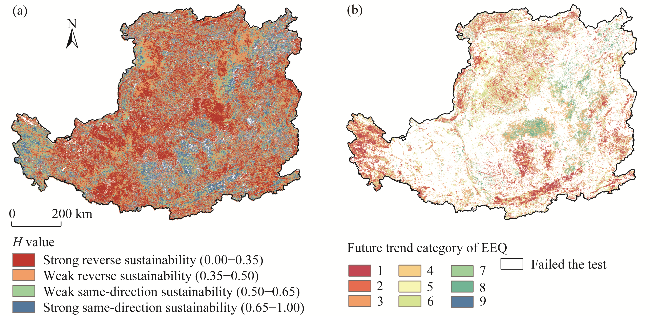
Fig. 6 Spatial distribution of Hurst index (H) values (a) and future trends in EEQ (b) on the LP
Table 5 Future trends in EEQ and corresponding areas on the LP
Future trend category Trend characteristic Area proportion (%)
1 Strong sustained degradation 5.63
2 Weak sustained degradation 6.39
3 Reversed strong sustained improvement 1.95
4 Reversed weak sustained improvement 1.99
5 Reversed weak sustained degradation 6.90
6 Reversed strong sustained degradation 5.32
7 Weak sustained improvement 1.95
8 Strong sustained improvement 2.12
9 No change 0.01
As shown in Figure 6 and Table 5, the LP regions where EEQ may decline in the future make up 15.96% of the total area. More specifically, 12.02% and 3.94% will experience sustainable degradation (both strong and weak) and counter-sustainable improvement (both strong and weak), respectively. Conversely, 16.29% of the LP may improve in EEQ in the future, with 4.07% and 12.22% experiencing sustainable improvement (both strong and weak) and counter-sustainable degradation (both strong and weak), respectively. The areas exhibiting sustainable degradation on the LP are concentrated in the southern Xi'an, and Xianyang, Weinan cities, and southern Yan'an City in Shaanxi Province as well as in Qinghai Province, the Hetao Plain (subjected to agricultural irrigation), and eastern Shanxi Province. The distribution is uneven, with a higher concentration in densely populated urban areas and water systems, reflecting the significant negative effects of human activities on EEQ in these regions. The areas showing sustainable improvement are primarily located in the northern Yan'an City in Shaanxi Province and Lüliang City in Shanxi Province as well as in a few other isolated locations. In these regions, where the main land cover types are forests and grasslands, the Grain-for-Green program has led to substantial recovery and protection of the vegetation cover, with promising future prospects. Areas that showed improvement in EEQ in the past but may decline in the future are predominantly located in the proximity of zones subjected to continuous degradation. Conversely, areas that degraded in the past but may show improvement going forward are mainly situated in the northern Ordos City, which is characterized by barren land with sandy soils and presents challenging natural conditions that hinder vegetation growth. However, owing to recent initiatives, such as the Three-North Shelterbelt project, EEQ has gradually improved in this region, and promisingly positive trends have been predicted.

3.3 Factors affecting EEQ on the LP

3.3.1 Relationship between kRSEI and environmental parameters

The correlation coefficients describing the relationship between kRSEI and precipitation on the LP ranged from -0.75 to 0.84, with a mean value of 0.13 (Fig. 7). This correlation was significant for only 8.23% of the LP area. Spatially, 73.56% and 26.44% of the pixels showed a positive and negative correlation, respectively, indicating that in most of the LP, kRSEI and precipitation were positively correlated. This positive correlation suggested that increased precipitation contributed to enhancing EEQ, especially in the central and western LP, which are characterized by grasslands, croplands, and barren lands and where precipitation is low (Fig. 8). Higher precipitation improves soil moisture and water availability, fostering vegetation growth and restoration, which in turn improves EEQ. The correlation coefficients describing the relationship between kRSEI and temperature ranged from -0.83 to 0.82, with an average value of -0.01, and the correlation was significant for 4.55% of the LP area. Positive and negative correlations were observed for 49.28% and 50.72% of the pixels, respectively, indicating a more complex relationship between temperature and EEQ. A moderate rise in temperature may benefit the ecological environment, but an excessive increase typically leads to negative effects, such as higher soil moisture evaporation and inhibited vegetation growth.
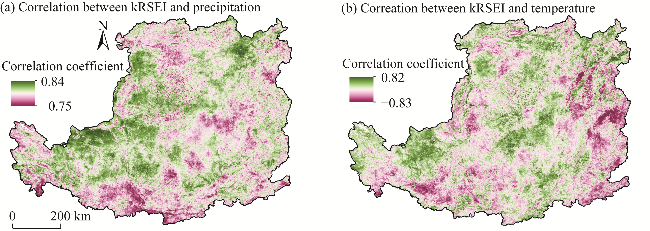
Fig. 7 Correlation of kRSEI with precipitation (a) and temperature (b)
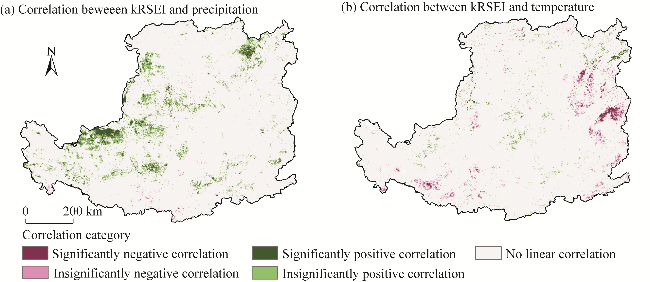
Fig. 8 Spatial distribution of significant correlation of kRSEI with precipitation (a) and temperature (b)
Most areas of the LP are characterized by arid and semi-arid climate, making EEQ particularly sensitive to changes in precipitation. Adequate precipitation provides the necessary conditions for vegetation growth, thereby enhancing regional EEQ. However, in areas with sparse vegetation or where precipitation is already sufficient, an increase in precipitation may lead to soil erosion and landslides, negatively impacting EEQ. As shown in Figure 9a, kRSEI exhibited a "rise-fall" trend with increasing precipitation, with an optimal precipitation threshold detected at 837.66 mm/a. Furthermore, the rate of kRSEI variation gradually decreased as precipitation increased. With regard to the more complex relationship between temperature variation and EEQ, in regions with abundant precipitation, moderate warming promotes vegetation growth, thereby improving EEQ, but at the same time higher temperatures accelerate plant transpiration and soil moisture evaporation, reducing surface moisture and negatively affecting EEQ. As shown in Figure 9b, kRSEI exhibited a nonlinear "rise-fall-rise" pattern with temperature changes, indicating a complex response that requires further investigation. The rate of kRSEI variation decreased initially and then increased with rising temperatures. Moreover, overall, precipitation exerted a more pronounced positive effect on EEQ compared with temperature.
Fig. 9 Threshold effect of precipitation (a) and temperature (b) on kRSEI on the LP from 2000 to 2022, and three-dimensional response surface of kRSEI to temperature and precipitation on the LP in 2000 (c) and 2022 (d). The blue curve in Figure 9a1 and b1 represents the fitted response. Figure 9a2 and b2 shows the marginal effect of precipitation and temperature on kRSEI, respectively. The dkRSEI/dprecipitation and dkRSEI/dtemperature are first derivatives, reflecting the rate of variation.

3.3.2 Relative contribution of climate change and human activities to variations in kRSEI

Collectively, climate change and human activities were shown to affect 65.78% of the LP area, with 48.86% accounting for areas where both have a negative effect (Fig. 10a). These areas were scattered throughout the region, without showing a clear distribution pattern. In contrast, the areas where both climate change and human activities had a positive effect, accounted for 16.92% of the LP and were mainly located in the central (northern Yulin and Yan'an cities in Shaanxi Province and Lüliang City in Shanxi Province) and northeastern (Datong and Shuozhou cities in Shanxi Province) regions. The areas affected by climate change alone accounted for 5.78% of the LP, with 1.31% and 3.37% experiencing positive and negative effects, respectively. These areas were mainly located in southeastern Yulin City, Shaanxi Province and more sporadically in Qingyang and Baiyin cities, Gansu Province. The areas affected only by human activities accounted for 28.43% of the LP, with 14.61% showing a promoting effect in the central and southern regions and 13.82% being negatively impacted in the southern and northern regions. In particular, the northern and central-western regions of the LP were significantly positively affected by the combined effects of climate change and human activities. Here, moderate temperature increased due to climate change combined with initiatives such as the Grain-for-Green program have contributed to improving EEQ. Conversely, in the eastern and southern regions both climate change and human activities exerted marked negative effects, exacerbating ecological degradation.
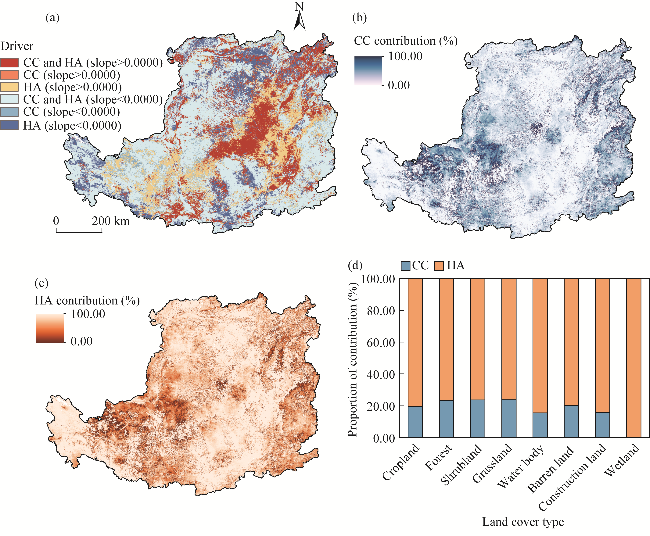
Fig. 10 Impact of climate change (CC) and human activities (HA) on kRSEI variation across the LP from 2000 to 2022. (a), spatial distribution of the co-contribution of CC and HA to kRSEI variation; (b and c), spatial distribution of the contributions of CC and HA to kRSEI variation, respectively; (d), proportional contributions of CC and HA to kRSEI variation across different land use types. Slope>0.0000 represents positive effect on kRSEI, and slope<0.0000 represents negative effect on kRSEI.
The contributions of climate change and human activities to kRSEI variation from 2000 to 2022 differed for each grid cell (Fig. 10b and c). The average contribution of climate change was 22.15%, while that of human activities was 77.85%, suggesting that the latter factor was the primary driver of changes in EEQ on the LP. In specific areas, such as the central LP (Yulin City in Shaanxi Province), Wuzhong City in Ningxia Hui Autonomous Region, Wuwei and Dingxi cities in Gansu Province, and the junction of Shanxi and Shaanxi provinces, the influence of human activities was less pronounced, and climate change was the main factor affecting EEQ. Human activities were identified as the main contributor to kRSEI variation across different land cover types on the LP, consistently and strongly affecting EEQ (Fig. 10d).

3.4 Targeted ecological restoration strategies for the LP

In this study, multivariate residual regression analysis was used to evaluate the contributions of various factors to kRSEI variation on the LP. Our approach provided insights into the magnitude of the effects on EEQ and its future trends at the raster scale. Based on this, this study identified the following six types of ecological zones: synergistic improvement zone, climate-advantage zone, human-driven zone, comprehensive degradation zone, climate-sensitive zone, and human disturbance zone (Fig. 11). Spatial aggregation was applied to enhance connectivity within each type. The synergistic improvement zone, mainly located in the central LP (a key area for the Grain-for-Green program), is positively affected by both climate change and human activities. In the future, continued focus on ecological protection and restoration, improved compensation mechanisms, and the promotion of synergy between ecological restoration and economic development through agro-ecological compensation policies are essential. The climate-advantage zone, sparsely distributed in the central and northern LP, benefit from climate change. In these areas, the protection of existing ecological resources, optimization of land use, and prevention of overdevelopment and ecological damage should be prioritized. Human-driven zones, mostly located in parts of eastern Gansu Province and the junction of Shaanxi and Shanxi provinces, have seen improvements in EEQ mainly due to human activities. Here, crucial intervention moving forward will consist in the monitoring of human impacts and appropriate restoration actions. Comprehensive degradation zones, which are widely distributed across the LP, are negatively impacted by both climate change and human activities. The priority here is the establishment of comprehensive management strategies focusing on restoring ecological functions, enhancing biodiversity, improving soil quality, and reducing human interference. Specifically, measures may be taken with regard to water and soil conservation, vegetation restoration, artificial intervention, establishment of cropland-forest networks, reduction of overgrazing, and improvement of ecosystem self-restoration. In climate-sensitive zones, mainly located in eastern Gansu Province and east-central Shanxi Province and highly affected by climate change, monitoring should be strengthened by adopting adaptive management approaches, such as agricultural technologies for introducing drought-resistant and cold-resistant plants, improving land use, and enhancing climate adaptability to increase resilience. Finally, human disturbance zones, which are concentrated in the northern and southern LP, require the reduction of human interference and promotion of ecosystem self-restoration.
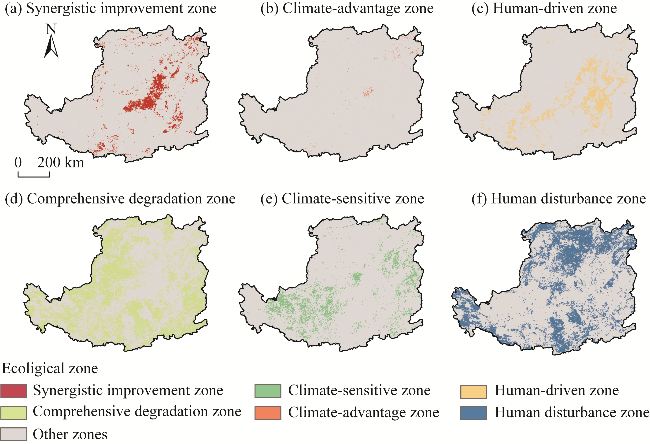
Fig. 11 Spatial distribution of the six types of ecological zones on the LP determined based on the contributions of climate change and human activities to kRSEI variation. (a), synergistic improvement zone; (b), climate-advantage zone; (c), human-driven zone; (d), comprehensive degradation zone; (e), climate-sensitive zone; (f), human disturbance zone.

4 Discussion

4.1 Impacts of climate change and human activities on EEQ

The vulnerable ecosystems of arid and semi-arid areas are highly sensitive to climate change (Shi et al., 2021; Chen et al., 2024). The impacts of climate change on EEQ are primarily manifested through direct effects on plant growth and the indirect regulation of human activities (Shao et al., 2024). Previous studies have shown that climate change accounts for 71.52% of the variation in RSEI in the Shendong Mining Area (Tian et al., 2025). Furthermore, it contributes to improving EEQ in 72.67% of the Shendong Mining Area, particularly in the southwestern and southeastern parts (Tian et al., 2025). In contrast, areas experiencing negative effects are mainly located in the northeastern and southeastern parts, which are largely consistent with the spatial distribution of the contribution of precipitation (Tian et al., 2025). Other studies have identified precipitation and temperature as the primary climatic variables influencing EEQ on the LP (Bai et al., 2023b; Zhou et al., 2024). Over time, ecosystem distribution and biophysical processes have become increasingly correlated with rising temperatures and shifting precipitation patterns. In this study, a positive correlation between kRSEI and precipitation was detected in 73.56% of the LP, suggesting that increased precipitation generally promoted EEQ, particularly in the central and western parts. These regions are characterized by low precipitation, and the main land cover types are grasslands, croplands, and bare soil. Increased precipitation can enhance soil moisture and improve water availability, thereby supporting vegetation growth and ecological recovery, with a significant positive effect on EEQ (Gong et al., 2025). However, these improvements are limited by a precipitation threshold of 837.66 mm/a. Beyond this optimal level, EEQ tends to decline, as excess precipitation in areas with sparse vegetation and loose soil (typical of the LP) leads to soil organic matter loss and severe water erosion, ultimately degrading ecological quality (Zhang et al., 2023b). Actually, the precipitation on the LP hardly reaches this threshold (837.66 mm/a), thus precipitation primarily exerted positive effect on EEQ on the LP. With regard to temperature, a positive correlation with kRSEI was observed in 49.28% of the LP, whereas 50.72% exhibited a negative correlation, indicating a complex relationship between temperature and EEQ. Compared with temperature, precipitation exerted a more pronounced positive effect on EEQ.
Human activities, including population growth, land use change, and the implementation of ecological restoration measures, also play a dual role in affecting EEQ (Li et al., 2021; Xiao et al., 2022; Zou et al., 2022). While many studies have identified climate change as the dominant factor driving improvements in regional EEQ (Wang et al., 2019; Liang et al., 2024; Tian et al., 2025), our results showed that the influence of human activities was much stronger. In arid and semi-arid areas, advanced agricultural irrigation systems and intensive human activities can lead to the overexploitation of water and land resources, negatively impacting EEQ (Zhang et al., 2022d). Conversely, the implementation of ecological restoration projects and environmental protection policies improve EEQ in the short term (Zhang et al., 2025), and these effects often surpass those of long-term climate change (Zhou et al., 2015). Therefore, within the context of climate change, effectively managing human activities is crucial for maintaining and improving EEQ on the LP. Comparative analyses of the factors affecting EEQ in this region provide valuable scientific insights for understanding ecosystem dynamics and optimizing environmental management policies.

4.2 Comparison between kRSEI and traditional RSEI

Several studies have attempted to refine RSEI by tailoring it to the specific ecological features of the region under investigation. For example, the Arid Remote Sensing Ecological Index (ARSEI) was developed for evaluating EEQ in desert environments (Wang et al., 2020), and the Mine-Specific Eco-Environment Index (MSEEI) was created for monitoring EEQ in mining areas (Zhang et al., 2023a). This study further improved upon the traditional RSEI by replacing the greenness indicator NDVI with kNDVI to construct kRSEI. The integration of kNDVI was particularly advantageous for investigations of the LP, which is characterized by undulating topography, diverse vegetation types, and severe soil erosion. The adaptive stretching-based algorithm for kNDVI significantly improves the differentiation between various land cover types, such as forests and barren land (Wang et al., 2022c). Since 1999, large-scale ecological restoration projects, including the Grain-for-Green program and grazing bans, have substantially increased vegetation cover in certain areas. However, the traditional NDVI often exhibits saturation in regions with high vegetation density, which limits its ability to capture dynamic vegetation changes (Wang et al., 2022b). By dynamically adjusting the relationship between near-infrared and red spectral bands, kNDVI offers a more accurate detection of ecological changes in densely vegetated areas. Moreover, vegetation growth cycles on the LP are strongly influenced by seasonal precipitation and temperature. The kNDVI, with its superior phenological sensitivity, enables a more precise tracking of vegetation characteristics at different growth stages, thereby improving the identification of temporal trends in vegetation dynamics. These capabilities are particularly crucial for the LP, where ecological monitoring can be very challenging due to complex terrain and diverse vegetation types.

4.3 Limitations and prospects

This study assessed EEQ on the LP using an RSEI-based model that incorporated kNDVI instead of the traditional NDVI to evaluate more accurate EEQ in vegetated areas. However, the proposed model still has limitations in terms of applicability, as it could not fully account for regional differences and potential inconsistencies in data obtained from different remote sensing sources (MODIS, Landsat, and Sentinel-2) (Li and Roy, 2017). Additionally, further limitations exist in the multiple regression residual analysis employed to identify the complex or combined effect of climate change and human activities on EEQ and quantify their relative contributions. One issue is the lack of agreement on the selection of relevant climatic variables (such as precipitation, humidity, temperature, or solar radiation) when constructing the regression model for kRSEI. It also remains difficult to separate the influence of climatic shifts from that of human activities (Wessels et al., 2012). In simple terms, when anthropogenic impacts are more pronounced, the role of climatic factors may be mistakenly attributed to human actions. Therefore, future research should consider incorporating a broader set of climatic variables to assess more accurately the relative contributions of environmental factors to kRSEI. Finally, some limits must be mentioned with regard to the classification of ecological zones based on the analysis of the contributions of climatic and anthropogenic factors to EEQ and the proposed strategies for ecological restoration in each of them. While this study provides valuable insights for future restoration projects, the current ecological restoration strategies don't fully consider the balance between financial investment and benefit returns. Moreover, the implementation of restoration measures must account for potential management and coordination challenges posed by administrative boundaries. Moving forward, it is essential to further optimize the implementation of restoration projects to ensure that such efforts achieve ecological benefits while maintaining economic feasibility and a functionally regional coordination.

5 Conclusions

MODIS remote sensing images of the LP from 2000 to 2022 were used to analyze the spatiotemporal variations in kRSEI, including its trends and projected future trajectories, and to assess the impacts of climate change and human activities on EEQ and their respective contributions. Spatially, EEQ exhibited a stepwise degradation pattern in the southeast to northwest direction. Starting from the year 2000, the areas rated as having a moderate EEQ or higher gradually expanded, and their boundaries shifted northwestward. However, after 2015, this trend showed signs of reversal, with the boundary moving back toward the southeast. On an interannual scale, EEQ demonstrated a general declining trend during the study period, indicating that in the future, EEQ across most regions of the LP is projected to follow a weak anti-persistent trend. It is noteworthy that kRSEI showed a positive correlation with precipitation, especially in the central and western parts of the LP. However, improvements appeared to be limited by a precipitation threshold of 837.66 mm/a, beyond which additional precipitation did not enhance EEQ. The relationship between temperature and EEQ was more complex: moderate temperature increases could be beneficial, whereas excessive warming tended to exert negative impacts on the ecological environment. Climate change and human activities jointly affected 65.78% of the LP area, predominantly via negative impacts on EEQ. Moreover, compared with climate change, human activities had stronger effects across all land cover types. To minimize anthropogenic disturbances and foster natural ecosystem recovery, we divided the LP into six ecological restoration zones. The results of this study provided important insights into the patterns and mechanisms of ecological change on the LP and will assist in the identification of key management units, offering a scientific basis for implementing region-specific ecological protection and restoration strategies.

Conflict of interest

The authors declare that they have no known competing financial interest or personal relationship that could have appeared to influence the work reported in this paper.

Acknowledgments

This research was funded by the National Natural Science Foundation of China (42361017), the Gansu Provincial Science and Technology Program-Special Program for Key Research and Development (R&D) on Ecological Civilization Construction in Gansu Province (24YFFA050), and the Gansu Agricultural University-Gansu Provincial Academy of Natural Resources Planning Joint Graduate Training Base Project (GAU2024-003).

Author contributions

Conceptualization: PEI Tingting; Data curation: XI Ruiyun, CHEN Ying, XIE Baopeng, WANG Wen, HOU Li; Formal analysis: XI Ruiyun, HOU Li; Funding acquisition: PEI Tingting, WANG Wen; Investigation: HOU Li; Methodology: XI Ruiyun, PEI Tingting; Project administration: PEI Tingting, CHEN Ying; Resources: CHEN Ying; Software: XI Ruiyun, PEI Tingting, CHEN Ying; Writing - original draft preparation: XI Ruiyun; Writing - review and editing: PEI Tingting, CHEN Ying. All authors approved the manuscript.
[1]
Alexander C. 2020. Normalised difference spectral indices and urban land cover as indicators of land surface temperature (LST). International Journal of Applied Earth Observation and Geoinformation, 86: 102013, doi: 10.1016/j.jag.2019.102013.

[2]
An M, Xie P, He W J, et al. 2022. Spatiotemporal change of ecologic environment quality and human interaction factors in three gorges ecologic economic corridor, based on RSEI. Ecological Indicators, 141: 109090, doi: 10.1016/j.ecolind.2022.109090.

[3]
Bai T T, Cheng J, Zheng Z H, et al. 2023a. Drivers of eco-environmental quality in China from 2000 to 2017. Journal of Cleaner Production, 396: 136408, doi: 10.1016/j.jclepro.2023.136408.

[4]
Bai X, Zhang Z W, Li Z, et al. 2023b. Spatial heterogeneity and formation mechanism of eco-environmental quality in the Yellow River Basin. Sustainability, 15(14): 10878, doi: 10.3390/su151410878.

[5]
Boori M S, Choudhary K, Paringer R, et al. 2021. Spatiotemporal ecological vulnerability analysis with statistical correlation based on satellite remote sensing in Samara, Russia. Journal of Environmental Management, 285: 112138, doi: 10.1016/j.jenvman.2021.112138.

[6]
Camps-Valls G, Campos-Taberner M, Moreno-Martínez Á, et al. 2021. A unified vegetation index for quantifying the terrestrial biosphere. Science Advances, 7(9): eabc7447, doi: 10.1126/sciadv.abc7447.

[7]
Cao J X, Wu E T, Wu S H, et al. 2022. Spatiotemporal dynamics of ecological condition in Qinghai-Tibet Plateau based on remotely sensed ecological index. Remote Sensing, 14(17): 4234, doi: 10.3390/rs14174234.

[8]
Chen S F, Zhang Q F, Chen Y N, et al. 2023. Vegetation change and eco-environmental quality evaluation in the Loess Plateau of China from 2000 to 2020. Remote Sensing, 15(2): 424, doi: 10.3390/rs15020424.

[9]
Chen W Y, Zhao R F, Lu H T. 2024. Response of ecological environment quality to land use transition based on dryland oasis ecological index (DOEI) in dryland: A case study of oasis concentration area in middle Heihe River, China. Ecological Indicators, 165: 112214, doi: 10.1016/j.ecolind.2024.112214.

[10]
Cheng X Y, Wang R Y, Liu H L, et al. 2023. Assessment of ecological environment in Zhanjiang based on RSEI and PCA. International Journal of Environment, Agriculture and Biotechnology, 8: 5, doi: 10.22161/ijeab.85.4.

[11]
Du B Z, Zhen L, Yan H M, et al. 2016. Effects of government grassland conservation policy on household livelihoods and dependence on local grasslands: Evidence from Inner Mongolia, China. Sustainability, 8(12): 1314, doi: 10.3390/su8121314.

[12]
Feng X J, Tian J, Wang Y X, et al. 2023. Spatio-temporal variation and climatic driving factors of vegetation coverage in the Yellow River Basin from 2001 to 2020 based on kNDVI. Forests, 14(3): 620, doi: 10.3390/f14030620.

[13]
Gan X T, Du X C, Duan C J, et al. 2024. Evaluation of ecological environment quality and analysis of influencing factors in Wuhan City based on RSEI. Sustainability, 16(13): 5809, doi: 10.3390/su16135809.

[14]
Gou R K, Zhao J. 2020. Eco-environmental quality monitoring in Beijing, China, using an RSEI-based approach combined with random forest algorithms. IEEE Access, 8: 196657-196666.

[15]
Gong C, F N, Wang Y L. 2023. Spatiotemporal change and drivers of ecosystem quality in the Loess Plateau based on RSEI: A case study of Shanxi, China. Ecological Indicators, 155: 111060, doi: 10.1016/j.ecolind.2023.111060.

[16]
Gong X G, Zhang Y Z, Ren J, et al. 2025. Ecological response of green spaces to land use change in the Mu Us Desert-Loess Plateau transition zone, China, since the twenty-first century. Environmental Monitoring and Assessment, 197: 435, doi: 10.1007/s10661-025-13906-w.

[17]
Hamel P, Bryant B P. 2017. Uncertainty assessment in ecosystem services analyses: Seven challenges and practical responses. Ecosystem Services, 24: 1-15.

[18]
IPCC Intergovernmental Panel on Climate Change. 2023. Climate Change 2021: The Physical Science Basis—Working Group I Contribution to the Sixth Assessment Report of the Intergovernmental Panel on Climate Change. Cambridge: Cambridge University Press.

[19]
Kamran M, Yamamoto K. 2023. Evolution and use of remote sensing in ecological vulnerability assessment: A review. Ecological Indicators, 148: 110099, doi: 10.1016/j.ecolind.2023.110099.

[20]
Li J, Roy D P. 2017. A global analysis of Sentinel-2A, Sentinel-2B and Landsat-8 data revisit intervals and implications for terrestrial monitoring. Remote Sensing, 9(9): 902, doi: 10.3390/rs9090902.

[21]
Li W J, Xie S Y, Wang Y, et al. 2021. Effects of urban expansion on ecosystem health in Southwest China from a multi-perspective analysis. Journal of Cleaner Production, 294: 126341, doi: 10.1016/j.jclepro.2021.126341.

[22]
Liang L F, Song Y X, Shao Z F, et al. 2024. Exploring the causal relationships and pathways between ecological environmental quality and influencing factors: A comprehensive analysis. Ecological Indicators, 165: 112192, doi: 10.1016/j.ecolind.2024.112192.

[23]
Luo H X, Xu Y M, Han Q, et al. 2024. Remote sensing assessment of ecological quality of Baiyangdian wetland in response to extreme rainfall. Remote Sensing Applications: Society and Environment, 36: 101284, doi: 10.1016/j.rsase.2024.101284.

[24]
Naseri N, Mostafazadeh R. 2023. Spatial relationship of remote sensing ecological indicator (RSEI) and landscape metrics under urban development intensification. Earth Science Informatics, 16: 3797-3810.

[25]
Peng X F, Zhang S Q, Peng P H, et al. 2023. Unraveling the ecological tapestry: A comprehensive assessment of Changtang Nature Reserve's ecological and environmental using RSEI and GEE. Land, 12(8): 1581, doi: 10.3390/land12081581.

[26]
Qi G, Cong N, Luo M, et al. 2024. Contribution of climatic change and human activities to vegetation dynamics over Southwest China during 2000-2020. Remote Sensing, 16(18): 3361, doi: 10.3390/rs16183361.

[27]
Qin G X, Wang N L, Wu Y W, et al. 2024. Spatiotemporal variations in eco-environmental quality and responses to drought and human activities in the middle reaches of the Yellow River Basin, China from 1990 to 2022. Ecological Informatics, 81: 102641, doi: 10.1016/j.ecoinf.2024.102641.

[28]
Shao Y J, Liu Y S, Wang X C, et al. 2024. Exploring the evolution of ecosystem health and sustainable zoning: A perspective based on the contributions of climate change and human activities. Science of the Total Environment, 951: 175674, doi: 10.1016/j.scitotenv.2024.175674.

[29]
Shi S Y, Yu J J, Wang F, et al. 2021. Quantitative contributions of climate change and human activities to vegetation changes over multiple time scales on the Loess Plateau. Science of the Total Environment, 755(Part 2): 142419, doi: 10.1016/j.scitotenv.2020.142419.

[30]
Strassburg B B, Iribarrem A, Beyer H L, et al. 2022. Author correction: Global priority areas for ecosystem restoration. Nature, 609: E7, doi: 10.1038/s41586-022-05178-y.

[31]
Sun C, Li J L, Liu Y C, et al. 2022. Ecological quality assessment and monitoring using a time-series remote sensing-based ecological index (ts-RSEI). GIScience & Remote Sensing, 59(1): 1793-1816.

[32]
Tian Y, Wang Z L, Ji C N, et al. 2025. The influence of human activities and climate change on the spatiotemporal variations of eco-environmental quality in Shendong Mining Area, China from 1990 to 2023. Applied Sciences, 15(5): 2296, doi: 10.3390/app15052296.

[33]
Wang F, Lai H X, Li Y B, et al. 2022a. Dynamic variation of meteorological drought and its relationships with agricultural drought across China. Agricultural Water Management, 261: 107301, doi: 10.1016/j.agwat.2021.107301.

[34]
Wang J, Ma J L, Xie F F, et al. 2020. Improvement of remote sensing ecological index in arid regions: Taking Ulan Buh Desert as an example. Chinese Journal of Applied Ecology, 31(11): 3795-3804. (in Chinese)

[35]
Wang J J, Ding J L, Ge X Y, et al. 2022b. Assessment of ecological quality in Northwest China (2000-2020) using the Google Earth Engine platform: Climate factors and land use/land cover contribute to ecological quality. Journal of Arid Land, 14(11): 1196-1211.

[36]
Wang L C, Jiao L, Lai F B, et al. 2019. Evaluation of ecological changes based on a remote sensing ecological index in a Manas Lake wetland, Xinjiang. Acta Ecologica Sinica, 39(8): 2963-2972. (in Chinese)

[37]
Wang X, Yao X J, Jiang C Z, et al. 2022c. Dynamic monitoring and analysis of factors influencing ecological environment quality in northern Anhui, China, based on the Google Earth Engine. Scientific Reports, 12: 20307, doi: 10.1038/s41598-022-24413-0.

[38]
Wang Z Z, Fu B J, Wu X T, et al. 2023. Vegetation resilience does not increase consistently with greening in China's Loess Plateau. Communications Earth & Environment, 4: 336, doi: 10.1038/s43247-023-01000-3.

[39]
Wen C H, Long T F, He G J, et al. 2025. Temporally enhanced RSEI and nighttime lights reveal long-term ecological changes and effective protection in China's inaugural national parks. Ecological Indicators, 170: 112981, doi: 10.1016/j.ecolind.2024.112981.

[40]
Wessels K J, van den Bergh F, Scholes R J. 2012. Limits to detectability of land degradation by trend analysis of vegetation index data. Remote Sensing of Environment, 125: 10-22.

[41]
Xiao Z L, Liu R, Gao Y H, et al. 2022. Spatiotemporal variation characteristics of ecosystem health and its driving mechanism in the mountains of Southwest China. Journal of Cleaner Production, 345: 131138, doi: 10.1016/j.jclepro.2022.131138.

[42]
Xiong Y, Xu W H, Lu N, et al. 2021. Assessment of spatial-temporal changes of ecological environment quality based on RSEI and GEE: A case study in Erhai Lake Basin, Yunnan Province, China. Ecological Indicators, 125: 107518, doi: 10.1016/j.ecolind.2021.107518.

[43]
Xu H Q. 2005. A study on information extraction of water body with the modified normalized difference water index (MNDWI). National Remote Sensing Bulletin, 9(5): 589-595. (in Chinese)

[44]
Xu H Q. 2013a. A remote sensing index for assessment of regional ecological changes. China Environmental Science, 33(5): 889-897. (in Chinese)

[45]
Xu H Q. 2013b. A remote sensing urban ecological index and its application. Acta Ecologica Sinica, 33(24): 7853-7862. (in Chinese)

[46]
Xu H Q, Wang M Y, Shi T T, et al. 2018. Prediction of ecological effects of potential population and impervious surface increases using a remote sensing based ecological index (RSEI). Ecological Indicators, 93: 730-740.

[47]
Xu H Q, Wang Y F, Guan H D, et al. 2019. Detecting ecological changes with a remote sensing based ecological index (RSEI) produced time series and change vector analysis. Remote Sensing, 11(20): 2345, doi: 10.3390/rs11202345.

[48]
Yang G, Chen Y H, Ren Q, et al. 2024. Remote sensing ecological index (RSEI) affects microbial community diversity in ecosystems of different qualities. Science of the Total Environment, 954: 176489, doi: 10.1016/j.scitotenv.2024.176489.

[49]
Yang W L, Zhou Y, Li C Z. 2023. Assessment of ecological environment quality in rare earth mining areas based on improved RSEI. Sustainability, 15(4): 2964, doi: 10.3390/su15042964.

[50]
Yao Z Y, Xiao J H, Ma X X. 2021. The impact of large-scale afforestation on ecological environment in the Gobi region. Scientific Reports, 11: 14383, doi: 10.1038/s41598-021-93948-5.

[51]
Yu Y, Wu Y, Wang P, et al. 2021. Grassland subsidies increase the number of livestock on the Tibetan Plateau: why does the Payment for Ecosystem Services Policy have the opposite outcome? Sustainability, 13(11): 6208, doi: 10.3390/su13116208.

[52]
Yuan B D, Fu L N, Zou Y A, et al. 2021. Spatiotemporal change detection of ecological quality and the associated affecting factors in Dongting Lake Basin, based on RSEI. Journal of Cleaner Production, 302: 126995, doi: 10.1016/j.jclepro.2021.126995.

[53]
Yuan D H, Du M R, Yan C L, et al. 2024. Coupling coordination degree analysis and spatiotemporal heterogeneity between water ecosystem service value and water system in Yellow River Basin cities. Ecological Informatics, 79: 102440, doi: 10.1016/j.ecoinf.2023.102440.

[54]
Zhang J J, Zhou Q, Cao M, et al. 2022a. Spatiotemporal change of eco-environmental quality in the oasis city and its correlation with urbanization based on RSEI: A case study of Urumqi, China. Sustainability, 14(15): 9227, doi: 10.3390/su14159227.

[55]
Zhang K L, Feng R R, Zhang Z C, et al. 2022b. Exploring the driving factors of remote sensing ecological index changes from the perspective of geospatial differentiation: a case study of the Weihe River Basin, China. International Journal of Environmental Research and Public Health, 19(17): 10930, doi: 10.3390/ijerph191710930.

[56]
Zhang L Y, Li X, Liu X H, et al. 2025. Dynamic monitoring and drivers of ecological environmental quality in the Three-North region, China: Insights based on remote sensing ecological index. Ecological Informatics, 85: 102936, doi: 10.1016/j.ecoinf.2024.102936.

[57]
Zhang P P, Chen X D, Ren Y, et al. 2023a. A novel mine-specific eco-environment index (MSEEI) for mine ecological environment monitoring using Landsat imagery. Remote Sensing, 15(4): 933, doi: 10.3390/rs15040933.

[58]
Zhang X, Gao Z L, Li Y H, et al. 2023b. Eco-environment quality response to climate change and human activities on the Loess Plateau, China. Land, 12(9): 1792, doi: 10.3390/land12091792.

[59]
Zhang Y, She J Y, Long X R, et al. 2022c. Spatio-temporal evolution and driving factors of eco-environmental quality based on RSEI in Chang-Zhu-Tan metropolitan circle, central China. Ecological Indicators, 144: 109436, doi: 10.1016/j.ecolind.2022.109436.

[60]
Zhang Y B, Song T L, Fan J H, et al. 2022d. Land use and climate change altered the ecological quality in the Luanhe River Basin. International Journal of Environmental Research and Public Health, 19(13), 7719, doi: 10.3390/ijerph19137719.

[61]
Zheng Z H, Wu Z F, Chen Y B, et al. 2022. Instability of remote sensing based ecological index (RSEI) and its improvement for time series analysis. Science of the Total Environment, 814: 152595, doi: 10.1016/j.scitotenv.2021.152595.

[62]
Zhou M L, Li Z H, Gao M L, et al. 2024. Revealing the eco-environmental quality of the Yellow River Basin: Trends and drivers. Remote Sensing, 16(11): 2018, doi: 10.3390/rs16112018.

[63]
Zhou S, Huang Y F, Yu B F, et al. 2015. Effects of human activities on the eco-environment in the middle Heihe River Basin based on an extended environmental Kuznets curve model. Ecological Engineering, 76: 14-26.

[64]
Zhu D Y, Chen T, Wang Z W, et al. 2021. Detecting ecological spatial-temporal changes by remote sensing ecological index with local adaptability. Journal of Environmental Management, 299: 113655, doi: 10.1016/j.jenvman.2021.113655.

[65]
Zou S B, Qian J K, Xu B R, et al. 2022. Spatiotemporal changes of ecosystem health and their driving mechanisms in alpine regions on the northeastern Tibetan Plateau. Ecological Indicators, 143: 109396, doi: 10.1016/j.ecolind.2022.109396.

Outlines

/