Research article

Health risk assessment of heavy metals in coal mine soils of Northwest China

  • LI Yun 1, 2 ,
  • ZHUANG Zhong 3 ,
  • XIA Qianrou , 4, * ,
  • SHI Qingdong 1, 2 ,
  • ZHU Jiawei 1, 2 ,
  • WANG Peijuan 1, 2 ,
  • LI Dinghao 1, 2 ,
  • Yryszhan ZHAKYPBEK 5 ,
  • Serik TURSBEKOV 5
Expand
  • 1College of Ecology and Environment, Xinjiang University, Urumqi 830046, China
  • 2Key Laboratory of Oasis Ecology, Ministry of Education (Xinjiang University), Urumqi 830046, China
  • 3College of Resources and Environment Sciences, China Agricultural University, Beijing 100193, China
  • 4Xinjiang Academy of Ecological and Environmental Sciences, Urumqi 830011, China
  • 5Department of Mine Surveying and Geodesy, Institute Mining and Metallurgical Institute named after O.A. Baikonurov, Satbayev University, Almaty 050013, Kazakhstan
*XIA Qianrou (E-mail: )

Received date: 2025-01-03

  Revised date: 2025-03-17

  Accepted date: 2025-04-29

  Online published: 2025-08-12

Abstract

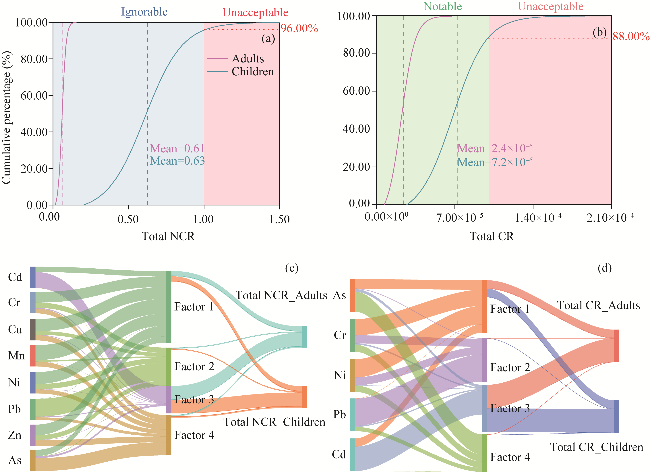
Coal mining predisposes soils to heavy metal (HM) accumulation, which adversely affects the ecological environment and human health, particularly in extremely arid and vulnerable areas. In this study, soil samples were gathered from the Black Mountain Open Pit Coal Mine in Turpan City, Northwest China to determine the health risk of heavy metals (HMs). Results showed that positive matrix factorization model divided the sources of soil HMs into four categories, i.e., natural and animal husbandry (43.46%), industrial transportation (22.87%), fossil fuel combustion (10.64%), and atmospheric deposition and domestic pollution (23.03%). All kinds of pollution evaluation indices showed that Cd (cadmium) and Pb (plumbum) pollution was evident. The Monte Carlo simulated health risk assessment results showed that 4.00% non-carcinogenic risk and 12.00% carcinogenic risk were posed to children, and the positive matrix factorization-based health risk assessment showed that fossil fuel combustion had the highest contribution to the health risks to adults and children, while industrial transportation was the lowest. In this study, the risks of HMs in the soil of mining area were analyzed using source analysis, which not only provides reliable data support for the prevention and control of HM pollution in the soil of this arid mining area, but also provides a theoretical basis for subsequent regional research.

Cite this article

LI Yun , ZHUANG Zhong , XIA Qianrou , SHI Qingdong , ZHU Jiawei , WANG Peijuan , LI Dinghao , Yryszhan ZHAKYPBEK , Serik TURSBEKOV . Health risk assessment of heavy metals in coal mine soils of Northwest China[J]. Journal of Arid Land, 2025 , 17(7) : 933 -957 . DOI: 10.1007/s40333-025-0023-9

1 Introduction

Frequent mining activities can pose numerous ecological challenges. Among them, heavy metal pollution (HMP) in soil is particularly prominent (Yang et al., 2018). Heavy metals (HMs) have an impact on the development and growth of soil animals and plants, which occurs through the interaction between soil microorganisms and enters human body via food chain, posing a considerable threat to human health (Zhao et al., 2019; Liu et al., 2023). Studies have confirmed that the contents of HMs, such as plumbum (Pb), cadmium (Cd), and arsenic (As), in the soil of mining areas in southern China exceed the standards, threatening the surrounding soils and water bodies (Cao et al., 2018; Li et al., 2019). These studies revealed the hazards posed by coal mining activities to soils and ecosystems, but these studies are concentrated in mining areas in humid or sub-humid areas. Compared with these areas, the ecological environment of arid areas is more fragile, with limited soil moisture and sparse vegetation. As a typical arid area in China, Xinjiang Uygur Autonomous Region has less research on HMP, and may face more complex and severe HMP problems (Qi et al., 2022). Therefore, the sources of HMs in and around the soils in the arid mining area must be identified.
Commonly recognized methods for HM source identification include positive matrix factorization (PMF) (Tian et al., 2018; Zhou et al., 2024), exploratory factor analysis (EFA) (Specht et al., 2025), chemical mass balance (CMB) model (Mi et al., 2023), and the Unmix model (Liao et al., 2021). Owing to the high flexibility and adaptability of the PMF model, it is important in the identification of soil HM sources (Xu et al., 2021), and it is the recommended method by the US Environmental Protection Agency (EPA) (US EPA, 2015). This model can accurately analyze the complex environmental data and clearly reveal the proportions of different sources contributing to HMs. In addition, it can also be adapted and optimized by different research needs (Guan et al., 2018; Anaman et al., 2022). The PMF model can accurately identify and analyze soil HMs in arid mining areas, thereby providing a scientific basis for ecological environmental protection in these areas.
With the aid of various evaluation indices and methods, more targeted directions and practical strategies for the ecological protection of arid mining areas can be developed. Indicators such as Nemerow integrated pollution index (NIPI) (Hu et al., 2018a; Zhou et al., 2024), geoaccumulation index (Igeo) (Zhuang et al., 2018), and enrichment factor (EF) (Wang et al., 2023) have been widely employed to assess HMP in mining soils. The human health risk assessment (HRA) model put forward by the US EPA is currently the most commonly used method for assessing soil HM health risks (US EPA, 2013). However, owing to the uncertainty in HM concentrations, regional differences, and fluctuations in exposure parameters, traditional soil HM risk assessments may overestimate or underestimate the risk level in the area (Liu et al., 2023). Common soil contamination is caused by the co-coupling of multiple HMs, and a single soil analysis method cannot comprehensively reflect such contamination. Therefore, in this study, probabilistic risk estimation using Monte Carlo simulation was used to enhance the accuracy of human HRA model (Yang et al., 2019; Li et al., 2023), and PMF and HRA models were combined to more accurately determine HM sources that need to be prioritized for control (Shen et al., 2024).
Turpan City, located in Northwest China has abundant mineral reserves and frequent industrial manufacturing activities. However, in previous studies, researchers have not paid sufficient attention to HMP of soil in and around mining areas, and to the associated health risks. In this study, the contents and distributions of HMs in and around the area of Black Mountain Open Pit Coal Mine in Turpan City were investigated. The aims of this study were: (1) to identify the sources of soil HMs using PMF model; (2) to analyze the pollution level of soil HMs in and around the mining area using various pollution indices, and (3) to increase the precision of HRA using Monte Carlo simulation and determine the health risks of different sources to human beings by combining source analysis and HRA. The results might offer theoretical direction for ecological protection of the area and data support for the prevention and management of HMP in arid mining areas.

2 Materials and methods

2.1 Study area

The Black Mountain Open Pit Coal Mine (43°12′30″-43°16′00″N, 87°30′00″‒87°38′30″E) is located in Turpan City, Xinjiang, China. The coal mine is located in a valley of northern Tianshan Mountains, northern Yokakeng Aidai Mountains, and southern Mordelok and Black Mountains. The topography in the east and west is relatively open, and the terrain was high in the north and low in the south and west. The altitude ranges from 2365 to 3023 m a.s.l. The study area has an arid climate and sparse vegetation, and is highly sensitive to soil erosion, while it is mildly sensitive to land desertification. The gullies and ravines in the area are relatively developed, and are dry throughout the year, with short-term flooding occurring only during heavy rainfall.
The total coal mine production increased up to 13×106 t/a in 2023 (National Energy Xinjiang Toksun Energy Co., Ltd., 2022). The main ecological challenges in the area are the high intensity of human activities, simple ecosystem structure, decline in ecological functions, destruction of landforms caused by open-pit coal mining, severe damage to grassland vegetation, and the bare ground surface providing a sand source for the occurrence of sandstorms, which poses a serious threat to the ecological security of the area (Department of Ecology and Environment of Xinjiang Uygur Autonomous Region, 2022).

2.2 Soil sampling and preparation

In this study, 61 soil samples were collected from the open-pit mine area and surrounding areas in August 2023 (Fig. 1), which include the discharge area, coal mining area, transportation roads, as well as the vicinity of village. Three 0-20 cm soil samples were taken from each sampling site, mixed, encapsulated, and numbered using polyethylene bags, with the weight of 1 kg for each sample.
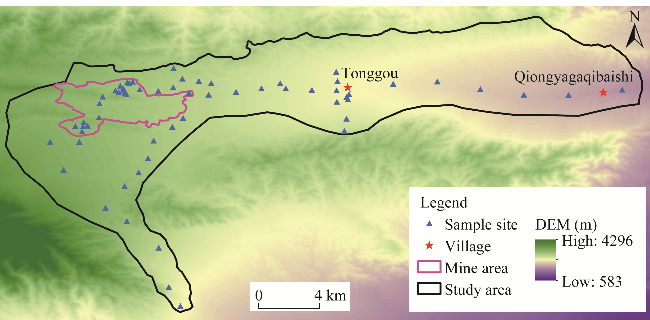
Fig. 1 Overview and sample sites of the study area. DEM, digital elevation model.
All collected samples were transported to the laboratory for pretreatment. The soil was dried naturally. Gravel, plant roots, and other debris materials were removed. Soil was ground, and passed through a 100-mesh nylon sieve. Each sample was divided into two parts and placed in a self-sealing bag. One part was used for measurement, and the other part was stored as reserve (Zhang et al., 2024b). Metal contamination of soil samples was avoided throughout the process. The concentrations of Cd, chromium (Cr), copper (Cu), ferrum (Fe), manganese (Mn), nickel (Ni), Pb, zinc (Zn), and arsenic (As), and soil pH were investigated. HM concentrations were determined using inductively coupled plasma-mass spectrometry (MEE, 2023), and soil pH was determined using the potentiometric method (MEE, 2018a). HM concentrations and soil pH results are presented in Table S1.
Table S1 Heavy metal (HM) concentration and pH value in soil samples
Sample Cd Cr Cu Fe Mn Ni Pb Zn As pH
(mg/kg)
1 0.12 63.24 41.18 30,416.67 868.87 29.17 2.45 90.69 5.17 7.66
2 0.12 45.95 40.48 26,809.52 1024.29 22.62 3.57 88.57 6.76 8.16
3 0.17 49.01 36.14 22,898.52 623.52 22.53 7.43 70.30 7.40 8.60
4 0.12 53.68 41.67 27,034.31 1002.94 25.00 2.70 99.76 9.04 7.79
5 0.19 58.81 44.52 32,261.91 752.14 26.43 16.19 95.00 4.73 7.60
6 0.25 62.01 48.53 28,774.51 974.51 31.13 6.37 98.53 6.33 7.74
7 0.19 57.93 48.32 26,899.04 1070.91 31.73 0.72 107.93 9.03 7.85
8 0.15 34.31 21.08 11,875.00 804.90 12.75 1.47 70.59 13.71 8.13
9 0.12 60.44 48.54 24,135.92 784.95 28.16 3.88 88.35 13.04 7.20
10 0.08 64.00 42.75 32,500.00 956.50 29.75 9.50 104.00 12.26 7.88
11 0.12 70.71 64.52 35,571.43 916.91 33.10 10.95 111.43 19.93 8.36
12 0.38 66.75 43.25 29,275.00 749.25 28.50 9.50 89.75 14.57 8.06
13 0.62 71.29 42.33 32,450.50 814.36 27.97 12.87 103.96 13.19 8.04
14 0.12 57.77 37.38 30,194.18 695.63 27.18 18.45 104.61 8.58 7.85
15 0.15 56.86 48.28 31,568.63 734.31 25.98 10.29 99.02 13.08 7.89
16 0.12 48.81 28.81 23,523.81 422.38 21.67 1.91 75.71 6.50 7.98
17 0.19 50.49 32.04 22,237.86 648.30 22.82 6.55 77.18 12.41 7.68
18 0.13 69.25 47.75 31,150.00 827.75 26.50 11.75 113.25 12.40 7.87
19 0.36 72.82 60.44 29,733.01 848.54 28.16 10.92 98.06 19.49 7.56
20 0.12 54.05 43.10 24,047.62 541.43 23.33 13.81 93.33 17.50 7.76
21 0.10 65.00 48.81 32,928.57 763.81 26.67 7.38 94.52 14.80 8.40
22 0.36 183.89 90.39 46,177.89 1287.02 79.81 8.89 56.25 10.26 8.41
23 0.12 48.52 46.54 29,133.66 875.50 23.27 17.33 112.38 9.31 7.96
24 0.07 59.62 38.94 27,019.23 699.76 27.64 6.25 122.12 12.14 7.55
25 0.12 60.29 67.65 27,867.65 1005.15 24.76 7.60 128.92 9.93 7.76
26 0.20 67.75 123.25 35,750.00 2208.25 32.25 21.75 125.25 12.63 8.66
27 0.12 54.81 31.49 26,875.00 589.42 19.71 8.41 66.83 15.38 8.49
28 0.20 50.74 58.82 27,573.53 1157.11 22.55 28.68 171.81 10.61 7.05
29 0.12 67.14 50.24 34,023.81 941.19 31.19 27.14 113.81 15.11 8.09
30 0.15 44.66 35.44 21,089.81 646.36 21.36 8.50 68.20 16.95 7.83
31 0.10 52.43 53.16 29,441.75 1063.59 18.93 15.05 108.50 12.71 8.50
32 0.12 56.49 55.77 29,615.39 1212.74 29.57 10.82 91.11 12.52 7.55
33 0.12 55.83 64.81 29,733.01 1215.29 27.67 12.38 87.62 12.87 7.44
34 0.25 76.25 59.25 28,500.00 1075.00 34.75 4.75 82.00 12.45 8.12
35 0.12 70.30 58.91 25,792.08 885.64 33.66 2.48 91.09 15.60 7.21
36 0.07 52.70 70.83 28,137.26 1054.90 31.13 1.96 90.44 13.89 8.28
37 1.24 53.22 65.84 26,584.16 1109.16 28.47 1.24 84.41 12.20 8.26
38 0.26 32.65 15.31 7882.65 193.88 6.63 5.61 34.18 8.78 8.02
39 0.12 57.52 62.86 28,058.25 772.09 32.04 12.38 102.91 22.44 8.25
40 0.18 54.75 34.50 21,902.50 521.00 31.25 25.00 76.50 17.17 8.13
41 0.13 59.85 36.11 24,853.54 599.24 30.81 16.92 93.94 15.57 8.18
42 0.17 61.88 61.63 32,846.54 661.88 32.43 14.60 93.56 25.91 8.19
43 0.12 67.57 27.97 26,782.18 445.30 28.47 18.32 100.74 5.17 8.25
44 0.22 65.93 45.34 24,102.94 379.17 25.98 34.56 80.64 9.44 8.13
45 0.12 70.39 48.30 29,223.30 706.55 32.28 16.02 71.60 10.60 8.51
46 0.15 66.50 49.25 24,990.00 711.75 34.50 2.25 74.75 11.38 8.40
47 0.18 58.75 49.75 27,675.00 779.25 33.75 7.50 74.50 9.60 8.37
48 0.15 53.75 34.50 25,950.00 635.75 26.50 16.75 87.75 6.25 7.83
49 0.12 59.90 43.81 28,267.33 699.51 30.45 14.60 91.34 10.35 7.74
50 0.27 52.21 32.35 24,470.59 540.44 25.49 13.24 108.09 10.04 8.41
51 0.12 46.12 32.77 24,514.56 478.40 23.30 18.69 72.57 8.44 7.62
52 0.19 49.52 24.29 24,261.91 305.71 24.29 25.48 66.67 4.50 8.48
53 0.12 39.11 18.56 19,608.91 307.92 19.06 18.07 54.70 2.27 8.34
54 0.20 49.25 27.50 23,455.00 309.50 22.75 16.25 77.75 3.99 8.09
55 0.12 55.69 36.63 24,950.50 324.75 28.47 28.71 74.51 6.86 7.92
56 0.13 50.50 29.00 23,627.50 452.75 24.25 28.25 81.25 6.34 8.33
57 0.19 44.18 48.06 20,179.61 231.80 21.60 25.00 74.03 10.88 8.22
58 0.10 33.65 18.27 14,887.02 260.34 15.87 22.12 56.49 4.94 7.94
59 0.10 26.21 21.36 16,844.66 513.84 13.35 16.02 77.67 7.90 7.91
60 0.17 61.63 38.37 26,287.13 163.61 16.58 40.84 44.06 0.90 9.15
61 0.05 52.21 67.89 28,750.00 1061.77 28.68 14.22 85.05 10.59 8.35

Note: Cd, cadmium; Cr, chromium; Cu, copper; Fe, ferrum; Mn, manganese; Ni, nickel; Pb, plumbum; Zn, zinc; As, arsenic. The abbreviations are the same in the following tables and figures.

2.3 Analysis of HM sources

2.3.1 Multivariate statistical analysis

In this study, correlation analysis was used to determine the significance of HMs, and EFA was used to preliminarily classify HMs, both of which were performed using SPSS v.23.0 software. The specific criteria for the two methods are set out in Table 1.
Table 1 Classification of correlation coefficient and exploratory factor analysis
Strength of correlation Range Type of exploratory factor analysis indicator Range Result of exploratory factor analysis
No or very weak r<0.2 KMO value KMO<0.6 Unsuitable
Weak 0.2≤r<0.4 0.6≤KMO<0.7 Feasible
Moderate 0.4≤r<0.6 0.7≤KMO<0.8 Moderately suitable
Strong 0.6≤r<0.8 KMO≥0.8 Highly suitable
Very strong r≥0.8 Bartlett test P≥0.050 No
P<0.050 Yes

Note: r is correlation coefficient; P is used to determine whether a hypothesis test is statistically significant; KMO, Kaiser-Meyer-Olkin.

2.3.2 PMF model

To better identify the sources of HMs in the mining area and surrounding soils, we used PMF source analysis model to quantitatively analyze the sources of nine HM elements. PMF, a model based on positive definite matrix factorization, was developed by the US EPA for analyzing the sources and contributions of pollutants in complex environmental media and is now widely used in the source analysis of other environmental media, such as soil and water (US EPA, 2015; Yang et al., 2023). This method does not require the determination of complex source compositional profiles and is simple to operate (Guan et al., 2018). The basic formulae are expressed in Equations 1 and 2.
$x_{i j}=\sum_{k=1}^{p} g_{i k} f_{k j}+e_{i j},$
$Q=\sum_{i=1}^{n} \sum_{j=1}^{m}\left[\frac{x_{i j}-\sum_{k=1}^{p} g_{i k} f_{k j}}{u_{i j}}\right],$
where xij is the concentration of the jth HM measured in the ith sample (mg/kg); gik is the concentration of the kth factor contributing to the ith sample (mg/kg); fkj is the contribution of the jth element in the kth factor; eij is the residual of the jth HM in the ith sample; Q is the weighted sum of squared residuals; n is the number of samples; m is the number of HM species; p is the number of factors contributing to the HM content at the sampling point; and uij is the uncertainty of the jth element in the ith sample.
The uncertainty directly affects the calculated weights of the sample contaminant mass concentration and component concentration data in the input PMF model (Norris et al., 2014), which is calculated using Equations 3 and 4.
$u_{i j}=\frac{5}{6} \times \mathrm{MDL}, x_{i j} \leq \mathrm{MDL},$
$u_{i j}=\sqrt{\left(\delta \times x_{i j}\right)^{2}+(0.5 \times \mathrm{MDL})^{2}}, x_{i j}>\mathrm{MDL}$
where uij is the uncertainty of the jth HM in the ith sample; xij is the concentration of the jth HM measured in the ith sample; MDL is the method detection limit; and δ is the error factor of the test method. When xij≤MDL, Equation 3 was used; and when xij>MDL, Equation 4 was used. The error coefficients generally ranged from 0.1 to 0.6. Relatively large error coefficients were used for the unstable mass concentration of the pollutant, the mass concentration of the component, or when the value was close to the detection limit. When the pollutant mass concentration or component mass concentration data are missing, a larger error factor can be set (Norris et al., 2014). In this study, the measured mass concentrations of HM were relatively stable; therefore, the error factor was set to 0.1. The MDLs for the nine HMs are shown in Table 2.
Table 2 Method detection limit (MDL) for the nine heavy metals (HMs)
Type Cd Cr Cu Fe Mn Ni Pb Zn As
(mg/kg)
MDL 0.01 0.05 0.20 1.50 0.05 0.15 0.10 0.10 0.50

Note: Cd, cadmium; Cr, chromium; Cu, copper; Fe, ferrum; Mn, manganese; Ni, nickel; Pb, plumbum; Zn, zinc; As, arsenic.

Data processing was performed using the EPA PMF v.5.0 software. The signal-to-noise (S/N) ratios for all elements in the model ranged from 8.3 to 9.0. The number of factors is a key parameter in PMF modeling when seeking the optimal solution, but there is no direct algorithm for this in PMF modeling (Norris et al., 2014). The number of factors for the PMF of this study was determined to be a count of four factors (Karakas et al., 2017; Zhang et al., 2024a). When the number of factors was 4, the number of model runs was 20, with a seed number of 8. In addition, 77.00% of the HM elements had residuals exceeding 54.00%, and 84.00% of the HM elements had residuals ranging from -3 to 3. The results of the factor selection were tested using the bootstrap (BS) and displacement (DISP) methods in the PMF model. In the BS test, the mapping exceeded 80.00%, indicating that the uncertainty in the BS could be explained and that the number of factors may be appropriate. In DISP, the absence of factor swapping for the minimum variation of Q in the model indicates excellent robustness of the results.

2.4 Pollution index assessment

In this study, the NIPI, Igeo, and EF were employed to assess the pollution caused by HMs in the coal mining area. The classification criteria for NIPI, Igeo, and EF are shown in Table 3.
Table 3 Nemerow integrated pollution index (NIPI), geoaccumulation index (Igeo), and enrichment factor (EF) classification criteria
NIPI criteria Range Igeo criteria Range EF criteria Range
Clean (safe) NIPI<0.7 No pollution Igeo<0.0 No enrichment EF≤1
Still clean (cautionary) 0.7≤NIPI<1.0 No pollution-medium pollution 0.0≤Igeo<1.0 Slight enrichment 1<EF≤2
Mildly contaminated 1.0≤NIPI<2.0 Medium pollution 1.0≤Igeo<2.0 Moderate enrichment 2<EF≤5
Moderately contaminated 2.0≤NIPI<3.0 Medium pollution-strong pollution 2.0≤Igeo<3.0 Significant enrichment 5<EF≤20
Heavily contaminated NIPI≥3.0 Strong pollution 3.0≤Igeo<4.0 Strong enrichment 20<EF≤40
Strong pollution-very strong pollution 4.0≤Igeo<5.0 Very strong enrichment EF40
Very strong pollution Igeo≥5.0
NIPI (Eq. 5) (Nemerow, 1974; Liu et al., 2021) was calculated using the one-factor pollution index (PI) method (Hakanson, 1980) (Eq. 6), which highlights the role of the relatively contaminated HM pollutants.
$P_{N}=\sqrt{\frac{\overline{P_{i}^{2}}+P_{\max }^{2}}{2}},$
$\mathrm{PI}=\frac{C_{i}}{B_{i}},$
$B_{i}=\frac{1}{n} \sum_{1}^{n} x_{i},$
where PN is the Nemerow integrated pollution index; Pi is the average value of the single-factor pollution index of HM element i; Pmax is the maximum value of the single-factor pollution index of HM element i; Ci is the measured value of HM element i (mg/kg); Bi is the environmental background value of soil HMs maximum allowable change in Q (mg/kg); and xi is the concentration of HM background value reference point (mg/kg).
Geoaccumulation index (Igeo) was used to quantitatively evaluate the degree of HM contamination in the sediment species (Müller and Förstner, 1976), which reflects the natural variation characteristics of elements and is an important parameter for discerning the impact of anthropogenic activities (Eq. 8).
$\mathrm{I}_{\mathrm{geo}}=\log _{2} \frac{C_{i}}{k B_{i}}$
where k is the correction coefficient, generally considered to be 1.5 (Bourliva et al., 2018).
The enrichment factor (EF) (Eq. 9) was initially employed to assess the degree of HM enrichment in sediments, which is an important indicator for quantitatively evaluating the degree of enrichment of pollutants through the degree of enrichment of metal elements in environmental media, and determine whether the metal elements in the environment belong to natural or anthropogenic sources (Zoller et al., 1974; Li et al., 2017).
$\mathrm{EF}=\frac{\left(C_{i} / C_{r}\right)_{\text {samples }}}{\left(C_{i} / C_{r}\right)_{\text {background }}},$
where Cr is the concentration of the selected reference element (mg/kg). This method usually selects elements that are relatively stable and less affected by human activities (such as Fe, Mn, and Al) as reference elements (Liu et al., 2010; Chen et al., 2016; Napoletano et al., 2023), and in this study, Fe was taken as the reference element.

2.5 Potential ecological risk assessment model

We used potential ecological risk index (Er) method proposed by Hakanson (1980) to assess HMP risks, which is based on the toxic response of the element in the environment (Hakanson, 1980), and calculated using Equation 10.
$\mathrm{RI}=\sum_{i=1}^{n} E_{r}^{i}=\sum_{i=1}^{n} T_{r}^{i} \times P_{i}$
where RI is the integrated potential ecological risk index; Ei r is the potential ecological risk index of the ith HM; and Ti r is the toxicity coefficient of the HMs, which indicates the toxicity response coefficients of each HM to the organisms. The corresponding values of toxicity coefficient for the nine HMs were as follows: Cd=30, As=10, Cu=Pb=Ni=5, Cr=2, and Zn=Mn=Fe=1 (Xu et al., 2008; Mei et al., 2023). The classification criteria for RI and Ei r are shown in Table 4.
Table 4 Integrated potential ecological hazard index (RI) and potential ecological risk index of the ith HM (Ei r) classification criteria
Criteria RI range Ei r range
Low risk RI<150 Ei r<40
Moderate risk 150≤RI<300 40≤Ei r<80
Elevated risk 300≤RI<600 80≤Ei r<160
High risk RI≥600 160≤Ei r<320
Very high risk - Ei r320

Note: "-" indicates no detailed RI range.

2.6 HRA model

The HRA model developed by the US EPA was used to explore the carcinogenic risk (CR) and non-carcinogenic risk (NCR) of HMs on humans through three exposure pathways (US EPA, 2013), namely direct ingestion, dermal exposure, and oral and nasal inhalation of suspended soil particles. The average daily intake of HMs for the three exposure routes was calculated using Equations 11-13.
$\mathrm{ADE}_{\text {ing }}=C_{S} \times \frac{R_{\text {ing }} \times \mathrm{EF}^{\prime} \times \mathrm{ED} \times 10^{-6}}{\mathrm{BW} \times \mathrm{AT}},$
$\mathrm{ADE}_{\mathrm{inh}}=C_{S} \times \frac{R_{\mathrm{inh}} \times \mathrm{EF}^{\prime} \times \mathrm{ED}}{\mathrm{PEF} \times \mathrm{BW} \times \mathrm{AT}},$
$\mathrm{ADE}_{\text {der }}=C_{S} \times \frac{\mathrm{AF} \times \mathrm{SA} \times \mathrm{ABS} \times \mathrm{EF}^{\prime} \times \mathrm{ED} \times 10^{-6}}{\mathrm{BW} \times \mathrm{AT}},$
where ADEing, ADEinh, and ADEder are the average daily exposures to HMs via direct ingestion, inhalation, and dermal exposure, respectively; CS is the soil HM concentration; Ring is the ingestion rate (mg/d); EF' is the exposure frequency (d/a); ED is the exposure duration (a); BW is the body weight (kg); AT is the average time of exposure (d); Rinh is the inhalation rate (m3/d); PEF is the particulate emission factor (m3/kg); AF is the adherence factor (mg/cm2); SA is the skin surface area (cm2); and ABS is the absorption factor. The detailed values of those above parameters for adults and children are presented in Table S2. NCR and CR indices were calculated using Equations 14-17.
$\mathrm{NCR}_{i}=\sum \frac{\mathrm{ADE}_{i}}{R f D_{i}},$
$\mathrm{CR}_{i}=\sum\left(\mathrm{ADE}_{i} \times \mathrm{SF}\right),$
$\mathrm{TNCR}=\sum \mathrm{NCR}_{i}=\sum\left(\mathrm{NCR}_{\text {ing }}+\mathrm{NCR}_{\text {inh }}+\mathrm{NCR}_{\text {der }}\right),$
$\mathrm{TCR}=\sum \mathrm{CR}_{i}=\sum\left(\mathrm{CR}_{\mathrm{ing}}+\mathrm{CR}_{\mathrm{inh}}+\mathrm{CR}_{\mathrm{der}}\right),$
Table S2 Health risk assessment model parameters
Parameter Unit Adults Children Reference
Ring (ingestion) mg/d 100 200 Liu et al. (2023)
Rinh (inhalation rate) m3/d 14.5 7.5
EF' (exposure frequency) d/a 350
BW (body weight) kg 56.8 15.9
ED (exposure duration) a 24 6
AT (averaging time) (non-carcinogenic) d 8760 2190 Liu et al. (2023)
AT (averaging time) (carcinogenic) 25,550
PEF (particulate emission factor) m3/kg 1.36×10⁹ Liu et al. (2023)
Zhou et al. (2024)
AF (adherence factor) mg/cm2 0.07 0.2
SA (skin surface area) cm2 5075 2448
ABS (absorption factor) 0.001 Yang et al. (2019);
Wu et al. (2023)
Zhou et al. (2024)
ABS (absorption factor) (As) 0.030

Note: The abbreviations are the same in the following figures.

where NCRi is the NCR index of the ith HM; RfDi is the daily reference dose (mg/(kg•d)); ADEi is the average daily exposures to the ith HM (mg/(kg•d)); CRi is the CR index of the ith HM; SF is the carcinogenicity slope factor ((kg•d)/mg); TNCR is the total NCR; NCRing, NCRinh, and NCRder are the direct ingestion, inhalation, and dermal exposure of NCRi, respectively; TCR is the total CR; and CRing, CRinh, and CRder are the direct ingestion, inhalation, and dermal exposure of CRi, respectively. The values of RfDi and SF are presented in Table S3. NCR>1.00 indicates the presence of non-carcinogenic health risks. CR is quantitatively evaluated by the following three criteria, i.e., negligible risk (CR<1.00×10⁻⁶), acceptable risk (1.00×10⁻⁶≤CR<1.00×10⁻⁴), and significant carcinogenic risk (CR≥1.00×10⁻⁴) (Li et al., 2023). Based on HRA, we conducted Monte Carlo simulation using Crystal Ball v.3.0 software. The dataset underwent 10,000 iterations at a 95.00% confidence level to derive stable results, enabling us to characterize the single-factor contamination risk and the probability of composite contamination risk for the study area (Liu et al., 2023). Additionally, through the PMF model, we quantified CR and NCR posed by each source to both adults and children (Shen et al., 2024; Zhao et al., 2024).
Table S3 Daily reference doses (RfD) and carcinogenicity slope factor (SF) for heavy metals (HMs)
Element RfD SF Reference
Ring
(mg/d)
Rinh
(m3/d)
Dermal
(mg/cm2)
Ring
Rinh Dermal
Cd 1.00×10‒3 1.00×10‒5 1.00×10‒5 6.10×100 6.30×100 2.00×101 Yang et al. (2019)
Cr 3.00×10‒3 2.86×10‒5 6.00×10‒5 5.00×10‒1 4.20×101 2.00×101 Liu et al. (2023)
Cu 4.00×10‒2 4.02×10‒2 1.20×10‒2 - - - Liu et al. (2023)
Mn 4.60×10‒2 - 1.84×10‒3 - - - Liu et al. (2023)
Ni 2.00×10‒2 9.00×10‒5 5.40×10‒3 1.70×100 8.40×10‒1 4.25×101 Liu et al. (2023)
Pb 3.50×10‒3 3.52×10‒3 5.25×10‒4 8.50×10‒3 4.20×10‒2 - Zhou et al. (2024)
Zn 3.00×10‒1 3.00×10‒1 6.00×10‒2 - - - Zhou et al. (2024)
As 3.00×10‒4 1.23×10‒4 1.23×10‒4 1.50×100 1.51×101 3.66×100 Zhou et al. (2024)

Note: "-" indicates no value.

2.7 Data processing

In this study, data were organized using Excel v.2016 software. Spatial analysis of the study area was carried out using ArcGIS v.10.8 software. Spatial concentrations of HMs, degree of spatial contribution of different sources, and RI index were analyzed using spatial inverse distance weighting method. Exploratory factor analysis and correlation analysis of the data were carried out using SPSS v.23.0 software. The sources of HMs were calculated using EPA PMF v.5.0 software, Monte Carlo simulation was performed using Crystal Ball v.3.0 software, and graphs were created using Origin v.2022 software.

3 Results

3.1 HM concentration and spatial distribution

3.1.1 HM concentration

Soil pH value in the study area was within the range of 7.05-9.15, and statistical results of HM concentration are presented in Table 5. The maximum concentrations of Cd, Cu, Ni, Pb, and As were below the background value of China. The maximum value of Cr was 1.84 times that of industrial areas of China. Except for Cr, Fe, and Ni, the average and median values of HMs in the study area were higher than the local background values. The mean values of all HMs were 1.38 (Cd), 1.26 (Cr), 1.32 (Cu), 0.88 (Fe), 1.15 (Mn), 0.84 (Ni), 1.58 (Pb), 1.00 (Zn), and 1.05 (As) times the local background value, respectively. The median values of all HMs were 1.00 (Cd), 0.77 (Cr), 1.23 (Cu), 0.88 (Fe), 1.14 (Mn), 0.85 (Ni), 1.48 (Pb), 1.01 (Zn), and 1.00 (As) times the local background value, respectively. And the coefficient of variation (CV) values of Cd and Pb were 90.40% and 67.54%, respectively, both exceeding 50.00%. The background values used in this study were calculated from the average of three background soil samples taken from the vicinity of the Alagou Reservoir, which is considerably far from the mining area (Table S4). No significant human activity was identified in the vicinity, and the ecological environment was remarkable.
Table 5 Soil HM concentration in the study area
Item Cd Cr Cu Fe Mn Ni Pb Zn As
(mg/kg)
Maximum 1.24 183.89 123.25 46,177.88 2208.25 79.81 40.84 171.81 25.91
Minimum 0.05 26.21 15.31 7882.65 163.61 6.63 0.72 34.18 0.90
Mean 0.18 58.32 45.67 26,876.42 752.60 26.99 13.17 89.02 11.06
Median 0.13 56.86 43.81 27,019.23 749.25 27.18 12.38 89.75 10.61
SD 0.16 19.34 17.89 5746.04 337.03 8.91 8.89 21.83 4.78
SE 0.02 2.48 2.29 735.70 43.15 1.14 1.14 2.79 0.61
CV (%) 90.40 33.17 39.18 21.45 44.78 33.03 67.54 24.52 43.20
Kurtosis 29.70 29.92 4.99 3.24 4.47 20.44 0.56 2.73 0.81
Skewness 4.97 4.52 1.48 -0.32 1.16 3.19 0.84 0.61 0.52
Local background value 0.13 73.65 34.51 30,650.63 654.79 32.12 8.34 88.86 10.58
Xinjiang background valuea 0.12 49.30 26.70 27,800.00 666.00 26.60 19.40 68.80 11.20
Chinese soil criteria (Grade 2)b 65.00 - 18,000.00 - - 900.00 800.00 - 60.00
Industrial areas of Chinac 23.77 100.19 - - - - 707.16 - 155.78

Note: a, the data are referenced from the geochemical background value of HM in Xinjang Uygur Autonomous Region (CEMS, 1990); b, the data are referenced from the soil environmental quality standard (MEE, 2018b); c, the data are referenced from the HM concentration of industrial regions in China (Zhao et al., 2019). "-" indicates no value.

Table S4 Three HM concentrations in soil samples from the vicinity of the Alagou reservoir
Sample Longitude Latitude Cd Cr Cu Fe Mn Ni Pb Zn As
(mg/kg)
A 87°50′35″E 42°49′27″N 0.12 78.43 32.11 31,838.24 679.90 32.84 12.99 88.24 8.92
B 87°32′15″E 42°51′39″N 0.12 77.48 28.71 34,603.96 574.75 32.92 6.68 85.40 8.02
C 87°38′28″E 42°50′28″N 0.14 65.05 42.72 25,509.71 709.71 30.58 5.34 92.96 14.81
Mean 0.13 73.65 34.51 30,650.63 654.79 32.12 8.34 88.86 10.58

3.1.2 Spatial distribution characteristics of HMs

Spatial distribution results showed that the concentration of Pb was higher in the mining area, while those of the other eight HMs were lower (Fig. 2). The high concentration of Pb in the mining area may be related to mining and industrial transportation in the mining area. Cd exhibited a high distribution in eastern human gathering area of the mine area. Therefore, the high value of Cd was initially thought to be related to human beings. Distributions of Cr, Cu, and Ni in the study area were generally consistent, with elevated concentrations observed in northeastern part outside the mining area and west of eastern human settlement zone. Fe, Mn, Zn, and As all exhibited low concentrations within the mining area. However, Mn showed higher concentrations in northeastern part outside the mining area and relatively elevated levels in the east of Tonggou Village. Zn and As demonstrated higher concentrations in southern part outside the mining area, where the high concentration of As was located at the foot of mountains, while the area with high concentration of Zn was adjacent to roads. Fe displayed elevated concentrations in both northeastern and southern parts outside the mining area. High concentration distribution areas of Mn and Fe were characterized by favorable ecological environments. High concentration distribution areas of As were situated away from roads. Elevated Zn concentrations were likely associated with road transportation activities.
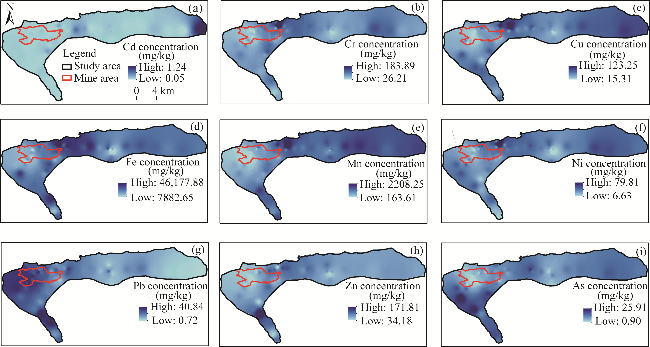
Fig. 2 Spatial distribution of concentrations of nine HMs. (a), Cd (cadmium); (b), Cr (chromium); (c), Cu (copper); (d), Fe (ferrum); (e), Mn (manganese); (f), Ni (nickel); (g), Pb (plumbum); (h), Zn (zinc); (i), As (arsenic).

3.2 HM source analysis

3.2.1 Multivariate statistical analysis

KMO (Kaiser-Meyer-Olkin) and Bartlett's tests were performed on the data to determine whether the main EFA analysis could be performed preliminarily. The results showed that EFA analysis was suitable (KMO=0.7; P<0.001). As shown in Figure 3a, three principal components (PCs) with eigenvalues greater than 1.0 were retained, of which the main representative elements of PC1 were Cr, Ni, and Fe, with a variance explanation rate of 33.13%. The main representative elements of PC2 were Cu, Mn, Zn, and As, with a variance explanation rate of 26.17%. The main representative elements of PC3 were Cd and Pb, with a variance explanation rate of 14.21%. The rotated cumulative variance explanation rate was 73.52%.
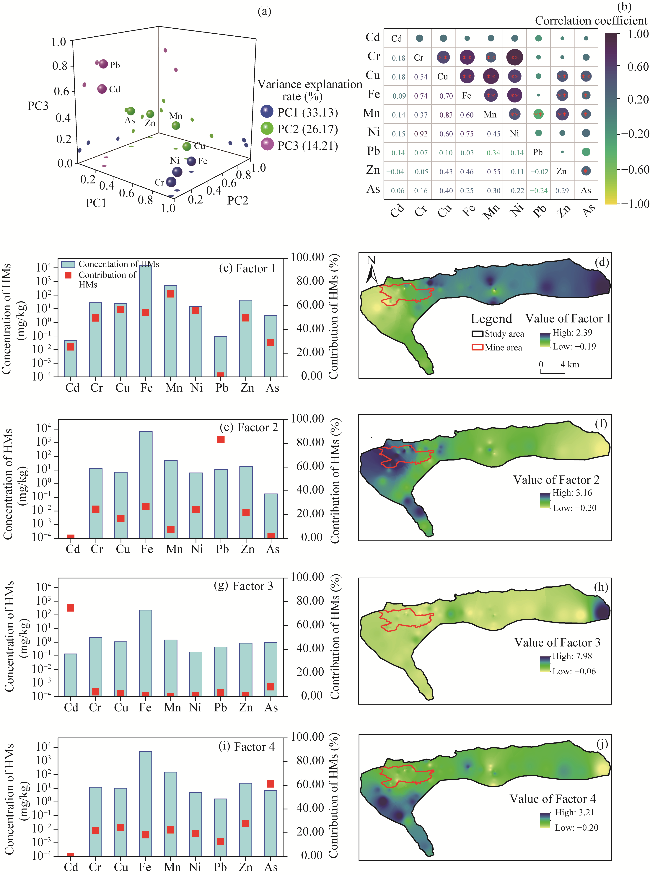
Fig. 3 Multivariate statistical analysis and PMF (positive matrix factorization) model analysis results of nine HMs (heavy metals.) (a), EFA (exploratory factor analysis); (b), correlation analysis between HMs; (c), contributions of nine HMs to Factor 1; (d), spatial contribution distribution of Factor 1; (e), contributions of nine HMs to Factor 2; (f), spatial contribution distribution of Factor 2; (g), contributions of nine HMs to Factor 3; (h), spatial contribution distribution of Factor 3; (i), contributions of nine HMs to Factor 4; (j), spatial contribution distribution of Factor 4. *, P<0.050 level; **, P<0.010 level.
The results of correlation analysis are presented in Figure 3b. Correlation coefficient between Cr and Ni was 0.92, indicating a very strong correlation, while Cr and Fe showed a strong correlation with a coefficient of 0.74. Correlation coefficient between Cr and Ni was 0.92. Correlation between Cr and Cu was moderate, with a coefficient of 0.54. Cu exhibited a very strong correlation with Mn (0.83) and strong correlations with Fe (0.70) and Ni (0.60), respectively. Fe demonstrated strong correlations with Mn (0.60) and Ni (0.75). Cd and Pb showed no significant correlations with the other HMs. Notably, Pb displayed negative correlations with all eight other HMs, and Cd also exhibited a negative correlation with Zn.

3.2.2 PMF model analysis

Based on PMF model parameters and ArcGIS v.10.8 software, we obtained the contribution of each factor (Fig. 3c-j). Factor 1 was the greatest contributor, accounting for 43.46% of all HM concentrations. The main loading elements of Factor 1 exhibited contributions of 49.66%, 56.71%, 54.28%, 69.95%, 55.89%, and 49.71% for Cr, Cu, Fe, Mn, Ni, and Zn, respectively. And those main loading elements mainly enriched in eastern part of the study area and in northeastern part of mining area (Fig. 3c and d). Factor 2 accounted for 22.87% of all HM concentrations, and Factor 4 accounted for 23.03%. The main loading element of Factor 2 was Pb, contributing 83.14%, which was mainly enriched within the mining area and near southern roads in the study area (Fig. 3e and f). And the main loading element of Factor 4 was As, which contributed 61.16% and was mainly enriched at the foot of southern mountains outside the mining area (Fig. 3i and j). Factor 3 accounted for 10.64% of all HM concentrations, with its main loading element being Cd. Cd accounted for 74.75% of its own variance and was primarily enriched in southern human settlement zone of the study area (Fig. 3g and h).

3.3 Pollution index assessment

In this study, the NIPI, Igeo, and EF indices were used to analyze the pollution levels of soil HMs in the mining area (Fig. 4). The NIPI index showed (Fig. 4a) that Cd and Pb were heavily polluted, and the index value of Cd was 6.86, which was considerably higher than those of the other HMs. The NIPI value of Pb was 3.64. Cu (2.70) and Mn (2.52) were moderately polluted, whereas Cr (1.85), Fe (1.23), Ni (1.85), Zn (1.54), and As (1.88) were slightly polluted. Average Igeo (Fig. 4b) values of the indices of all HMs was below 0, but 36.00% of that of Pb ranged from 0 to 1, indicating no pollution to moderate pollution, and 11.50% of the sampling sites ranged from 1 to 2, indicating moderate pollution. For Cd, 24.59% of values were in a polluted level; for Cu, 26.23%; and for Mn, 22.95%. Average value of the index of all HMs was below 0. EF index was calculated for the degree of enrichment of the other eight HMs, with Fe as the reference element. The enrichment results showed (Fig. 4c) that Cr and Ni were mainly non-enriched and Cd, Cu, Mn, Zn, and As were mainly slightly enriched. There was an evident moderate enrichment of Cd, Cu, Pb, and As, and there were individual significantly enriched sites of Cd and Pb.
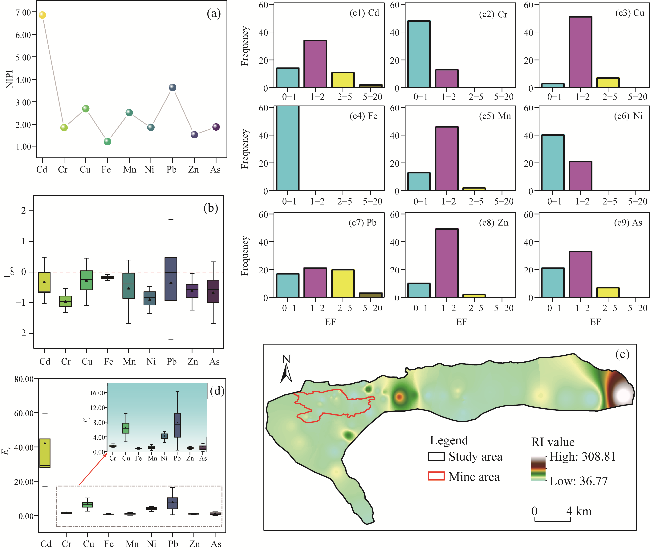
Fig. 4 Pollution index assessment results. (a), NIPI (Nemerow integrated pollution index); (b), Igeo (geoaccumulation index); (c1-c9), EF (enrichment factor); (d), Er (potential ecological risk index); (e), RI (integrated potential ecological risk index). In Figure 4b and d, boxes indicate the IQR (interquartile range, 75th to 25th of the data). The median value is shown as a line within the box. Black triangle is shown as mean. Whiskers extend to the most extreme value within 1.5×IQR.

3.4 Potential ecological risk assessment

Average value of the potential ecological risk index (Er) of HMs in the mining area and surrounding soils is shown in Figure 4d. Er showed that Cd was 42.20, indicating the medium risk. About 37.70% of Cd sampling sites exceeded 40.00, with a maximum value of 287.82, which was considered as high risk. Er values for other HMs were as follows: 0.87 (Fe), 1.00 (Zn), 1.15 (Mn), 1.29 (As), 1.58 (Cr), 4.19 (Ni), 6.61 (Cu), and 7.89 (Pb), which were low risk. RI around mining area was 66.81, indicating a safe and low-risk state. RI in eastern part of mining area was more than 150.00, indicating a medium ecological risk, and that in easternmost part exceeded 300.00, indicating a high ecological risk (Fig. 4e).

3.5 Health risk assessment

3.5.1 Conventional health risk assessment

We examined CR and NCR of HMs in adults and children via three pathways (ingestion, inhalation, and dermal contact) using a simple HRA model. Table 6 displays the result. The order of the three routes of risk were as follows: ingestion>inhalation>dermal contact. For NCR, the risk levels of HMs followed the order: Cd>As>Pb>Cr>Ni>Cu>Mn>Zn. Total NCR value of Cd for adults was 4.39, exceeding 1.00. For children, NCR values of Cd (3.11), Pb (1.66), and As (3.17), all exceeding 1.00. For CR, the risk levels of HMs were ranked as Cd>Ni>As>Cr>Pb. For adults, the values of Cd (9.09×10⁻³) and Ni (2.52×10⁻⁴), and for children, the values of Cd (1.62×10⁻²), Ni (4.50×10⁻⁴), and As (1.22×10⁻⁴) all exceeded 1.00×10‒4. Overall, Cd posed the highest risk among HMs, and the route of ingestion contributed to a significantly higher risk than inhalation and dermal contact.
Table 6 Conventional health risk assessment result
Group HMs NCR CR
NCRing NCRinh NCRder TNCR CRing CRinh CRder TCR
Adults Cd 4.35×100 4.63×10‒2 3.04×10‒4 4.39×100 9.09×10‒3 1.00×10‒6 2.09×10‒8 9.09×10‒3
Cr 5.44×10‒2 6.08×10‒4 1.90×10‒6 5.50×10‒2 2.80×10‒5 2.50×10‒7 7.83×10‒10 2.82×10‒5
Cu 1.70×10‒2 1.81×10‒6 3.97×10‒8 1.70×10‒2 - - - -
Mn 2.57×10‒3 - 4.50×10‒8 2.57×10‒3 - - - -
Ni 2.16×10‒2 5.12×10‒4 5.60×10‒8 2.21×10‒2 2.52×10‒4 1.33×10‒8 4.41×10‒9 2.52×10‒4
Pb 2.32×10‒1 2.46×10‒5 1.08×10‒6 2.32×10‒1 2.37×10‒6 1.25×10‒9 - 2.37×10‒6
Zn 3.44×10‒4 3.67×10‒8 1.20×10‒9 3.44×10‒4 - - - -
As 4.44×10‒1 1.16×10‒4 2.28×10‒5 4.44×10‒1 6.85×10‒5 7.36×10‒8 3.51×10‒9 6.86×10‒5
Children Cd 3.10×101 8.56×10‒2 3.10×10‒3 3.11×101 1.62×10‒2 4.62×10‒7 5.32×10‒8 1.62×10‒2
Cr 3.88×10‒1 1.12×10‒3 1.94×10‒5 3.90×10‒1 4.99×10‒5 1.16×10‒7 2.00×10‒9 5.01×10‒5
Cu 1.22×10‒1 3.34×10‒6 4.06×10‒7 1.22×10‒1 - - - -
Mn 1.84×10‒2 - 4.60×10‒7 1.84×10‒2 - - - -
Ni 1.54×10‒1 9.46×10‒4 5.72×10‒7 1.55×10‒1 4.50×10‒4 6.13×10‒9 1.13×10‒8 4.50×10‒4
Pb 1.66×100 4.55×10‒5 1.11×10‒5 1.66×100 4.23×10‒6 5.77×10‒10 - 4.23×10‒6
Zn 2.46×10‒3 6.77×10‒8 1.23×10‒8 2.46×10‒3 - - - -
As 3.17×100 2.13×10‒4 2.32×10‒4 3.17×100 1.22×10‒4 3.40×10‒8 8.96×10‒9 1.22×10‒4

Note: NCR, non-carcinogenic risk; CR, carcinogenic risk; NCRing, NCRinh, and NCRder are direct ingestion, inhalation, and dermal exposure of NCR, respectively; CRing, CRinh, and CRder are direct ingestion, inhalation, and dermal exposure of CR, respectively; TCR, total CR. "-" indicates no value.

3.5.2 Health risk assessment based on Monte Carlo simulation

Distribution characteristics of HMs and indices in the HRA are displayed in Table S5. As indicated by NCR (Fig. 5a) and CR (Fig. 5b), and single NCR and CR of each HM (Figs. S1 and S2; Table 6), the probability results based on Monte Carlo simulation were lower than the conventional risk assessment results. NCR for each HM was <1.00, total NCR to adults was <1.00, and total NCR to children exhibited a 4.00% probability of >1.00. CR values of Cd, Cr, Ni, Pb, and As were <1.00×10⁻⁴, and CR value of Pb was <1.00×10⁻⁶, which can be completely disregarded. Total CR value to adults was <1.00×10⁻⁴, which was within the acceptable range. Total CR to children had an 88.00% probability in the acceptable range, and 12.00% probability in the unacceptable range cannot be disregarded. This result was due to the fact that the parameters of evaluation for children were more sensitive than those for adults, and children's physiological characteristics and behavioral habits differed from those of adults. Children are more likely to ingest pollutants through hand-to-mouth contact, with relatively higher HM intake per unit body weight due to physiological factors such as body weight and surface area. However, adults primarily absorb pollutants through inhalation and ingestion. Additionally, children have immature immune systems and less developed metabolic functions, making them more vulnerable to higher health risks than adults.
Table S5 Distribution pattern of each parameter in Monte Carlo simulation
Element Unit Distribution Reference
Adults Children
Cd mg/kg Triangular (0.05, 0.12, 1.24) This study
Cr mg/kg Triangular (26.21, 55.8, 183.89)
Cu mg/kg Normal (45.67±17.89)
Mn mg/kg Normal (752.60±337.03)
Ni mg/kg Triangular (6.63, 28.47, 79.81)
Pb mg/kg Normal (13.17±8.90)
Zn mg/kg Normal (89.02±21.83)
As mg/kg Normal (11.06±4.78)
Ring mg/d Triangular (4, 30, 52) Triangular (66, 103, 161) Wu et al. (2023)
Rinh m3/d Point (14.5) Point (7.5) Liu et al. (2023)
EF d/a Triangular (180, 345, 365) Triangular (180, 345, 365) Zhou et al. (2024)
ED years Point (24) Point (6) Wu et al. (2023)
BW kg Point (56.8) Point (15.9) Liu et al. (2023)
AT (Non-carcinogenic) d Point (8760) Point (2190) Liu et al. (2023)
Zhou et al. (2024)
AT (Carcinogenic) Point (25,550)
PEF m3/kg Point (1.36×10⁹) Zhou et al. (2024)
AF mg/cm2 Point (0.07) Point (0.20) Wu et al. (2023)
SA cm2 Point (5075) Point (2448) Zhou et al. (2024)
ABS Point (0.001) Wu et al. (2023)
ABS (As) Point (0.030)
Fig. 5 Results of health risk assessment based on Monte Carlo simulation and PMF model. (a), total NCR (non-carcinogenic risk) result based on Monte Carlo simulation; (b), total CR (carcinogenic risk) result based on Monte Carlo simulation; (c), total NCR result based on PMF model; (d), total CR result based on PMF model. Dashed line in Figure 5a and b indicates the mean value.
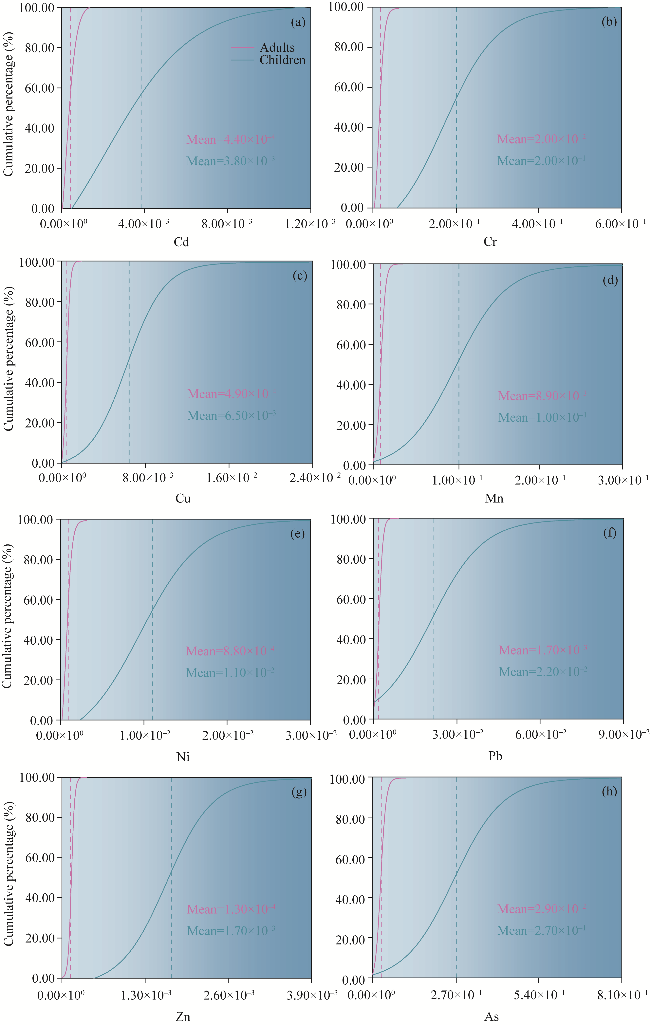
Fig. S1 NCR (non-carcinogenic risk) of eight HMs (heavy metals) based on Monte Carlo simulation. (a), Cd; (b), Cr; (c), Cu; (d), Mn; (e), Ni; (f), Pb; (g), Zn; (h), As. Dashed line indicates the mean value.
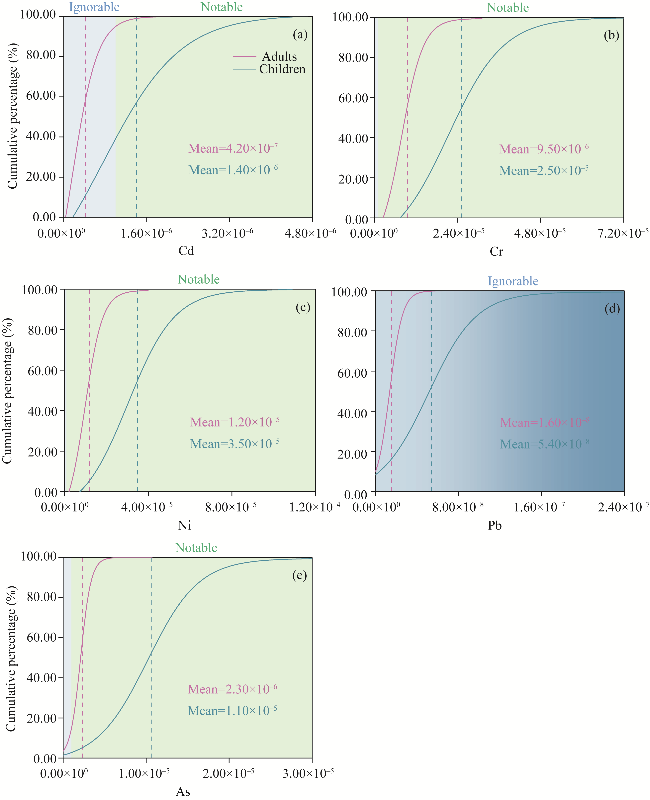
Fig. S2 CR (carcinogenic risk) of five HMs based on Monte Carlo simulation. (a), Cd; (b), Cr; (c), Ni; (d), Pb; (e), As. Dashed line indicates the mean value.

3.5.3 Health risk assessment based on PMF model

We developed a Sankey diagram of the risk to humans based on PMF model (Fig. 5c and 5d). In Factor 1, Mn accounted for the highest proportion (20.76%) among HMs. In Factor 2, Pb accounted for the largest proportion (46.42%). In Factor 3, Cd accounted for the greatest proportion (78.77%). Lastly, in Factor 4, As accounted for the largest proportion (32.34%). The degree of contribution of all four sources to NCR and CR in adults and children decreased in the following order of Factor 3>Factor 1>Factor 4>Factor 2. Contributions of NCR decreased in the following order of 64.49%>24.97%>6.24%>4.30% for adults and 64.43%>24.97%>6.28%> 4.33% for children. Contributions of CR from high to low were 72.08%>26.14%>1.03%>0.75% for adults and 72.08%>26.14%>1.03%>0.75% for children. CR results for adults and children were almost identical because Cd was the main contributing element of Factor 3, and the risk value of Cd was significantly higher than those of the other HMs.

4 Discussion

4.1 Source allocation

Based on the results of EFA and correlation analysis, EFA results classified the sources of HMP into three categories. PMF model further subdivided the pollution sources into four distinct categories. A comparison of the two analytical methods revealed the following relationships: Factor 1 explained PC1 and partially overlapped with PC2, Factors 2 and 3 collectively explained PC3, and Factor 4 accounted for the remaining variation in PC2.
The loading elements of Factor 1 (43.46%) were Cr, Cu, Fe, Mn, Ni, and Zn. The study area is surrounded by mountains on three sides and a large amount of rock is excavated during the mining process. The main sources of Cr and Ni are soil matrices and rocks (Chen et al., 2016; Liao et al., 2021; Zhang et al., 2021a, b). Fe is the second most abundant metallic element in the Earth's crust, and in this study, it showed a strong correlation with both Cr and Ni. Previous studies have shown that Mn and Cu are affected by soil formation matrices (Guan et al., 2018; Yuanan et al., 2020). As shown in Table 1, the mean and median values of the three HMs (Cr, Ni, and Fe) were lower than the background values in the study area, and the areas with high concentrations in the east were ecologically favorable. In addition, grazing is the main human activities in the study area. Cu and Zn are present in animal feeds, and the animal husbandry process generates a large amount of animal feces (Wu et al., 2010; Liang et al., 2017; Hu et al., 2018b), which naturally accumulates and spreads to the soil through short-term rainfall, resulting in the accumulation of Cu and Zn. Therefore, Factor 1 was defined as natural and livestock sources.
The loading elements for Factor 2 (22.86%) were Pb, Fe, Cr, Ni, and Zn, with Pb being the most prominent contributing element. Pb accumulation in soil originates from the use of gasoline in automobiles (Fei et al., 2019; Kong et al., 2021). Pb-containing gasoline was no longer used in China. However, Pb contamination due to historical factors had to be considered (Song et al., 2019). The abrasion of metal parts, such as automobile tires and Zn plating, also aggravates the buildup of Pb, Zn, and Fe in soil (Guan et al., 2018; Zheng et al., 2023). As shown in Figure 2, the concentration of Pb was higher in the central and western parts of the mining area. Moreover, the concentration of Pb was higher in southern part of the study area. The concentration of Pb was not high in other areas because Pb was less mobile in soil. Pb2+ has a large radius and strong polarization ability, and can easily combine with anions in soil to form insoluble compounds (Tawinteung et al., 2005). The pH results (Table S1) indicated that the soil in the study area was alkaline. Under alkaline conditions, the negative charge on the surface of clay minerals, oxides, and hydroxides in soil increased. The increase in negative charge increases the adsorption of Pb2+. Pb2+ also reacts with iron and manganese oxides and is immobilized on the surface and in the crystal lattice (Bradl, 2004). At the same time, the absence of long-term precipitation in arid areas led to a low soil moisture content, which further limited the movement of Pb. The contents of Zn and Fe were lower inside the mine. In addition to the poor soil of the mine, a local wastewater treatment station was set up inside the mine. The existence of this station made it possible to solve Fe and Zn pollution generated by the production of mine. Therefore, Factor 2 was defined as an industrial transportation source.
The main loading element of Factor 3 (10.64%) was Cd, with a small percentage of As. Industrial emissions are an important cause of soil Cd accumulation (Li et al., 2016; Yang et al., 2020). Fossil fuels, particularly coal, contain high amounts of Cd (Zhou et al., 2024). In mining area, fire suppression of coal combustion layer needs to be performed, which necessitates the burning of a large amount of coal sandwiched between soil layers. Smoke particles generated by this combustion diffuse throughout the mining area. Regular use of explosives for blasting during mining also causes Cd accumulation. Additionally, altitude of the mining area is above 2300 m, and the populated area is heated for a longer period each year than those in the plains, requiring more coal to be burned. Cd has strong mobility in soil. Ionic radius of Cd2+ was relatively small, which allowed it to move easily between the pores of soil particles. At the same time, Cd often existed in an ionic state in soil, which could be more easily exchanged with various ions in soil to form soluble complexes (Bradl, 2004). Altitude of the study area was high in the west and low in the east, and Cd in soil could easily flow to the low-lying places with the surface water formed by heavy rainfall, resulting in the accumulation of Cd in eastern part of the study area. Mining of mineral resources could result in the release of initially stabilized HMs from ores that migrate to the soil, and gradually migrated to the soil (Zhong et al., 2020). Therefore, Factor 3 was defined as fossil fuel combustion. By combining Factors 2 and 3, we generalized PC3 as an industrial source that contained both industrial transport and fossil fuel combustion.
The main loading elements of Factor 4 (23.03%) were As and Zn. Coal mine blasting and mining activities moved As to surface soil. As was blown into dry atmosphere under strong wind, blocked by southern mountains, and settled on the surface. At the same time, short-term rain erosion and summer meltwater gathering at the foot of mountain resulted in As accumulation (Luo et al., 2020; Liu et al., 2023). Accumulation of As, Zn, and the other HMs caused by the existence of populated areas in eastern part of the study area, domestic sewage, and motor vehicle exhaust produced by human activities often contain HMs, such as As and Zn (Vidu et al., 2020), and the use of chemical fertilizers in green space around residential areas caused the accumulation of these HMs. Therefore, Factor 4 was defined as atmospheric deposition and domestic pollution.

4.2 HM pollution analysis

Our study found that the maximum concentration of HMs in the study area did not exceed Chinese standard level (MEE, 2018b). The NIPI proved that Cd was the most notable HM pollutant, and the content of Cd in soil was often related to fuel combustion (Hossain Bhuiyan et al., 2021). Moreover, the three pollution indices showed that Pb was the most pollution and enrichment. Annual mining amount of the mine is 13×106 t/a (National Energy Xinjiang Toksun Energy Co., Ltd., 2022). Production of Pb in soil is often closely related to transport activities (Zhou et al., 2024), which could lead to the accumulation of Pb. High coefficient of variation of Cd and Pb also proved that human activities greatly affected the distribution of HMs in the study area. RI showed that potential risk of Cd was much higher than those of the other HMs, but Cd concentration of HMs in soil was not high compared with those of the other HMs. The primary reason behind this phenomenon is that the toxic factors of Cd were much higher than those of the other HMs.

4.3 Risk assessment

Results of HRA showed that the risk associated with ingestion route was higher than those of the other two routes in both adults and children (Table 3), which was consistent with previous studies (Qing et al., 2015; Zeng et al., 2019). Ingestion is the main way by which humans are exposed to HMs (Liu et al., 2023). The results based on Monte Carlo simulation generally reduced the likelihood of NCR and CR, improving the accuracy of the results. Monte Carlo simulation-based HRA uses a large number of samples based on different types of data, resulting in minor errors. Both NCR and CR were significantly higher in children than in adults (Figs. S1 and S2), indicating that children were more susceptible to the effects of HMs. The results of HRA model were not consistent with those of PMF model. Conventional risk assessment reflected the risk of three pathways of ingestion and ignored other pathways of possible HM exposure. HRA based on PMF model analyzed the contribution of different sources to the CR. Fossil fuel combustion sources has been identified as the most critical contributor to human health risks among the identified sources. This finding suggests that Cd should be designated as a priority control element within the mining area. Dry and windy conditions accelerate the long-range diffusion of HMs, and studies at the Kushk lead-zinc mine in Iran have shown that pollutants such as Pb and Zn can be transported by wind to residential areas up to 4 km away, significantly increasing the risk of population exposure (Mokhtari et al., 2018).
Cd released from coal combustion exhibits enhanced chemical stability in alkaline soils (pH 7.05-9.15), increasing its potential to threaten human health via dust inhalation and food chain transmission (Song et al., 2018). High persistence and bioavailability of Cd in soil of arid areas have been reported by several studies, and its risk of entering human body through crop uptake is significantly higher than that in humid areas (Dai et al., 2017; Kubier et al., 2019). Thus, the prioritization of Cd as a control element in mining areas has a clear regional relevance. Second, priority should be given to Factor 1 and implementing controlled grazing practices is essential for safeguarding the ecologically intact zones in northeastern mining area. The weathering of rocks in arid area is strong, and HM-rich mineral debris easily enters the surface through wind or runoff. Furthermore, unreasonable grazing activities exacerbate soil disturbance, leading to the diffusion and migration of dust on the soil surface. Monitoring in arid areas of Northwest China has shown that Pb and Cd concentrations in overgrazed areas are 30.00%-50.00% higher than those in nature reserves, and that the risk of HMs through grazing activities accounts for 15.00%-20.00% of NCR for children (Jiao et al., 2023).
Water quality, waste gas emission, and noise are regularly monitored in the mining area to determine whether the pollution emission exceeds the standard. Still, the impact of water scarcity in arid areas cannot be ignored. Limited surface runoff complicates the dilution of HMs, resulting in high pollutant concentrations in water bodies. Groundwater concentrations of Cd and As in semi-arid areas of India exceed WHO (World Health Organization) standards, significantly increasing the risk of cancer (Mukherjee et al., 2020). Notably, despite the ban on leaded gasoline in China, dust emissions from transport vehicles in mining areas in arid areas are still an important source of Pb pollution, and its secondary pollution through tire wear and road dust is more likely to be retained for a long time in dry environments (Navarro et al., 2008). All sources of pollution, regardless of magnitude of the impact, should be addressed to ensure that the risk to human health is within acceptable limits.

5 Conclusions

In this study, we explored the sources of soil HM contamination and ecological risk in the coal mining of Turpan City, Northwest China by the methods of Monte Carlo simulation, PMF model, and HRA model. The sources of soil HMs were categorized as natural and livestock, industrial transportation, fossil fuel combustion, atmospheric deposition, and domestic pollution. According to the indices of NIPI, Igeo, and EF, we found that Cd, Pb, and As were the main sources of pollution. Monte Carlo simulation results showed NCR with 4.00% probability and CR with 12.00% probability for children, with no NCR and CR risks for adults. Fossil fuel combustion sources accounted for the largest proportion of source-based HRA, and industrial transportation source accounted for the smallest proportion. In summary, ecological risk of the study area is at a relatively low level, but health risk to children cannot be ignored.

Conflict of interest

The authors declare that they have no known competing financial interests or personal relationships that could have appeared to influence the work reported in this paper.

Acknowledgements

This work was supported by the Third Xinjiang Scientific Expedition Project (2021XJKK1104), i.e., the Investigation and Assessment of the Effects of Energy and Mineral Resource Development in Turpan Basin on Regional Ecological Environment.

Author contributions

Conceptualization: LI Yun, SHI Qingdong; Data curation: LI Yun; Formal analysis: LI Yun, ZHUANG Zhong; Funding acquisition: XIA qianrou, SHI Qingdong; Investigation: LI Yun, ZHUANG Zhong, ZHU Jiawei, WANG Peijuan, LI Dinghao, Yryszhan ZHAKYPBEK, Serik TURSBEKOV; Methodology: LI Yun; Resources: LI Yun, ZHUANG Zhong, ZHU Jiawei, WANG Peijuan, LI Dinghao, Yryszhan ZHAKYPBEK, Serik TURSBEKOV; Software: LI Yun; Supervision: XIA qianrou, SHI Qingdong; Validation: LI Yun, ZHUANG Zhong, ZHU Jiawei, WANG Peijuan, LI Dinghao, Yryszhan ZHAKYPBEK, Serik TURSBEKOV; Visualization: LI Yun; Writing - original draft preparation: LI Yun; Writing - review and editing: ZHUANG Zhong, ZHU Jiawei, WANG Peijuan, LI Dinghao, SHI Qingdong, XIA qianrou, Yryszhan ZHAKYPBEK, Serik TURSBEKOV. All authors approved the manuscript.
[1]
Anaman R, Peng C, Jiang Z C, et al. 2022. Identifying sources and transport routes of heavy metals in soil with different land uses around a smelting site by GIS based PCA and PMF. Science of the Total Environment, 823: 153759, doi: 10.1016/j.scitotenv.2022.153759.

[2]
Bourliva A, Kantiranis N, Papadopoulou L, et al. 2018. Seasonal and spatial variations of magnetic susceptibility and potentially toxic elements (PTEs) in road dusts of Thessaloniki city, Greece: A one-year monitoring period. Science of the Total Environment, 639: 417-427.

[3]
Bradl H B. 2004. Adsorption of heavy metal ions on soils and soils constituents. Journal of Colloid and Interface Science, 277(1): 1-18.

[4]
Cao C C, Wang L, Li H R, et al. 2018. Temporal variation and ecological risk assessment of metals in soil nearby a Pb-Zn mine in southern China. International Journal of Environmental Research and Public Health, 15(5): 940, doi: 10.3390/ijerph15050940.

[5]
CEMS (China National Environmental Monitoring Centre). 1990. Natural Background Values of Soil Elements in China. Beijing: China Environmental Science Press. (in Chinese)

[6]
Chen H Y, Teng Y G, Lu S J, et al. 2016. Source apportionment and health risk assessment of trace metals in surface soils of Beijing metropolitan, China. Chemosphere, 144: 1002-1011.

[7]
Dai Y C, Nasir M, Zhang Y L, et al. 2017. Comparison of DGT with traditional methods for assessing cadmium bioavailability to Brassica chinensis in different soils. Scientific Reports, 7(1): 14206, doi: 10.1038/s41598-017-13820-3.

[8]
Department of Ecology and Environment of Xinjiang Uygur Autonomous Region. 2022. Shenhua Xinjiang Energy limited liability company Toxon Black Mountain opencast mine Environmental impact statement. [2024-06-30].https://max.book118.com/html/2022/0629/7152025010004136.shtm.

[9]
Fei X F, Xiao R, Christakos G, et al. 2019. Comprehensive assessment and source apportionment of heavy metals in Shanghai agricultural soils with different fertility levels. Ecological Indicators, 106: 105508, doi: 10.1016/j.ecolind.2019.105508.

[10]
Guan Q Y, Wang F F, Xu C Q, et al. 2018. Source apportionment of heavy metals in agricultural soil based on PMF: A case study in Hexi Corridor, Northwest China. Chemosphere, 193: 189-197.

[11]
Hakanson L. 1980. An ecological risk index for aquatic pollution control. A sedimentological approach. Water Research, 14(8): 975-1001.

[12]
Hossain Bhuiyan M A, Chandra Karmaker S, Bodrud-Doza M, et al. 2021. Enrichment, sources and ecological risk mapping of heavy metals in agricultural soils of Dhaka district employing SOM, PMF and GIS methods. Chemosphere, 263: 128339, doi: 10.1016/j.chemosphere.2020.128339.

[13]
Hu B F, Zhao R Y, Chen S C, et al. 2018a. Heavy metal pollution delineation based on uncertainty in a coastal industrial city in the Yangtze River Delta, China. International Journal of Environmental Research and Public Health, 15(4): 710, doi: 10.3390/ijerph15040710.

[14]
Hu W Y, Wang H F, Dong L R, et al. 2018b. Source identification of heavy metals in peri-urban agricultural soils of southeast China: An integrated approach. Environmental Pollution, 237: 650-661.

[15]
Jiao Y W, Liu Y T, Wang W, et al. 2023. Heavy metal distribution characteristics, water quality evaluation, and health risk evaluation of surface water in abandoned multi-year Pyrite mine area. Water, 15(17): 3138, doi: 10.3390/w15173138.

[16]
Karakas F, Imamoglu I, Gedik K. 2017. Positive matrix factorization dynamics in fingerprinting: A comparative study of PMF2 and EPA-PMF3 for source apportionment of sediment polychlorinated biphenyls. Environmental Pollution, 220: 20-28.

[17]
Kong F J, Chen Y C, Huang L, et al. 2021. Human health risk visualization of potentially toxic elements in farmland soil: A combined method of source and probability. Ecotoxicology and Environmental Safety, 211: 111922, doi: 10.1016/j.ecoenv.2021.111922.

[18]
Kubier A, Wilkin R T, Pichler T. 2019. Cadmium in soils and groundwater: A review. Applied Geochemistry, 108: 104388, doi: 10.1016/j.apgeochem.2019.104388.

[19]
Li F, Zhang J D, Huang J H, et al. 2016. Heavy metals in road dust from Xiandao District, Changsha City, China: Characteristics, health risk assessment, and integrated source identification. Environmental Science and Pollution Research, 23: 13100-13113.

[20]
Li H H, Chen L J, Yu L, et al. 2017. Pollution characteristics and risk assessment of human exposure to oral bioaccessibility of heavy metals via urban street dusts from different functional areas in Chengdu, China. Science of the Total Environment, 586: 1076-1084.

[21]
Li Y, Ye Z, Yu Y, et al. 2023. A combined method for human health risk area identification of heavy metals in urban environments. Journal of Hazardous Materials, 449: 131067, doi: 10.1016/j.jhazmat.2023.131067.

[22]
Li Z R, Deblon J, Zu Y Q, et al. 2019. Geochemical baseline values determination and evaluation of heavy metal contamination in soils of Lanping Mining Valley (Yunnan Province, China). International Journal of Environmental Research and Public Health, 16(23): 4686, doi: 10.3390/ijerph16234686.

[23]
Liang J, Feng C T, Zeng G M, et al. 2017. Spatial distribution and source identification of heavy metals in surface soils in a typical coal mine city, Lianyuan, China. Environmental Pollution, 225: 681-690.

[24]
Liao S Y, Jin G Q, Khan M A, et al. 2021. The quantitative source apportionment of heavy metals in peri-urban agricultural soils with UNMIX and input fluxes analysis. Environmental Technology & Innovation, 21: 101232, doi: 10.1016/j.eti.2020.101232.

[25]
Liu H W, Zhang Y, Yang J S, et al. 2021. Quantitative source apportionment, risk assessment and distribution of heavy metals in agricultural soils from southern Shandong Peninsula of China. Science of the Total Environment, 767: 144879, doi: 10.1016/j.scitotenv.2020.144879.

[26]
Liu Y, Guo H C, Yang P J. 2010. Exploring the influence of lake water chemistry on chlorophyll a: A multivariate statistical model analysis. Ecological Modelling, 221(5): 681-688.

[27]
Liu Z, Du Q Q, Guan Q Y, et al. 2023. A Monte Carlo simulation-based health risk assessment of heavy metals in soils of an oasis agricultural region in northwest China. Science of the Total Environment, 857: 159543, doi: 10.1016/j.scitotenv.2022.159543.

[28]
Luo H P, Guan Q Y, Pan N H, et al. 2020. Using composite fingerprints to quantify the potential dust source contributions in northwest China. Science of the Total Environment, 742: 140560, doi: 10.1016/j.scitotenv.2020.140560.

[29]
MEE(Ministry of Ecology and Environment of the People's Republic of China). 2018a. Soil-Determination of pH-Potentiometry. Beijing: MEE. (in Chinese)

[30]
MEE(Ministry of Ecology and Environment of the People's Republic of China). 2018b. Soil Environmental Quality Risk Control Standard for Soil Contamination of Development Land. Beijing: MEE. (in Chinese)

[31]
MEE(Ministry of Ecology and Environment of the People's Republic of China). 2023. Soil and Sediment-Determination of 19 Total Metal Elements-Inductively Coupled Plasma Mass Spectrometry. Beijing: MEE. (in Chinese)

[32]
Mei W, Liu S L, Yuan Y Y, et al. 2023. Optimization of potential ecological risk index method for soil heavy metals-A case study of Chengkou County, Chongqing City. Chinese Journal of Soil Science, 54(2): 473-480. (in Chinese)

[33]
Mi Y Z, Zhou J, Liu M L, et al. 2023. Machine learning method for predicting cadmium concentrations in rice near an active copper smelter based on chemical mass balance. Chemosphere, 319: 138028, doi: 10.1016/j.chemosphere.2023.138028.

[34]
Mokhtari A R, Feiznia S, Jafari M, et al. 2018. Investigating the role of wind in the dispersion of heavy metals around mines in arid regions (a case study from Kushk Pb-Zn Mine, Bafgh, Iran). Bulletin of Environmental Contamination and Toxicology, 101: 124-130.

[35]
Mukherjee I, Singh U K, Singh R P, et al. 2020. Characterization of heavy metal pollution in an anthropogenically and geologically influenced semi-arid region of east India and assessment of ecological and human health risks. Science of the Total Environment, 705: 135801, doi: 10.1016/j.scitotenv.2019.135801.

[36]
Müller G, Förstner U. 1976. Heavy Metals in Sediments of Elbe near Stade: Changes Since 1973. Naturwissenschaften, 63(5): 242-243. (in German)

[37]
Napoletano P, Guezgouz N, Di Iorio E, et al. 2023. Anthropic impact on soil heavy metal contamination in riparian ecosystems of northern Algeria. Chemosphere, 313: 137522, doi: 10.1016/j.chemosphere.2022.137522.

[38]
National Energy Xinjiang Toksun Energy Co.,Ltd. 2022. Environmental impact assessment of the 13 million tons per year production capacity verification project of Heishan Open-pit Coal Mine in Toksun County, Xinjiang Energy Co., Ltd. of National Energy Group. [2024-03-28].https://sthjt.xinjiang.gov.cn/xjepd/gwwjhpyb/202309/b703ad647d64471193702040df62d90a.shtml

[39]
Navarro M C, Pérez-Sirvent C, Martínez-Sánchez M J, et al. 2008. Abandoned mine sites as a source of contamination by heavy metals: A case study in a semi-arid zone. Journal of Geochemical Exploration, 96(2-3): 183-193.

[40]
Nemerow N L. 1974. Scientific Stream Pollution Analysis. Washington DC: Scripta Book Company.

[41]
Norris G, Duvall R, Brown S, et al. 2014. EPA Positive Matrix Factorization (PMF) 5.0 Fundamentals and User Guide. Washington DC: United States Environmental Protection Agency (US EPA).

[42]
Qi R, Xue N N, Wang S Z, et al. 2022. Heavy metal(loid)s shape the soil bacterial community and functional genes of desert grassland in a gold mining area in the semi-arid region. Environmental Research, 214: 113749, doi: 10.1016/j.envres.2022.113749.

[43]
Qing X, Zong Y T, Lu S G. 2015. Assessment of heavy metal pollution and human health risk in urban soils of steel industrial city (Anshan), Liaoning, Northeast China. Ecotoxicology and Environmental Safety, 120: 377-385.

[44]
Shen C, Huang S F, Wang M, et al. 2024. Source-oriented health risk assessment and priority control factor analysis of heavy metals in urban soil of Shanghai. Journal of Hazardous Materials, 480: 135859, doi: 10.1016/j.jhazmat.2024.135859.

[45]
Song H, Liu J C, Cao Z P, et al. 2019. Analysis of disease profile, and medical burden by lead exposure from hospital information systems in China. BMC Public Health, 19(1): 1170, doi: 10.1186/s12889-019-7515-5.

[46]
Song S, Li Y J, Li L, et al. 2018. Arsenic and heavy metal accumulation and risk assessment in soils around mining areas: The Urad Houqi Area in arid northwest china as an example. International Journal of Environmental Research and Public Health, 15(11): 2410, doi: 10.3390/ijerph15112410.

[47]
Specht A J, Lindsay I C, Wells E M, et al. 2025. Spatial distribution of heavy metal contamination in soils of Fallujah, Iraq. Exposure and Health, 17: 31-39.

[48]
Tawinteung N, Parkpian P, DeLaune R D, et al. 2005. Evaluation of extraction procedures for removing lead from contaminated soil. Journal of Environmental Science and Health. Part A, Toxic/Hazardous Substances & Environmental Engineering, 40: 385-407.

[49]
Tian S H, Liang T, Li K X, et al. 2018. Source and path identification of metals pollution in a mining area by PMF and rare earth element patterns in road dust. Science of the Total Environment, 633: 958-966.

[50]
US EPA (United States Environmental Protection Agency). 2013. Framework for Human Health Risk Assessment to Inform Decision Making. Washington DC: US EPA.

[51]
US EPA (United States Environmental Protection Agency). 2015. Positive Matrix Factorization Model for Environmental Data Analyses. Washington DC: US EPA.

[52]
Vidu R, Matei E, Predescu A M, et al. 2020. Removal of heavy metals from wastewaters: A Challenge from current treatment methods to nanotechnology applications. Toxics, 8(4): 101, doi: 10.3390/toxics8040101.

[53]
Wang X Y, Liu E F, Yan M X, et al. 2023. Contamination and source apportionment of metals in urban road dust (Jinan, China) integrating the enrichment factor, receptor models (FA-NNC and PMF), local Moran's index, Pb isotopes and source-oriented health risk. Science of the Total Environment, 878: 163211, doi: 10.1016/j.scitotenv.2023.163211.

[54]
Wu L J, Yue W F, Wu J, et al. 2023. Metal-mining-induced sediment pollution presents a potential ecological risk and threat to human health across China: A meta-analysis. Journal of Environmental Management 329: 117058, doi: 10.1016/j.jenvman.2022.117058.

[55]
Wu S, Xia X H, Lin C Y, et al. 2010. Levels of arsenic and heavy metals in the rural soils of Beijing and their changes over the last two decades (1985-2008). Journal of Hazardous Materials, 179(1-3): 860-868.

[56]
Xu Y, Shi H D, Fei Y, et al. 2021. Identification of soil heavy metal sources in a large-scale area affected by industry. Sustainability, 13(2): 511, doi: 10.3390/su13020511.

[57]
Xu Z Q, Ni S J, Tuo X G, et al. 2008. Calculation of heavy metal's toxicity coefficient in the evaluation of potential ecological risk index. Environmental Science & Technology, 31(2): 112-115.

[58]
Yang Q Q, Li Z Y, Lu X N, et al. 2018. A review of soil heavy metal pollution from industrial and agricultural regions in China: Pollution and risk assessment. Science of the Total Environment, 642: 690-700.

[59]
Yang S Y, Zhao J, Chang S X, et al. 2019. Status assessment and probabilistic health risk modeling of metals accumulation in agriculture soils across China: A synthesis. Environment International, 128: 165-174.

[60]
Yang S Y, Sun L J, Sun Y F, et al. 2023. Towards an integrated health risk assessment framework of soil heavy metals pollution: Theoretical basis, conceptual model, and perspectives. Environmental Pollution, 316: 120596, doi: 10.1016/j.envpol.2022.120596.

[61]
Yang Y, Yang X, He M J, et al. 2020. Beyond mere pollution source identification: Determination of land covers emitting soil heavy metals by combining PCA/APCS, GeoDetector and GIS analysis. CATENA, 185: 104297, doi: 10.1016/j.catena.2019.104297.

[62]
Yuanan H, He K L, Sun Z H, et al. 2020. Quantitative source apportionment of heavy metal(loid)s in the agricultural soils of an industrializing region and associated model uncertainty. Journal of Hazardous Materials, 391: 122244, doi: 10.1016/j.jhazmat.2020.122244.

[63]
Zeng S Y, Ma Y, Yang Y J, et al. 2019. Spatial assessment of farmland soil pollution and its potential human health risks in China. Science of the Total Environment, 687: 642-653.

[64]
Zhang H W, Zhang F, Song J, et al. 2021a. Pollutant source, ecological and human health risks assessment of heavy metals in soils from coal mining areas in Xinjiang, China. Environmental Research, 202: 111702, doi: 10.1016/j.envres.2021.111702.

[65]
Zhang W H, Yan Y, Yu R L, et al. 2021b. The sources-specific health risk assessment combined with APCS/MLR model for heavy metals in tea garden soils from south Fujian Province, China. CATENA, 203: 105306, doi: 10.1016/j.catena.2021.105306.

[66]
Zhang X, Song X Y, Zhang H Y, et al. 2024a. Source apportionment and risk assessment of heavy metals in typical greenhouse vegetable soils in Shenyang, China. Environmental Monitoring and Assessment, 196: 72, doi: 10.1007/s10661-023-12250-1.

[67]
Zhang X J, Zhang S W, Wei X Y, et al. 2024b. Identification of sources and analysis of spatial distribution of soil heavy metals in northern China coal mining areas. Environmental Geochemistry and Health, 46(3): 94, doi: 10.1007/s10653-024-01877-9.

[68]
Zhao J Y, Cao C Y, Chen X, et al. 2024. Source-specific ecological risk analysis and critical source identification of heavy metal(loid)s in the soil of typical abandoned coal mining area. Science of the Total Environment, 947: 174506, doi: 10.1016/j.scitotenv.2024.174506.

[69]
Zhao R, Guan Q Y, Luo H P, et al. 2019. Fuzzy synthetic evaluation and health risk assessment quantification of heavy metals in Zhangye agricultural soil from the perspective of sources. Science of the Total Environment, 697: 134126, doi: 10.1016/j.scitotenv.2019.134126.

[70]
Zheng F, Guo X, Tang M Y, et al. 2023. Variation in pollution status, sources, and risks of soil heavy metals in regions with different levels of urbanization. Science of the Total Environment, 866: 161355, doi: 10.1016/j.scitotenv.2022.161355.

[71]
Zhong X, Chen Z W, Li Y Y, et al. 2020. Factors influencing heavy metal availability and risk assessment of soils at typical metal mines in Eastern China. Journal of Hazardous Materials, 400: 123289, doi: 10.1016/j.jhazmat.2020.123289.

[72]
Zhou H, Yue X M, Chen Y, et al. 2024. Source-specific probabilistic contamination risk and health risk assessment of soil heavy metals in a typical ancient mining area. Science of the Total Environment, 906: 167772, doi: 10.1016/j.scitotenv.2023.167772.

[73]
Zhuang Q F, Li G, Liu Z Y. 2018. Distribution, source and pollution level of heavy metals in river sediments from South China. CATENA, 170: 386-396.

[74]
Zoller W H, Gladney E S, Duce R A. 1974. Atmospheric concentrations and sources of trace metals at the South Pole. Science, 183(4121): 198-200.

Outlines

/