
Experimental and model research on the evaporation of loess-like sulfate saline soil considering the influence of initial salt content
Received date: 2025-01-06
Revised date: 2025-06-04
Accepted date: 2025-06-20
Online published: 2025-08-12
Intense evaporation in areas with loess-like sulfate saline soils has resulted in significant ecological challenges that include water shortages and soil salinization. Investigating evaporation rate in loess-like sulfate saline soils under varying salt contents carries crucial implications for understanding regional water loss processes, predicting soil salinization advancement, and formulating effective ecological management strategies. Therefore, this study sampled the loess-like sulfate saline soil that is widely distributed in western China as experimental materials and investigated the impact of different initial salt contents (0.00%, 0.50%, 1.50%, 3.00%, and 5.00%) on the evaporation rate, water content, and temperature of soil. The results showed that the evaporation rate decreased with increasing initial salt content. After a salt accumulation layer formed on the soil surface, the water content of the surface soil fluctuated. An increase in the initial salt content resulted in a corresponding increase in the surface temperature. Considering the evaporation characteristics of loess-like sulfate saline soil and the impact of an anomalous increase in surface soil water content on soil surface resistance, this study proposed a modified evaporation model on the basis of Fujimaki's evaporation model of saline soil by introducing a correction coefficient β to modify the soil surface resistance. A comparison of the calculated evaporation rates before and after the modification with the measured evaporation rates revealed a significant improvement in the calculation accuracy of the modified model, indicating that the modified model is capable of more accurately simulating the evaporation rate of sulfate saline soil with different initial salt contents. This paper proposes an effective method for calculating the evaporation rate of loess-like sulfate saline soils, providing a theoretical basis for evaporation research in saline soil.
ZHANG Yabin , CHOU Yaling , ZHAO Dong , WANG Lijie , ZHANG Peng . Experimental and model research on the evaporation of loess-like sulfate saline soil considering the influence of initial salt content[J]. Journal of Arid Land, 2025 , 17(7) : 912 -932 . DOI: 10.1007/s40333-025-0103-x
Table 1 Basic physical parameters of loess |
| Liquid limit (%) | Plastic limit (%) | Plastic index | Specific gravity of soil particles |
|---|---|---|---|
| 29.40 | 16.20 | 13.20 | 2.71 |
Table 2 Particle size of loess |
| >1.000 mm (%) | 1.000-0.500 mm (%) | 0.500-0.250 mm (%) | 0.250-0.075 mm (%) | <0.075 mm (%) |
|---|---|---|---|---|
| 3.06 | 6.72 | 8.56 | 72.53 | 9.13 |
Table 3 Ion content of soil |
| Cl- | SO42- | HCO3- | CO32- | OH- | Ca2+ | Mg2+ | Na++K+ | NH4+ | Total soluble salt | |
|---|---|---|---|---|---|---|---|---|---|---|
| (mg/kg) | (mg/kg) | (%) | ||||||||
| 264 | 617 | 722 | 63 | 0 | 159 | 84 | 481 | 2 | 2079 | 0.21 |
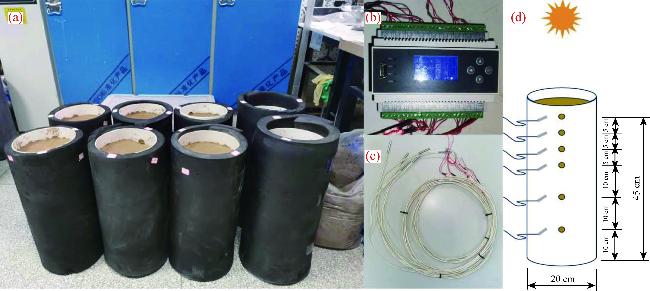
Fig. 1 Apparatus of the evaporation experiment. (a), soil column; (b), multichannel recorder; (c), temperature probe; (d), schematic of the placement of temperature probes. |
Table 4 Sampling date design of parallel soil columns |
| Soil column serial number | Initial salt content (%) | Sampling date (d) |
|---|---|---|
| A1 | 0.00 | 1st, 7th, 20th, and 35th |
| A2* | 0.00 | 3rd, 10th, 25th, and 40th |
| A3 | 0.00 | 5th, 15th, and 30th |
| B1 | 0.50 | 1st, 7th, 20th, and 35th |
| B2* | 0.50 | 3rd, 10th, 25th, and 40th |
| B3 | 0.50 | 5th, 15th, and 30th |
| C1 | 1.50 | 1st, 7th, 20th, and 35th |
| C2* | 1.50 | 3rd, 10th, 25th, and 40th |
| C3 | 1.50 | 5th, 15th, and 30th |
| D1 | 3.00 | 1st, 7th, 20th, and 35th |
| D2* | 3.00 | 3rd, 10th, 25th, and 40th |
| D3 | 3.00 | 5th, 15th, and 30th |
| E1 | 5.00 | 1st, 7th, 20th, and 35th |
| E2* | 5.00 | 3rd, 10th, 25th, and 40th |
| E3 | 5.00 | 5th, 15th, and 30th |
Note: "*" indicates the soil column where the temperature probe was positioned. |
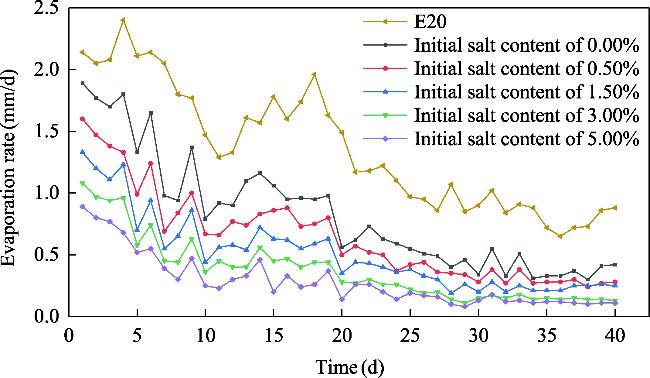
Fig. 2 Change in the evaporation rate of the soil columns with different initial salt contents over time. E20 represents the potential evaporation rate of atmosphere. |
Table 5 Decrease degree of the evaporation rate of the soil columns with different initial salt contents compared with that of the 0.00% salt content column |
| Initial salt content (%) | Beginning of evaporation (%) | End of evaporation (%) |
|---|---|---|
| 0.50 | 15.30 | 33.30 |
| 1.50 | 29.60 | 40.50 |
| 3.00 | 42.90 | 69.00 |
| 5.00 | 52.90 | 73.80 |
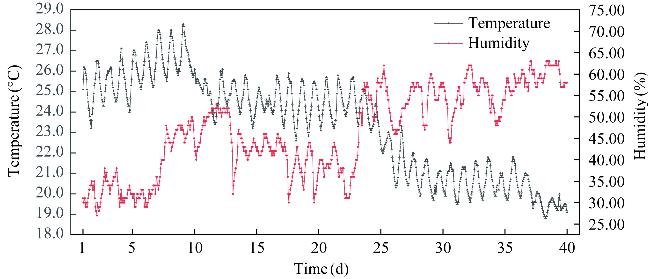
Fig. 3 Changes in air temperature and humidity over time |
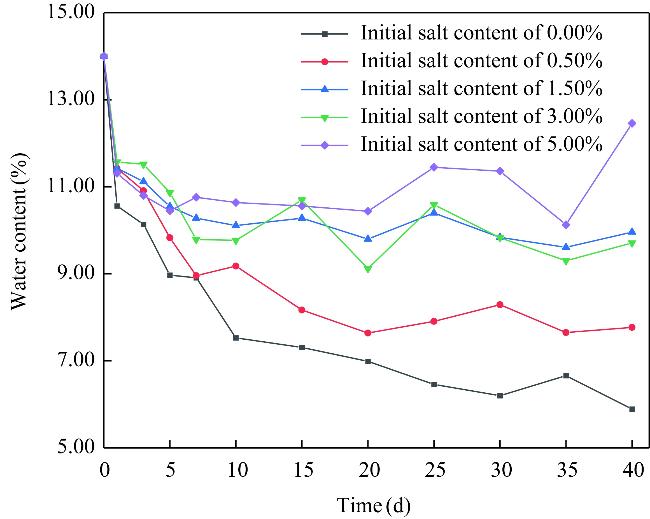
Fig. 4 Variation in water content on the surface of the soil columns with different initial salt contents over time |
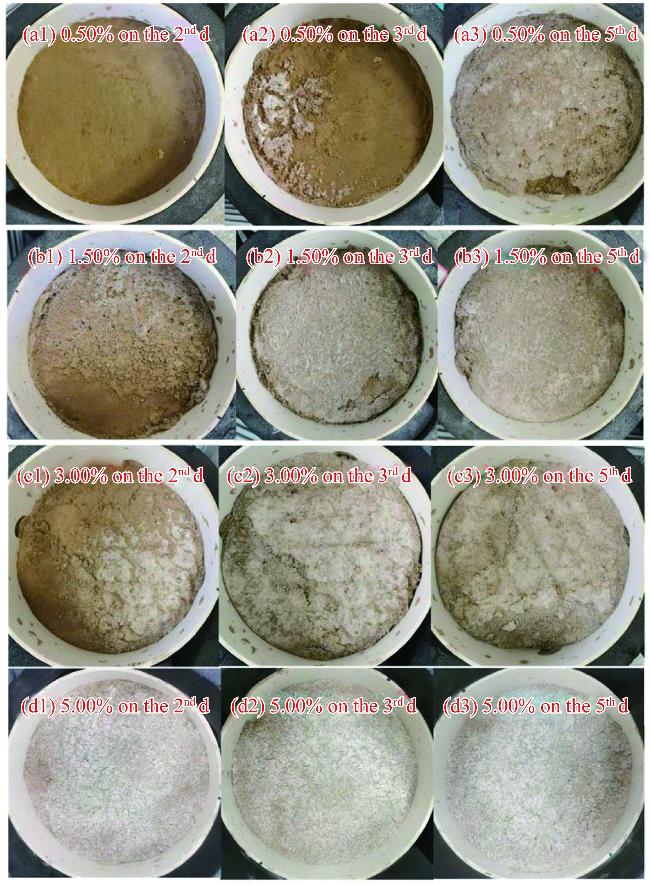
Fig. 5 Salt accumulation on the surface of the soil columns with initial salt contents of 0.50% (a1-a3), 1.50% (b1-b3), 3.00% (c1-c3), and 5.00% (d1-d3) on the 2nd, 3rd, and 5th d of the evaporation experiment |
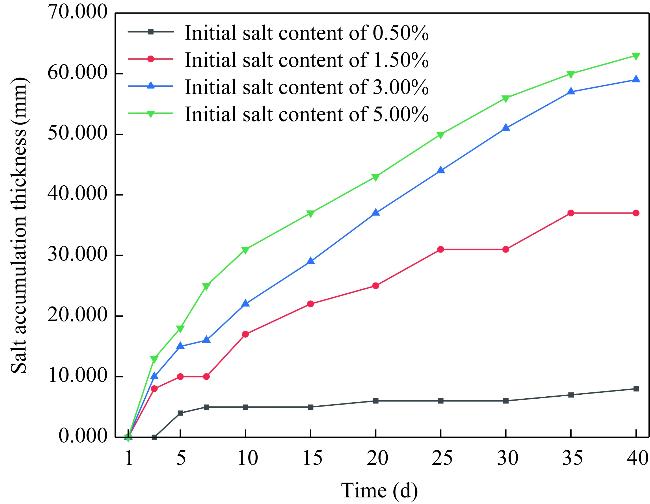
Fig. 6 Thickness of salt accumulation on the soil column surface |
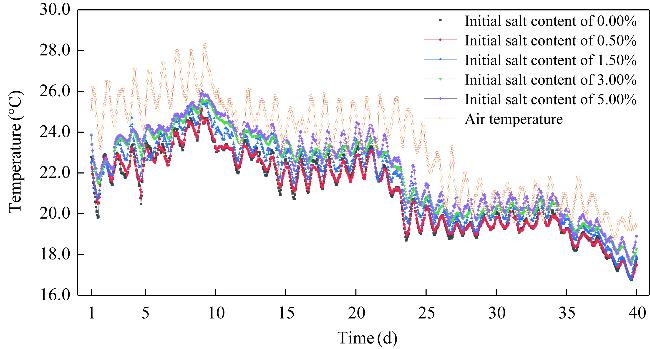
Fig. 7 Variation in the surface temperature of the soil columns with different initial salt contents |
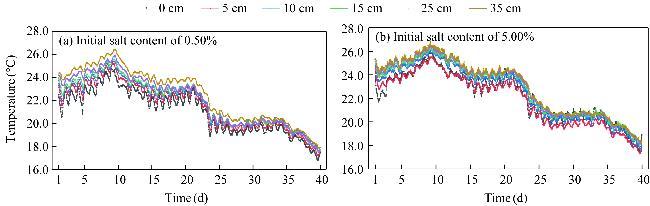
Fig. 8 Variation in the soil temperature at different depths with initial salt content of 0.50% (a) and 5.00% (b) |
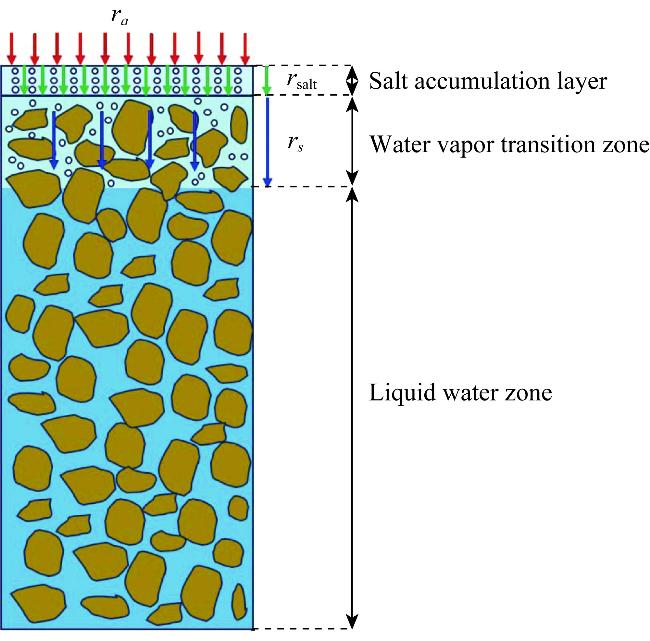
Fig. 9 Schematic of evaporation resistance model. The red arrow represents air resistance (ra), blue arrow represents soil surface resistance (rs), and green arrow represents salt shell resistance (rsalt). The downward arrow indicates the impedance to upward water migration. |
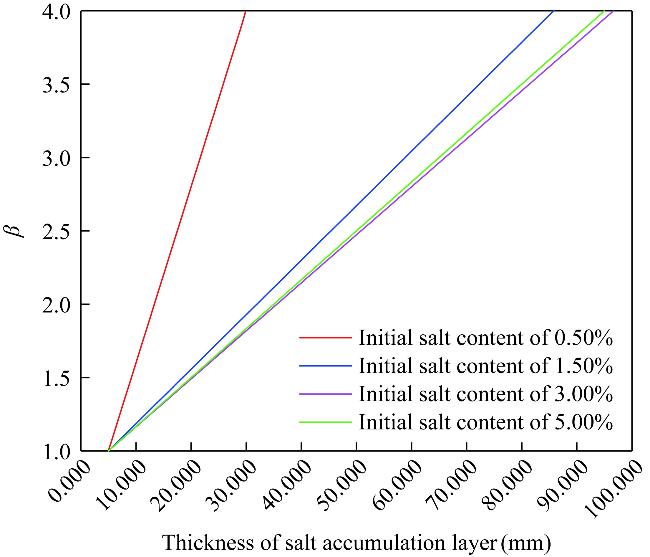
Table 6 Correction coefficient β |
| Initial salt content (%) | Interpolation formula |
|---|---|
| 0.50 | β=0.40000+0.12hts |
| 1.50 | β=0.81429+0.03714hts |
| 3.00 | β=0.83636+0.03273hts |
| 5.00 | β=0.83333+0.03333hts |
Note: hts is the thickness of the salt accumulation layer. |
Fig. 10 Relationship between the correction coefficient β of soils and the thickness of the salt accumulation layer under different initial salt contents |
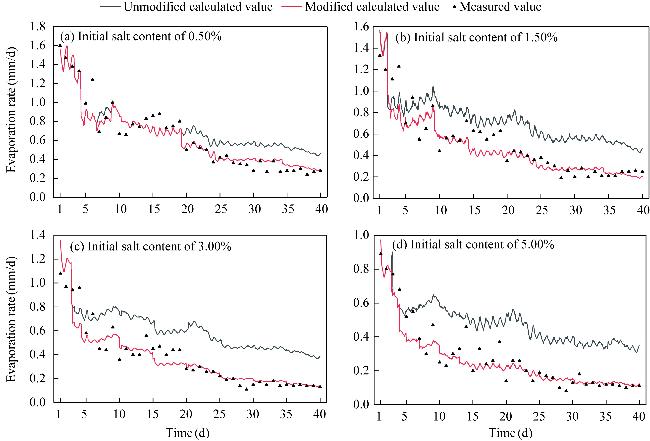
Fig. 11 Comparison of the calculated and measured evaporation rates with different initial salt contents. (a), initial salt content of 0.50%; (b), initial salt content of 1.50%; (c), initial salt content of 3.00%; (d), initial salt content of 5.00%. |
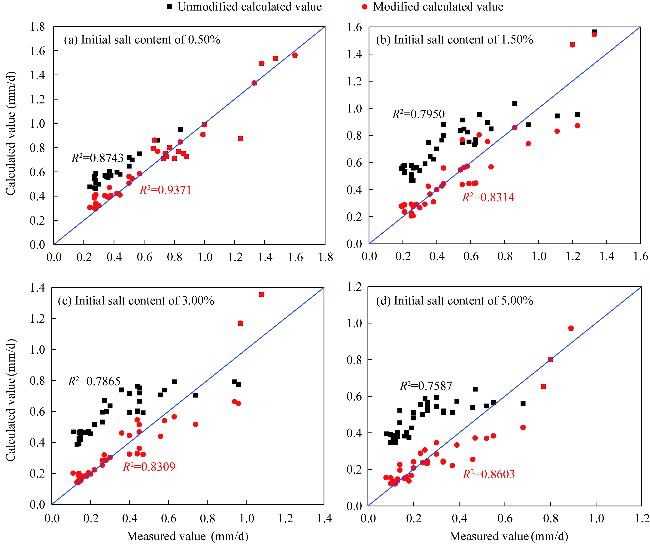
Fig. 12 Correlation analysis between the calculated values and the measured values of evaporation rate with different initial salt contents. (a), initial salt content of 0.50%; (b), initial salt content of 1.50%; (c), initial salt content of 3.00%; (d), initial salt content of 5.00%. The blue diagonal line represents the ideal reference line indicating perfect agreement between calculated and measured values. |
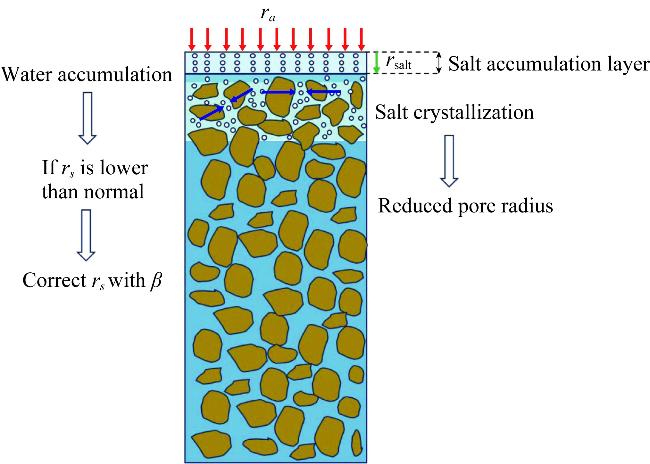
Fig. 13 Schematic of the modification principle for the evaporation model. The red arrow represents air resistance (ra), green arrow represents salt shell resistance (rsalt), and hollow arrow represents the logical sequence of model refinement principles. The distance between blue arrows represents pore size, and the downward arrow indicates the impedance to upward water migration. β, correction coefficient. |
| [1] |
|
| [2] |
|
| [3] |
China Meteorological Administration. 2025. China Meteorological Administration Yearbook(2020-2024). [2024-12-13]. http://data.cma.cn/.
|
| [4] |
|
| [5] |
|
| [6] |
|
| [7] |
|
| [8] |
|
| [9] |
|
| [10] |
|
| [11] |
|
| [12] |
|
| [13] |
|
| [14] |
|
| [15] |
|
| [16] |
|
| [17] |
|
| [18] |
|
| [19] |
|
| [20] |
|
| [21] |
|
| [22] |
|
| [23] |
|
| [24] |
|
| [25] |
|
| [26] |
Ministry of Water Resources of the People's Republic of China. 2019. Standard for Geotechnical Testing Method (GB/T 50123-2019). [2024-12-27]. https://oss.henan.gov.cn/typtfile/20210412/0e02cd5765cb4785910b3c2d93311e16.pdf.
|
| [27] |
|
| [28] |
|
| [29] |
|
| [30] |
|
| [31] |
|
| [32] |
|
| [33] |
|
| [34] |
|
| [35] |
|
| [36] |
|
| [37] |
|
| [38] |
|
| [39] |
|
| [40] |
|
| [41] |
|
| [42] |
|
| [43] |
|
| [44] |
|
| [45] |
|
| [46] |
|
| [47] |
|
| [48] |
|
| [49] |
|
| [50] |
|
| [51] |
|
| [52] |
|
| [53] |
|
| [54] |
|
| [55] |
|
| [56] |
|
| [57] |
|
| [58] |
|
| [59] |
|
| [60] |
|
/
| 〈 |
|
〉 |