
Effects of water tables and nitrogen application on soil bacterial community diversity, network structure, and function in an alpine wetland, China
Received date: 2024-07-24
Revised date: 2024-08-22
Accepted date: 2024-09-20
Online published: 2025-08-12
Nitrogen deposition and water tables are important factors to control soil microbial community structure. However, the specific effects and mechanisms of nitrogen deposition and water tables coupling on bacterial diversity, abundance, and community structure in arid alpine wetlands remain unclear. The nitrogen deposition (0, 10, and 20 kg N/(hm2•a)) experiments were conducted in the Bayinbulak alpine wetland with different water tables (perennial flooding, seasonal waterlogging, and perennial drying). The 16S rRNA (ribosomal ribonucleic acid) gene sequencing technology was employed to analyze the changes in bacterial community diversity, network structure, and function in the soil. Results indicated that bacterial diversity was the highest under seasonal waterlogging condition. However, nitrogen deposition only affected the bacterial Chao1 and beta diversity indices under seasonal waterlogging condition. The abundance of bacterial communities under different water tables showed significant differences at the phylum and genus levels. The dominant phylum, Proteobacteria, was sensitive to soil moisture and its abundance decreased with decreasing water tables. Although nitrogen deposition led to changes in bacterial abundance, such changes were small compared with the effects of water tables. Nitrogen deposition with 10 kg N/(hm2•a) decreased bacterial edge number, average path length, and robustness. However, perennial flooding and drying conditions could simply resist environmental changes caused by 20 kg N/(hm2•a) nitrogen deposition and their network structure remain unchanged. The sulfur cycle function was dominant under perennial flooding condition, and carbon and nitrogen cycle functions were dominant under seasonal waterlogging and perennial drying conditions. Nitrogen application increased the potential function of part of nitrogen cycle and decreased the potential function of sulfur cycle in bacterial community. In summary, composition of bacterial community in the arid alpine wetland was determined by water tables, and diversity of bacterial community was inhibited by a lower water table. Effect of nitrogen deposition on bacterial community structure and function depended on water tables.
HAN Yaoguang , CHEN Kangyi , SHEN Zhibo , LI Keyi , CHEN Mo , HU Yang , WANG Jiali , JIA Hongtao , ZHU Xinping , YANG Zailei . Effects of water tables and nitrogen application on soil bacterial community diversity, network structure, and function in an alpine wetland, China[J]. Journal of Arid Land, 2024 , 16(11) : 1584 -1603 . DOI: 10.1007/s40333-024-0031-1
Table 1 Information of the study area |
| Water table | Surface water and groundwater depth | Soil moisture (%) | Dominant plant species |
|---|---|---|---|
| Perennial flooding | Surface waterlogging depth of 20-50 cm | 92-115 | Carex rhynchophysa C. A. Mey., Utricularia vulgaris L. |
| Seasonal waterlogging | There is sometimes 0-10 cm of water on the surface (usually in the spring snowmelt period and the rainy season), and the groundwater depth is 80-100 cm below the surface | 60-81 | Carex melanantha C. A. Mey., Carex stenocarpa Turcz ex V. I. Krecz, and Triglochin maritima L. |
| Perennial drying | Dry surface and no water logging. Groundwater depth of 200 cm below the surface. | 36-52 | C. melanantha, Glaux maritima L. |
Table 2 Variance analysis of soil properties under nitrogen application and water tables |
| Treatment | Significance test | pH | TC | TN | AN | AP | AK | SOC | Soil moisture |
|---|---|---|---|---|---|---|---|---|---|
| Water tables | F | 2454.70 | 782.01 | 195.49 | 46.25 | 240.64 | 18659.38 | 444.06 | 256.96 |
| P | <0.001*** | <0.001*** | <0.001*** | <0.001*** | <0.001*** | <0.001*** | <0.001*** | <0.001*** | |
| Nitrogen application | F | 40.79 | 30.61 | 365.54 | 51.63 | 25.91 | 44.38 | 40.50 | 0.26 |
| P | <0.001*** | <0.001*** | <0.001*** | <0.001*** | <0.001*** | <0.001*** | <0.001*** | 0.31 | |
| Water tables× Nitrogen application | F | 3.60 | 3.96 | 1.62 | 1.48 | 3.45 | 17.77 | 12.50 | 0.15 |
| P | 0.025* | 0.018* | 0.213 | 0.249 | 0.003* | <0.001*** | <0.001*** | 0.96 |
Note: TC, total carbon; TN, total nitrogen; AN, available nitrogen; AP, available phosphorus; AK, available potassium; SOC, soil organic carbon. The abbreviations are the same in the following tables and figures. *, P<0.050 level; ***, P<0.001 level. |
Table 3 Effect of nitrogen application and water tables on soil chemical properties |
| Water table | Treat- ment | pH | TC (g/kg) | TN (g/kg) | SOC (g/kg) | AN (mg/kg) | AP (mg/kg) | AK (mg/kg) | Soil moisture (%) |
|---|---|---|---|---|---|---|---|---|---|
| Perennial flooding | CK | 7.52±0.02Ca | 169.02±1.53Ab | 8.43±0.39Aa | 105.42±3.53Bb | 127.24±3.44Ab | 16.67±8.59Bb | 102.67±4.01Ca | 101.50±2.26Aa |
| N1 | 7.48±0.01Cb | 184.38±1.20Aa | 8.59±0.12Aa | 125.91±3.44Aa | 136.47±5.66Aa | 26.90±1.14Cab | 100.93±2.05Ca | 107.56±11.62Aa | |
| N2 | 7.47±0.01Cb | 184.94±4.73Aa | 8.64±0.17Aa | 119.77±0.84Ba | 144.52±1.79Aa | 27.74±2.69Ca | 102.93±1.80Ca | 104.82±2.07Aa | |
| Seasonal water- logging | CK | 7.83±0.02Ba | 145.06±1.60Bb | 7.73±0.25Bb | 114.24±2.35Ab | 99.45±1.61Bc | 51.04±3.47Ab | 413.47±2.44Aa | 73.87±6.17Ba |
| N1 | 7.72±0.04Bb | 164.04±5.70Ba | 8.23±0.73Ab | 131.55±2.29Aa | 105.57±2.75Bb | 70.22±1.97Aa | 417.87±2.66Aa | 76.94±1.63Ba | |
| N2 | 7.75±0.02Bb | 168.42±2.57Ba | 8.68±0.12Aa | 132.98±2.28Aa | 113.08±2.07Ba | 70.33±4.54Aa | 426.67±2.41Ab | 76.89±4.66Ba | |
| Perennial drying | CK | 8.07±0.03Aa | 97.71±5.63Ca | 5.40±0.16Cc | 83.96±3.90Ca | 96.13±1.97Bb | 46.61±3.86Aa | 345.73±3.40Ba | 49.52±3.36Ca |
| N1 | 8.03±0.01Ab | 103.62±2.41Ca | 5.89±0.12Bb | 82.13±1.25Ba | 102.24±2.42Ba | 50.72±1.85Ba | 363.97±5.97Bb | 51.62±2.20Ca | |
| N2 | 8.04±0.02Ab | 101.71±8.15Ca | 6.44±0.12Ba | 85.06±1.77Ca | 105.46±2.77Ca | 51.99±1.43Ba | 381.63±5.91Bc | 50.62±1.61Ca |
Note: CK, N1, and N2 are the nitrogen application levels of 0, 10, and 20 kg N/(hm2•a), respectively. Different lowercase letters within the same water table indicate significant differences among different nitrogen levels at P<0.050 level; different uppercase letters within the same nitrogen application indicate significant differences among different water tables at P<0.050 level. |
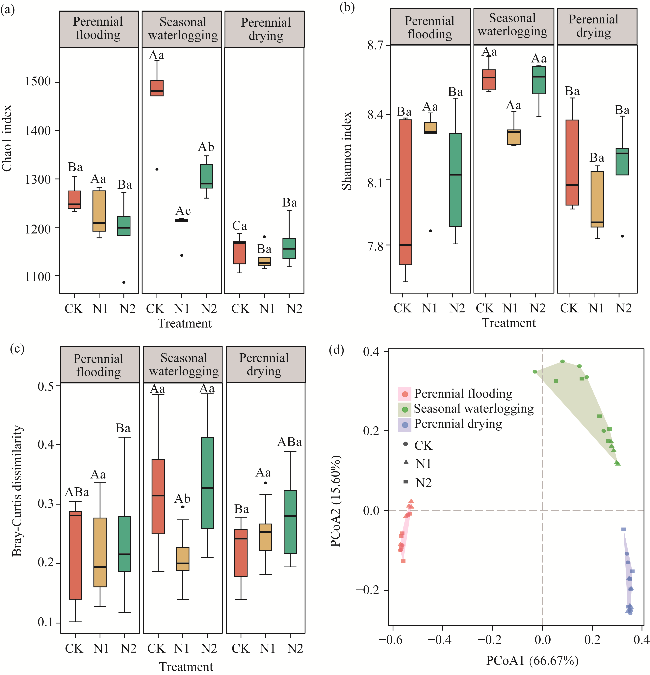
Fig. 1 Effects of nitrogen application on alpha and beta diversity of soil bacterial community under different water tables. Different uppercase letters within the same nitrogen application indicate significant differences under different water tables at P<0.050 level, and different lowercase letters within the same water tables indicate significant differences under different nitrogen application levels at P<0.050 level. (a), Chao1 index; (b), Shannon index; (c), Bray-Curtis dissimilarity; (d), principal coordinate analysis (PCoA) of bacterial community based on Bray-Curtis dissimilarity. CK, N1, and N2 are the nitrogen application levels of 0, 10, and 20 kg N/(hm2•a), respectively. Boxes in Figure 1a, b, and c indicate the IQR (interquartile range, 75th to 25th of the data). The median value is shown as a line within the box. Outlier is shown as black circle. Whiskers extend to the most extreme value within 1.5×IQR. |
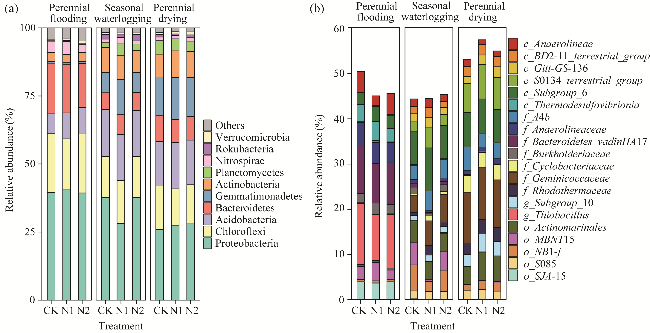
Fig. 2 Effects of nitrogen application on soil bacterial community structure under different water tables. (a), top 10 bacteria at phylum level; (b), top 20 bacteria at genus level. |
Table 4 Variance analysis of bacterial communities at phylum and genus levels under different nitrogen application and water tables |
| Phylum/genus | Water tables | Nitrogen application | Water tables×Nitrogen application | |||
|---|---|---|---|---|---|---|
| F | P | F | P | F | P | |
| Phylum | ||||||
| Proteobacteria | 85.143 | <0.001*** | 4.716 | 0.015* | 8.942 | <0.001*** |
| Chloroflexi | 46.730 | <0.001*** | 3.346 | 0.046* | 2.384 | 0.070 |
| Acidobacteria | 151.436 | <0.001*** | 1.320 | 0.280 | 1.277 | 0.300 |
| Bacteroidetes | 232.009 | <0.001*** | 1.766 | 0.185 | 1.430 | 0.240 |
| Gemmatimonadetes | 282.100 | <0.001*** | 10.802 | <0.001*** | 5.381 | 0.002** |
| Actinobacteria | 147.073 | <0.001*** | 0.366 | 0.696 | 2.038 | 0.110 |
| Planctomycetes | 294.773 | <0.001*** | 11.530 | <0.001*** | 17.168 | <0.001*** |
| Nitrospirae | 113.675 | <0.001*** | 12.159 | <0.001*** | 5.131 | 0.002** |
| Rokubacteria | 35.207 | <0.001*** | 4.575 | 0.017* | 2.459 | 0.060 |
| Verrucomicrobia | 5.511 | <0.001*** | 8.970 | 0.001** | 2.711 | 0.045* |
| Others | 321.968 | <0.001*** | 4.364 | 0.020* | 4.671 | 0.004** |
| Genus | ||||||
| c_Subgroup_6 | 127.480 | <0.001*** | 4.871 | 0.013* | 2.070 | 0.105 |
| Geminicoccaceae | 424.470 | <0.001*** | 1.442 | 0.250 | 2.788 | 0.041* |
| Hydrogenophilaceae | 155.358 | <0.001*** | 1.287 | 0.288 | 1.058 | 0.392 |
| Bacteroidetes_vadinHA17 | 576.490 | <0.001*** | 4.533 | 0.018* | 1.777 | 0.155 |
| o_Actinomarinales | 113.628 | <0.001*** | 1.793 | 0.181 | 3.684 | 0.013* |
| c_S0134_terrestrial_group | 314.537 | <0.001*** | 9.834 | <0.001*** | 3.468 | 0.017* |
| Anaerolineaceae | 101.599 | <0.001*** | 0.615 | 0.546 | 6.984 | <0.001*** |
| A4b | 39.338 | <0.001*** | 5.085 | 0.011* | 5.112 | 0.002** |
| c_Anaerolineae | 61.026 | <0.001*** | 7.275 | 0.002** | 21.784 | <0.001*** |
| o_MBNT15 | 615.364 | <0.001*** | 1.074 | 0.352 | 1.045 | 0.398 |
| o_NB1-j | 42.549 | <0.001*** | 2.791 | 0.075 | 5.105 | 0.002** |
| Solibacteraceae_Subgroup_3 | 133.354 | <0.001*** | 4.781 | 0.014* | 2.339 | 0.074 |
| Gemmatimonadaceae | 359.449 | <0.001*** | 0.572 | 0.570 | 0.300 | 0.876 |
| Thermoanaerobaculaceae | 222.265 | <0.001*** | 11.317 | <0.001*** | 6.044 | 0.001** |
| o_SJA-15 | 138.860 | <0.001*** | 3.136 | 0.056 | 2.758 | 0.042* |
| Ilumatobacteraceae | 199.072 | <0.001*** | 4.971 | 0.012* | 5.321 | 0.002** |
| Cyclobacteriaceae | 164.618 | <0.001*** | 0.342 | 0.713 | 0.980 | 0.431 |
| Rhodothermaceae | 327.543 | <0.001*** | 3.861 | 0.030* | 4.312 | 0.006** |
| c_BD2-11_terrestrial_group | 167.426 | <0.001*** | 1.048 | 0.361 | 0.399 | 0.808 |
| Burkholderiaceae | 31.589 | <0.001*** | 0.314 | 0.733 | 1.194 | 0.330 |
| Others | 42.020 | <0.001*** | 0.148 | 0.863 | 3.055 | 0.029* |
Note: *, P<0.050 level; **, P<0.010 level; ***, P<0.001 level. |
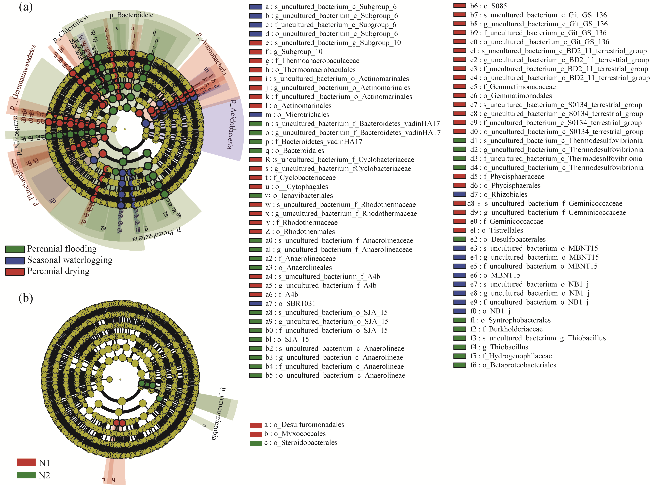
Fig. 3 Analysis of soil microbial community structure using linear discriminant analysis (LDA) and effect size (LEfSe) under different water tables. (a), phylogenetic trees of bacterial biomarkers under perennial flooding, seasonal waterlogging, and perennial drying conditions. The LDA threshold was 4.0; (b), phylogenetic trees of bacterial biomarkers under N1 and N2 treatments. The LDA threshold was 3.0. |
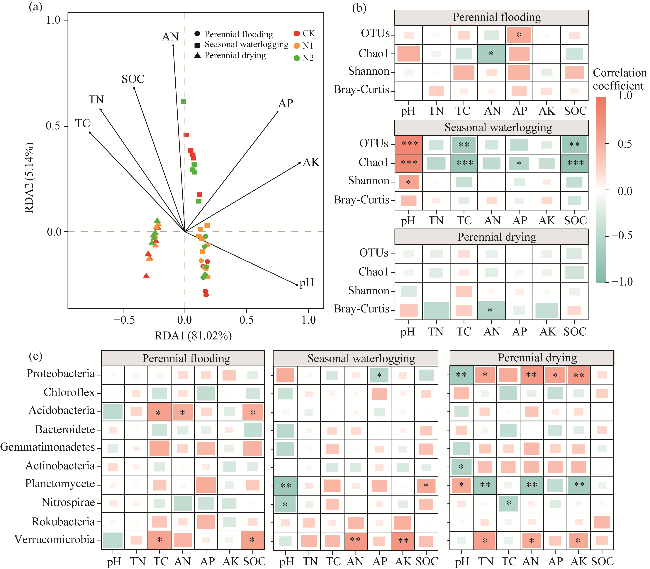
Fig. 4 Correlation analysis of nitrogen application on bacterial community structure and soil properties under different water tables. (a), redundancy analysis (RDA) between soil bacterial populations and soil properties; (b), Pearson's correlation between diversity index and soil properties; (c), Pearson's correlation between dominating phyla and soil properties. OTUs, operational taxonomic units; *, P<0.050 level; **, P<0.010 level; ***, P<0.001 level. |
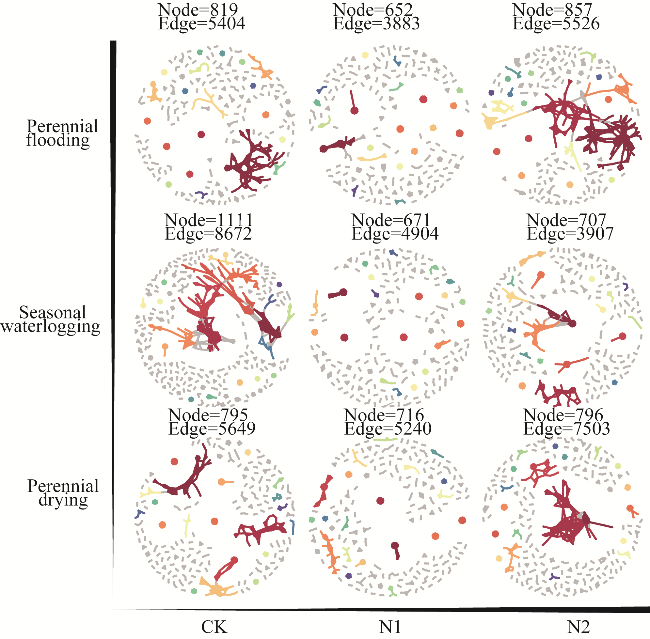
Fig. 5 Effects of nitrogen application on bacterial networks under different water tables. Nodes with the same color had the same size. Larger nodes were shown in different colors, and smaller nodes were shown in gray. |
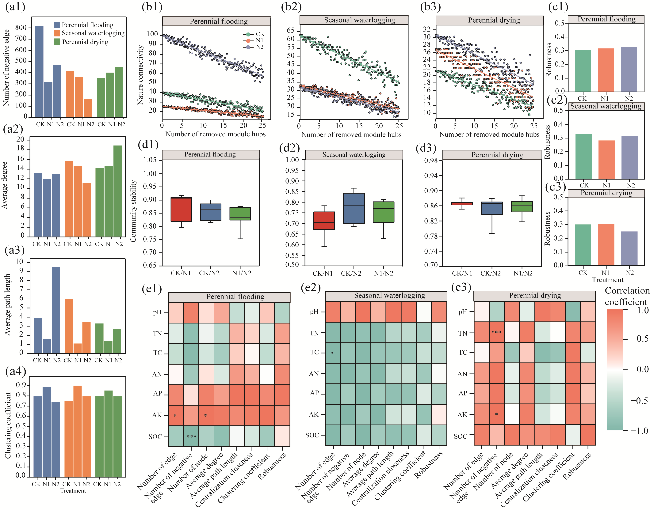
Fig. 6 Network topology properties of bacteria. (a1-a4), parameters of bacterial network under different nitrogen application and water tables; (b1-b3), nature connectivity of bacterial network under numbers of removed module hubs; (c1-c3), robustness; (d1-d3), community stability; (e1-e3), Spearman's correlation between parameters of bacterial network and soil properties. *, P<0.050 level; ***, P<0.001 level. |
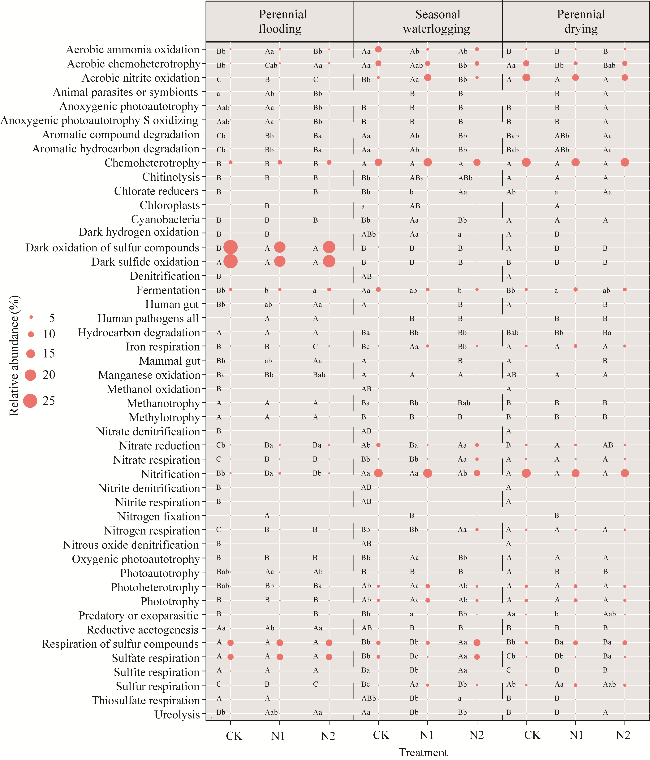
Fig. 7 Soil bacterial function under different nitrogen application and water tables. Different lowercase letters within the same water tables indicate significant differences among different nitrogen application levels at P<0.050 level. Different uppercase letters within the same nitrogen application indicate significant differences among different water tables at P<0.050 level. The red circle represents the relative abundance of bacterial function. |
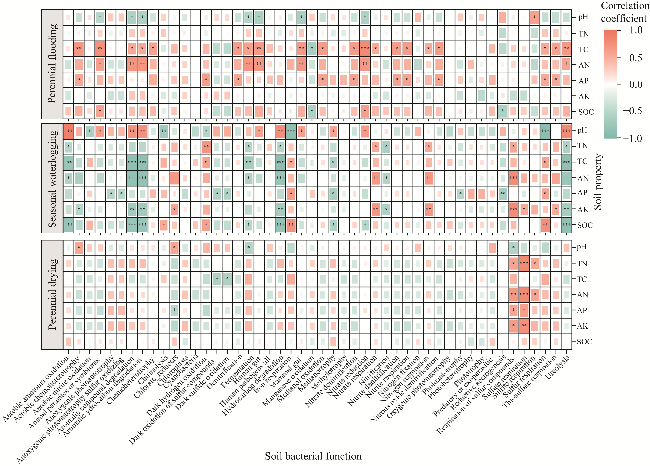
Fig. 8 Correlation analysis between soil bacterial function and soil properties under different water tables. *, P<0.050 level; **, P<0.010 level; ***, P<0.001 level. |
| [1] |
|
| [2] |
|
| [3] |
|
| [4] |
|
| [5] |
|
| [6] |
|
| [7] |
|
| [8] |
|
| [9] |
|
| [10] |
|
| [11] |
|
| [12] |
|
| [13] |
|
| [14] |
|
| [15] |
|
| [16] |
|
| [17] |
|
| [18] |
|
| [19] |
|
| [20] |
|
| [21] |
|
| [22] |
|
| [23] |
|
| [24] |
|
| [25] |
|
| [26] |
|
| [27] |
|
| [28] |
|
| [29] |
|
| [30] |
|
| [31] |
|
| [32] |
|
| [33] |
|
| [34] |
|
| [35] |
|
| [36] |
|
| [37] |
|
| [38] |
|
| [39] |
|
| [40] |
|
| [41] |
|
| [42] |
|
| [43] |
|
| [44] |
|
| [45] |
|
| [46] |
|
| [47] |
|
| [48] |
|
| [49] |
|
| [50] |
|
| [51] |
|
| [52] |
|
| [53] |
|
| [54] |
|
| [55] |
|
| [56] |
|
| [57] |
|
| [58] |
|
| [59] |
|
| [60] |
|
| [61] |
|
| [62] |
|
| [63] |
|
| [64] |
|
| [65] |
|
| [66] |
|
| [67] |
|
| [68] |
|
| [69] |
|
| [70] |
|
| [71] |
|
| [72] |
|
| [73] |
|
| [74] |
|
| [75] |
|
| [76] |
|
| [77] |
|
| [78] |
|
/
| 〈 |
|
〉 |