
Spatiotemporal patterns and driving factors of soil protection in the wind-water erosion area of Chinese Loess Plateau
Received date: 2024-01-22
Revised date: 2024-08-07
Accepted date: 2024-09-25
Online published: 2025-08-12
As one of typical areas in the world, northern Chinese Loess Plateau experiences serious wind-water erosion, which leads to widespread land degradation. During the past decades, an ecological engineering was implemented to reduce soil erosion and improve soil protection in this area. Thus, it is necessary to recognize the basic characteristics of soil protection for sustainable prevention and wind-water erosion control in the later stage. In this study, national wind erosion survey model and revised universal soil loss equation were used to analyze the spatiotemporal evolution and driving forces of soil protection in the wind-water erosion area of Chinese Loess Plateau during 2000-2020. Results revealed that: (1) during 2000-2020, total amount of soil protection reached up to 15.47×10⁸ t, which was realized mainly through water and soil conservation, accounting for 63.20% of the total; (2) soil protection was improved, with increases in both soil protection amount and soil retention rate. The amounts of wind erosion reduction showed a decrease trend, whereas the retention rate of wind erosion reduction showed an increase trend. Both water erosion reduction amount and retention rate showed increasing trends; and (3) the combined effects of climate change and human activities were responsible for the improvement of soil protection in the wind-water erosion area of Chinese Loess Plateau. The findings revealed the spatiotemporal patterns and driving forces of soil protection, and proposed strategies for future soil protection planning in Chinese Loess Plateau, which might provide valuable references for soil erosion control in other wind-water erosion areas of the world.
Key words: soil protection; driving force; trade-off; synergy; wind-water erosion; Loess Plateau
LI Qing , LI Dan , WANG Sheng , WANG Jinfeng , WANG Rende , FU Gang , YUAN Yixiao , ZHENG Zhenhua . Spatiotemporal patterns and driving factors of soil protection in the wind-water erosion area of Chinese Loess Plateau[J]. Journal of Arid Land, 2024 , 16(11) : 1522 -1540 . DOI: 10.1007/s40333-024-0033-z
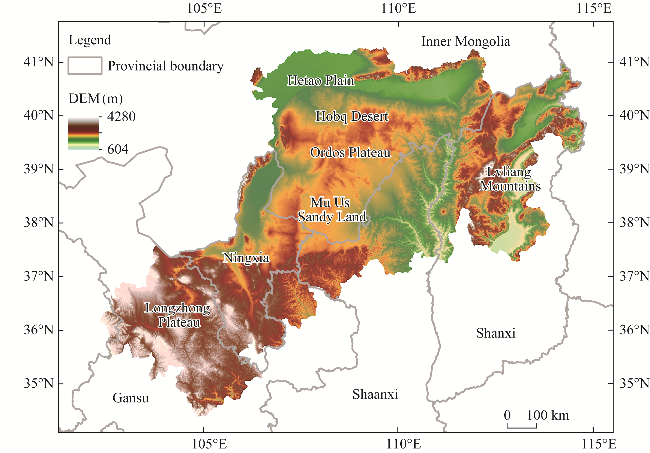
Fig. 1 Location and digital elevation model (DEM) of the wind-water erosion area of Chinese Loess Plateau. Note that the figure is based on the standard map (GS(2022)4309) of the Map Service System (https://bzdt.ch.mnr.gov.cn/), and the boundary has not been modified. |
Table 1 Data information and sources |
| Data type | Date | Resolution | Processing | Data source |
|---|---|---|---|---|
| Meteorological data | Hourly wind speed | 1 km×1 km | Using ANUSPLINE, meteorological data were interpolated to raster data | National Climate Data Center |
| Monthly precipitation | 1 km×1 km | China Meteorological Science Data Sharing Service Network | ||
| Remote sensing data | LULC | 30 m×30 m | LULC, soil type, NDVI, and DEM data were uniformly processed into raster data with a spatial resolution of 1 km× 1 km | Wuhan University's Annual China Land Cover Dataset (CLCD) |
| Soil type | 1:1,000,000 | Resources and Environmental Science and Data Center, Chinese Academy of Sciences | ||
| NDVI | MODIS 1 km/16d | United States Geological Survey | ||
| DEM | 30 m×30 m | Geospatial Data Cloud | ||
| Boundary of wind erosion area in northern China | Vector | Water Conservancy Census of China | ||
| Boundary of Loess Plateau | Vector | Resources and Environmental Science and Data Center, Chinese Academy of Sciences |
Note: LULC, land use and land cover; NDVI, normalized difference vegetation index; DEM, digital elevation model; MODIS, moderate resolution imaging spectroradiometer. |
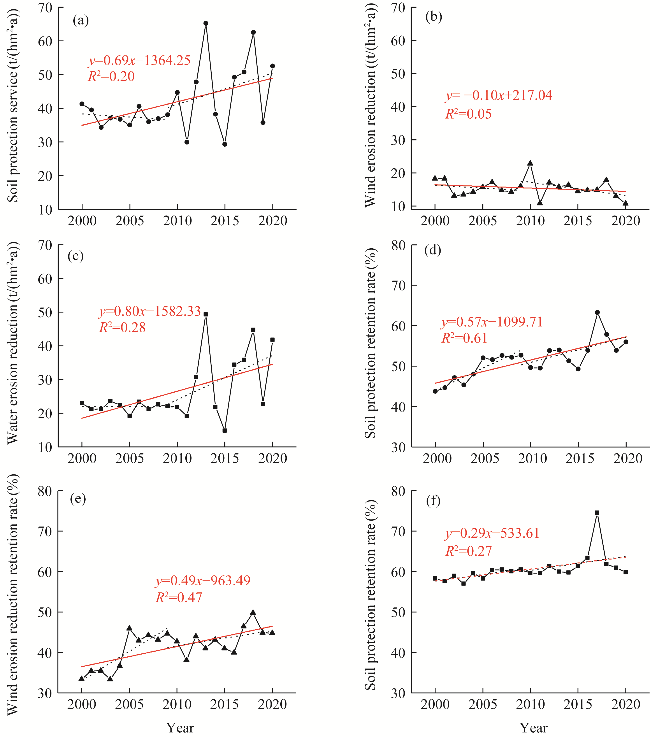
Fig. 2 Inter-annual variations in soil protection service (a), wind erosion reduction (b), water erosion reduction (c), soil protection retention rate (d), wind erosion reduction retention rate (e), and soil protection retention rate (f). Red lines and functions represent the overall trend lines and trend functions for each parameter during 2000-2020, respectively; and black dashed lines represent the overall trend lines for each parameter during 2000-2009 and 2010-2020. |
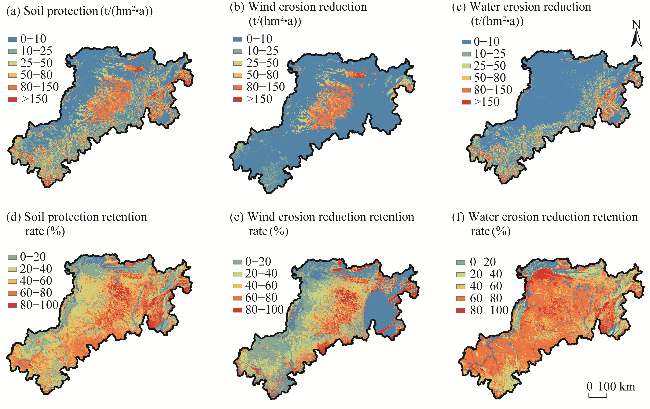
Fig. 3 Spatial patterns of soil protection (a), wind erosion reduction (b), water erosion reduction (c), soil protection retention rate (d), wind erosion reduction retention rate (e), and water erosion reduction retention rate (f) in the wind-water erosion area of the Loess Plateau during 2000-2020 |
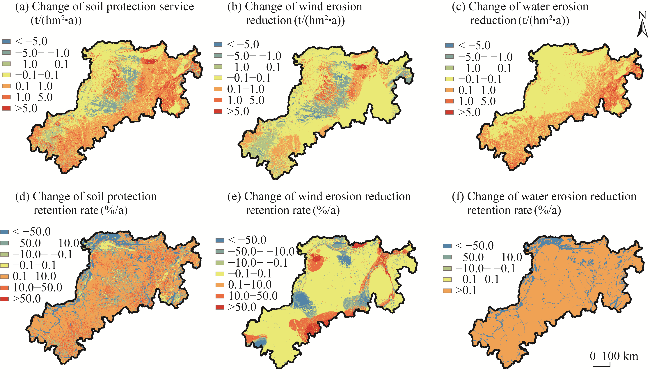
Fig. 4 Changes of soil protection service (a), wind erosion reduction (b), water erosion reduction (c), soil protection retention rate (d), wind erosion reduction retention rate (e), and water erosion reduction retention rate (f) in the wind-water erosion area of the Loess Plateau during 2000−2020 |
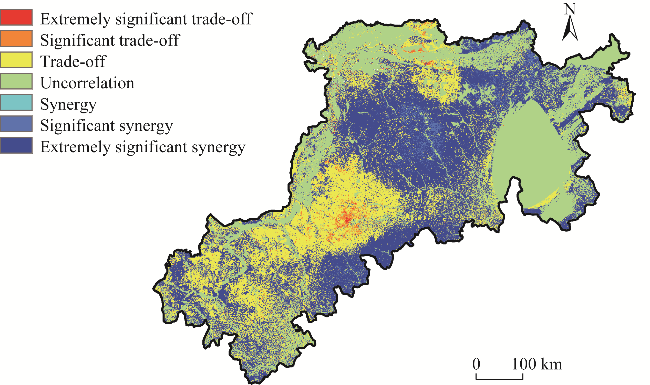
Fig. 5 Spatial relationship between wind erosion reduction and water erosion reduction |
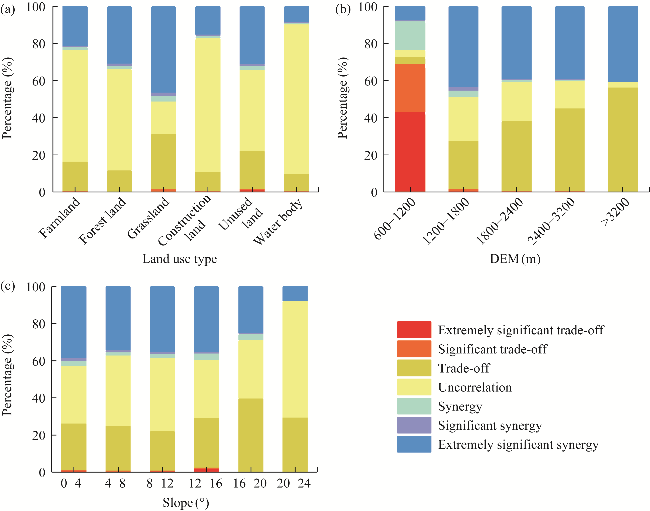
Fig. 6 Trade-off and synergy between wind erosion reduction and water erosion reduction under different land use types (a), digital elevation model (DEM; b), and slopes (c) |
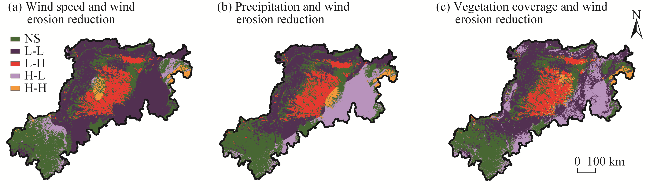
Fig. 7 Local indicators of spatial association (LISA) plots of wind speed and wind erosion reduction (a), precipitation and wind erosion reduction (b), and vegetation coverage and wind erosion reduction (c). NS, not significant; L-L, low-low; L-H, low-high; H-L, high-low; H-H, high-high. The abbreviations are the same in Figure 8. |
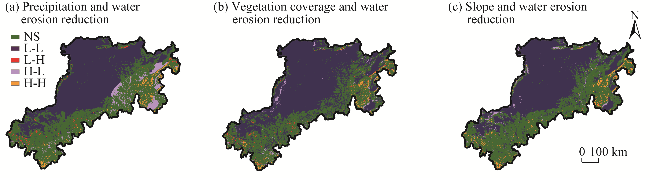
Fig. 8 Localized LISA plots of precipitation and water erosion reduction (a), vegetation coverage and water erosion reduction (b), and slope and water erosion reduction (c) |
Table 2 Land use area transfer matrix from 2000 to 2020 |
| Land use type | Farmland | Forest land | Grassland | Water body | Construction land | Unused land | Decreasing area |
|---|---|---|---|---|---|---|---|
| (km2) | |||||||
| Farmland | 56,228 | 1030 | 36,437 | 619 | 208 | 0 | 38,294 |
| Forest land | 313 | 7025 | 3743 | 6 | 8 | 0 | 4070 |
| Grassland | 29,296 | 5420 | 171,721 | 482 | 5185 | 1953 | 42,336 |
| Water body | 445 | 15 | 279 | 661 | 35 | 128 | 902 |
| Construction land | 1152 | 0 | 14,416 | 122 | 11,489 | 343 | 16,033 |
| Unused land | 1262 | 0 | 1814 | 70 | 39 | 776 | 3185 |
| Increasing area | 32,468 | 6465 | 56,689 | 1299 | 5475 | 2424 | - |
Note: ''-'' means no value. |
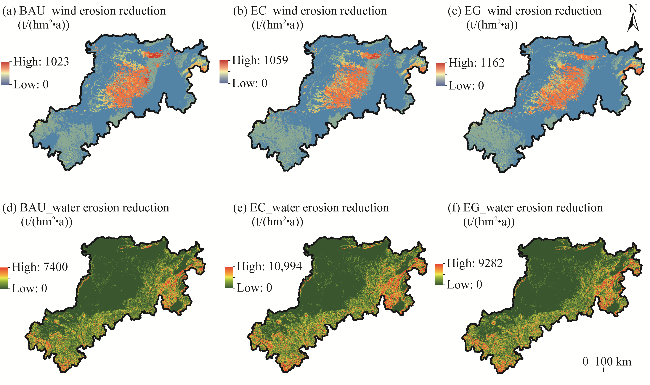
Fig. 9 Changes in wind erosion reduction and water erosion reduction under three scenarios (business as usual (BAU; a and d), ecological conservation (EC; b and e), and economic growth (EG; c and f)) |
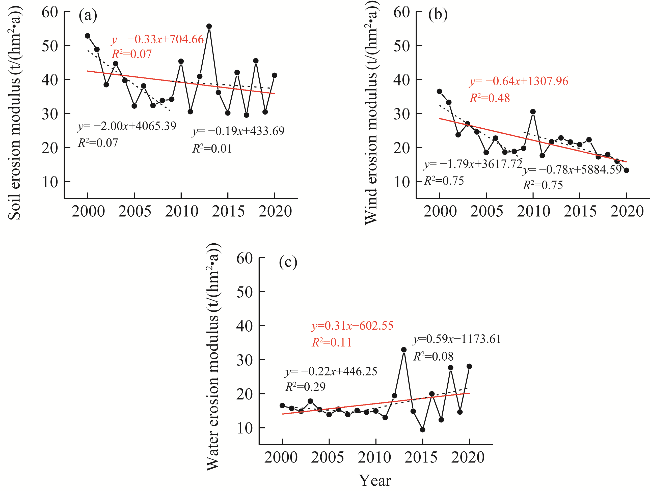
Fig. S1 Inter-annual variations of soil erosion modulus (a), wind erosion modulus (b), and water erosion modulus (c). Red lines and functions represent the overall trend lines and trend functions for each parameter during 2000-2020, and black dashed lines and functions represent the overall trend lines for each parameter during 2000-2009 and 2010-2020. |
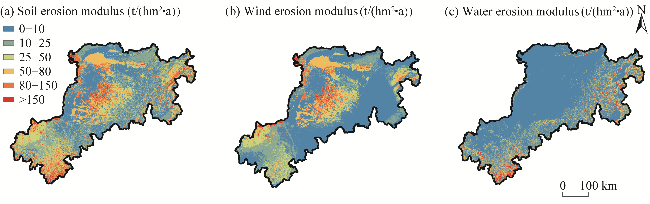
Fig. S2 Spatial distribution patterns of soil erosion modulus (a), wind erosion modulus (b), and water erosion modulus (c) |
| [1] |
|
| [2] |
|
| [3] |
|
| [4] |
|
| [5] |
|
| [6] |
|
| [7] |
|
| [8] |
|
| [9] |
|
| [10] |
|
| [11] |
|
| [12] |
|
| [13] |
|
| [14] |
|
| [15] |
|
| [16] |
|
| [17] |
|
| [18] |
|
| [19] |
|
| [20] |
|
| [21] |
|
| [22] |
|
| [23] |
|
| [24] |
|
| [25] |
|
| [26] |
|
| [27] |
|
| [28] |
|
| [29] |
|
| [30] |
|
| [31] |
|
| [32] |
|
| [33] |
|
| [34] |
|
| [35] |
|
| [36] |
|
| [37] |
|
| [38] |
|
| [39] |
|
| [40] |
|
| [41] |
|
| [42] |
|
| [43] |
|
| [44] |
UNCCD (United Nation Convention to Combat Desertification). 2022. Chronic land degradation: UN offers stark warnings and practical remedies in global land outlook. [2023-04-27]. https://www.unccd.int/news-stories/press-releases/chronic-land-degradation-un-offers-stark-warnings-and-practical.
|
| [45] |
|
| [46] |
|
| [47] |
|
| [48] |
|
| [49] |
|
| [50] |
|
| [51] |
|
| [52] |
|
| [53] |
|
| [54] |
|
| [55] |
|
| [56] |
|
| [57] |
|
| [58] |
|
| [59] |
|
| [60] |
|
| [61] |
|
| [62] |
|
| [63] |
|
| [64] |
|
| [65] |
|
| [66] |
|
| [67] |
|
/
| 〈 |
|
〉 |