Research article

Spatiotemporal evolution of water conservation function and its driving factors in the Huangshui River Basin, China

  • YUAN Ximin 1, 2 ,
  • SU Zhiwei 1, 2, 3 ,
  • TIAN Fuchang , 1, 2, * ,
  • WANG Pengquan 3
Expand
  • 1State Key Laboratory of Hydraulic Engineering Intelligent Construction and Operation, Tianjin University, Tianjin 300350, China
  • 2School of Civil Engineering, Tianjin University, Tianjin 300350, China
  • 3School of Civil and Transportation Engineering, Qinghai Minzu University, Xining 810007, China
*TIAN Fuchang (E-mail: )

Received date: 2024-06-20

  Revised date: 2024-10-07

  Accepted date: 2024-10-11

  Online published: 2025-08-12

Abstract

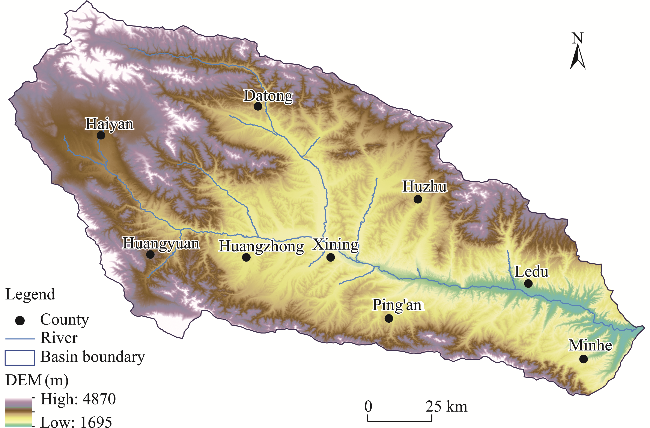
The Grain for Green project has had a substantial influence on water conservation in the Huangshui River Basin, China through afforestation and grassland restoration over the past two decades. However, a comprehensive understanding of the spatiotemporal evolution of water conservation function and its driving factors remains incomplete in this basin. In this study, we utilized the Integrated Valuation of Ecosystem Services and Tradeoffs (InVEST) model to examine the spatiotemporal evolution of water conservation function in the Huangshui River Basin from 2000 to 2020. Additionally, we employed the random forest model, Pearson correlation analysis, and geographical detector (Geodetector) techniques to investigate the primary factors and factor interactions affecting the spatial differentiation of water conservation function. The findings revealed several key points. First, the high-latitude northern region of the study area experienced a significant increase in water conservation over the 21-a period. Second, the Grain for Green project has played a substantial role in improving water conservation function. Third, precipitation, plant available water content (PAWC), grassland, gross domestic product (GDP), and forest land were primary factors influencing the water conservation function. Finally, the spatial differentiation of water conservation function was determined by the interactions among geographical conditions, climatic factors, vegetation biophysical factors, and socio-economic factors. The findings have significant implications for advancing ecological protection and restoration initiatives, enhancing regional water supply capabilities, and safeguarding ecosystem health and stability in the Huangshui River Basin.

Cite this article

YUAN Ximin , SU Zhiwei , TIAN Fuchang , WANG Pengquan . Spatiotemporal evolution of water conservation function and its driving factors in the Huangshui River Basin, China[J]. Journal of Arid Land, 2024 , 16(11) : 1484 -1504 . DOI: 10.1007/s40333-024-0087-y

1 Introduction

The Huangshui River, as the largest tributary of the Yellow River in the upstream region, is located in the transitional zone between the Qinghai-Xizang Plateau and Loess Plateau, China. It holds a prominent ecological geographical position and serves as an essential component of the ecological security barrier upstream of the Yellow River. Furthermore, it serves as the political and economic center of Qinghai Province, China, accommodating nearly 60.00% of the province's population and contributing to approximately 60.00% of the total industrial and agricultural production value. However, the Huangshui River Basin is highly sensitive to global climate change and undergoes significant ecological and environmental pressures. Therefore, it is an area of key implementation for various national and local ecological conservation policies and projects. Since the 1970s, the Qinghai provincial government has implemented various specialized ecological protection and construction projects in the Huangshui River Basin to protect the ecological environment and promote ecological development. These projects, including the Grain for Green project and afforestation in the northern and southern mountains, have achieved certain phased results. The implementation of the Grain for Green project has demonstrably improved vegetation coverage in Northwest China, particularly in the Huangshui River Basin, thereby mitigating soil erosion and water loss (Wu et al., 2016). Concurrent with the restoration of vegetation coverage, the land use patterns in the basin have also undergone substantial transformations. Moreover, within the broader context of global warming and urbanization, these transformations have significantly impacted the ecological environment and the provision of ecosystem services of the basin (Gong et al., 2019). Water conservation, as an important ecological service function of terrestrial ecosystems, has significant implications for flood storage, peak reduction, water purification, and runoff regulation. It serves as an important indicator reflecting the status of regional ecological systems (Gong et al., 2017). While ecological restoration projects can improve regional ecological service functions and enhance the water conservation capability, in the broader context of global warming and urbanization, further research is needed to systematically elucidate the mechanisms by which climate change and ecological restoration projects impact the water conservation function (Lv et al., 2019). Influenced by the global trend of climate warming and humidification, the overall situation of the ecological environment in the Huangshui River Basin has not been fundamentally reversed despite localized improvements. Therefore, there is an urgent need to conduct a systematic research on the water conservation function of this basin, particularly regarding the spatiotemporal evolution and underlying driving mechanisms, which will contribute to a scientific understanding of the water resource protection capacity of the ecological system, the formulation of scientifically reasonable decisions for environmental protection, the maintenance of water resources of the ecological system, and the balance between ecological conservation and economic development in this basin.
The water conservation function is closely associated with factors such as land use/land cover (LULC), vegetation coverage, litter, and soil (Zang et al., 2010). Prominent models for analyzing water conservation function include the Soil and Water Assessment Tool (SWAT) (Lin et al., 2020; Azimi et al., 2021; Qiao et al., 2023), Distributed Time Variant Gain Model (DTVGM) (Xia et al., 2019; Liu et al., 2020; Azimi et al., 2021; Huang and Yu, 2021), and Integrated Valuation of Ecosystem Services and Tradeoffs (InVEST) model (Li et al., 2021b; Jia et al., 2022; Yan et al., 2023). The InVEST water yield model, which is grounded in water balance theory, provides a more precise depiction of regional water yield characteristics and spatiotemporal variation in water conservation function and is thus widely employed in water conservation and water yield research. Its applications in China include studies in the Yellow River Basin (Che et al., 2022; Zhang et al., 2022; Zuo et al., 2023), Shiyang River Basin (Wang et al., 2023), Qinghai-Xizang Plateau (Liu and Zhao, 2023; Wen et al., 2023), Poyang Lake (Chen et al., 2022; Qin et al., 2024), Yangtze River Basin ( Zhang et al., 2021; Yang et al., 2023), Danjiang Basin (Li et al., 2021b), and Dongting Lake (Hu et al., 2021). Previous research on water conservation function has focused predominantly on the quantitative evaluation at regional scales, the identification of key factors in spatial patterns, the examination of spatiotemporal evolution characteristics, and the investigation of response relationships of water conservation with individual driving factors via the InVEST model (Liu et al., 2021). Researchers frequently employ correlation analysis, principal component analysis, and trend analysis to investigate the factors driving water conservation variations or simulate the responses of water conservation function to climate change and land use alterations by making scenario assumptions, with limited consideration of the spatial heterogeneity of these driving factors (Jia et al., 2022). Research indicated that various factors significantly influenced the variation in water conservation function. Climatic factors, especially precipitation, were the primary drivers of inter-annual variations in water conservation function (Wei et al., 2021; Li et al., 2022b; Pan and Yin, 2023). LULC changes were important factors affecting the water conservation function (Li et al., 2021a; Jia et al., 2022). Factors such as landscape heterogeneity, vegetation coverage, and evaporation had significant impacts on water conservation function (Hu et al., 2020; Wei et al., 2021). Climate change, soil conditions, and socio-economic factors collectively influenced the spatiotemporal dynamics of regional water conservation function (Wang et al., 2022; Chen et al., 2024; Zhou et al., 2024). The key driving factors of water conservation function varied across different geographical regions (Xue et al., 2022; Sun et al., 2023; Yan et al., 2023). The Huangshui River Basin presents unique climatic conditions and a complex LULC change process, necessitating the identification and construction of key factors influencing its water conservation function in a comprehensive and systematic manner. The scientific rigor and accuracy of identifying key driving factors can be improved by establishing a multifactor evaluation system and selecting driving factors from various perspectives (Scordo et al., 2018). Additionally, integrating socio-economic changes into the analysis of driving factors can help better elucidate the underlying driving mechanisms (Awotwi et al., 2017). Moreover, interactive exploration of driving factors allows for analysis of the reasons for changes at a potential level and often provides stronger explanatory power than single factors do (Liu et al., 2023).
This study takes the Huangshui River Basin as a case study. Using the InVEST model, we quantitatively evaluated the water conservation function in this basin, followed by an analysis of the variation in water conservation function due to LULC changes and climate change. Building on this foundation, we incorporated the machine learning technique to comprehensively assess the impacts of geographical conditions, climatic factors, vegetative biophysical factors, and socio-economic factors. This technique elucidated the key determinants affecting the water conservation function. Additionally, we employed the geographical detector (Geodetector) to explore the interactions among driving factors, thereby enhancing the precision in determining driving factors. The findings provide crucial insights for water ecological protection and sustainable water resource utilization in the Huangshui River Basin.

2 Materials and methods

2.1 Study area

The Huangshui River Basin is located in the northwestern region of China (36°02′-37°28′N, 100°42′-103°01′E; 1695-4870 m a.s.l.; Fig. 1). Covering areas in Qinghai Province and Gansu Province, the basin is integral to the national strategic framework of the "Lanzhou-Xining City Group". The Huangshui River, which acts as the primary tributary of the upper Yellow River, plays a crucial role in the water supply of the basin. Originating from Haiyan County, Qinghai Province, the main stream of the Huangshui River flows into the Yellow River at Yongjing, Gansu Province, spanning a total distance of 374 km. Characterized by arid and semi-arid conditions, the basin experiences an average annual precipitation of approximately 500.00 mm, and the evaporation varies from 1100.00 to 1800.00 mm. The annual water resources of the basin total 2.16×10⁹ m3, with per capita arable land water resources constituting only one-third of the national average, indicating severe water scarcity in the basin. To address the water supply, flood control, and power generation needs, numerous reservoir and water diversion projects have been implemented in the basin. Currently, the water resource utilization rate of the basin is 60.00%, exceeding the internationally accepted sustainable limit of 40.00%. Extensive exploitation and utilization have led to environmental degradation in the basin, resulting in issues such as soil erosion and water contamination, thus establishing it as a notable area with significant water ecological challenges.
Fig. 1 Overview of the Huangshui River Basin based on digital elevation model (DEM)

2.2 Data sources

To employ the InVEST model for analyzing the water conservation function in the Huangshui River Basin from 2000 to 2020, this study required the acquisition and retrieval of relevant data, including water production module data and water conservation module data. In addition, driving factors data were also obtained for analysis of the driving mechanisms of variations in water conservation function. The detailed sources and processing methods of these data are outlined in Table 1. We unified the spatial data projection to WGS 1984 UTM Zone-48N and resampled the raster resolution to 30 m×30 m to ensure data consistency and improve model accuracy.
Table 1 Data sources and processing methods used in this study
Parameter type Unit Time period Resolution Description
LULC m 2000-2020 30 m Based on the CLCD land cover dataset from 1985 to 2021 with an overall accuracy of 80.00% (Yang and Huang, 2021) and reclassified into six LULC types (cropland, forest land, grassland, water body, construction land, and unused land)
DEM m 2013 30 m Based on the SRTM DEM data from the Geospatial Data Cloud (http://www.Gscloud.cn)
Soil properties - 2009 1 km Sourced from the HWSD dataset (http://www.fao.org/statistics/en)
Soil depth mm 1980 1 km Based on China Soil Dataset for Land Surface Simulation (http://westdc.westgis.ac.cn/)
PAWC mm 2020 250 m Taking the weighted average of all soil depths within the study area based on the global dataset provided by ISRIC (https://www.isric.org/)
Evaporation coefficient - 2000-2020 1 km Calculated from LAI according to vegetation type and quoted from the InVEST manual and existing research results
Z - 2000-2020 - Obtained by comparing the water yield calculated in the InVEST model in each year with the annual average runoff in the Qinghai Provincial Water Resources Bulletin (http://slt.qinghai.gov.cn) and trial calculation
Precipitation mm 2000-2020 1 km Based on the data from China Meteorological Data Network (http://data.cma.cn)
Annual average runoff mm 2000-2020 - Based on the data from the Qinghai Provincial Water Resources Bulletin (http://slt.qinghai.gov.cn)
SDI - 2000-2020 1 km Calculated using the precipitation and PET data
NDVI - 2000-2020 1 km Based on MOD13A3 data (https://search.earthdata.nasa.gov)
GDP 104 CNY/km2 2000-2020 1 km Sourced from China 1 km gridded GDP distribution dataset (http://www.geodata.cn/)
NLI - 2000-2020 1 km Sourced from Institute of Tibetan Plateau Research Chinese Academy of Sciences (http://data.tpdc.ac.cn)
R_depth cm 2020 250 m Sourced from global soil data (https://www.isric.org/)
Slope ° 2013 30 m Based on DEM data and processed in ArcGIS
PET mm 2000-2020 1 km Sourced from the National Tibetan Plateau Scientific Data Center (https://data.tpdc.ac.cn/zh-hans/)
TI - 2013 30 m Based on DEM data and processed in ArcGIS
Velocity - 2016 30 m Determined by referring to USDA-NRCS and InVEST instructions
Ksat mm/d 2009 1 km Calculated using clay, sand, and other data in the HWSD (https://www.fao.org/land-water/databases-and-software/hwsd/en/)

Note: LULC, land use/land cover; DEM, digital elevation model; PAWC, plant available water content; Z, seasonal constant; SDI, spatial drought index; NDVI, normalized difference vegetation index; GDP, gross domestic product; NLI, nighttime light index; R_depth, plant root depth; PET, potential evapotranspiration; TI, topographic index; Velocity, flow speed coefficient; Ksat, saturated hydraulic conductivity of the soil; CLCD, China Land Cover Dataset; SRTM, Shuttle Radar Topography Mission; ISRIC, International Soil Reference and Information Centre; LAI, leaf area index; InVEST, Integrated Valuation of Ecosystem Services and Tradeoffs; USDA-NRCS, United States Department of Agriculture Natural Resources Conservation Service; HWSD, Harmonized World Soil Database. "-" means no unit or resolution.

2.3 Methods

This study focused on the Huangshui River Basin as the research subject. First, the water yield of the basin was calculated using the InVEST model, and water conservation was determined using a modified formula. Second, the study analyzed the evolution characteristics of water conservation function in the basin and examined the effects of LULC structure and climate change on water conservation function. Finally, the study utilized the random forest model and Geodetector to comprehensively analyze the drivers of water conservation. Figure 2 shows the overall research framework.
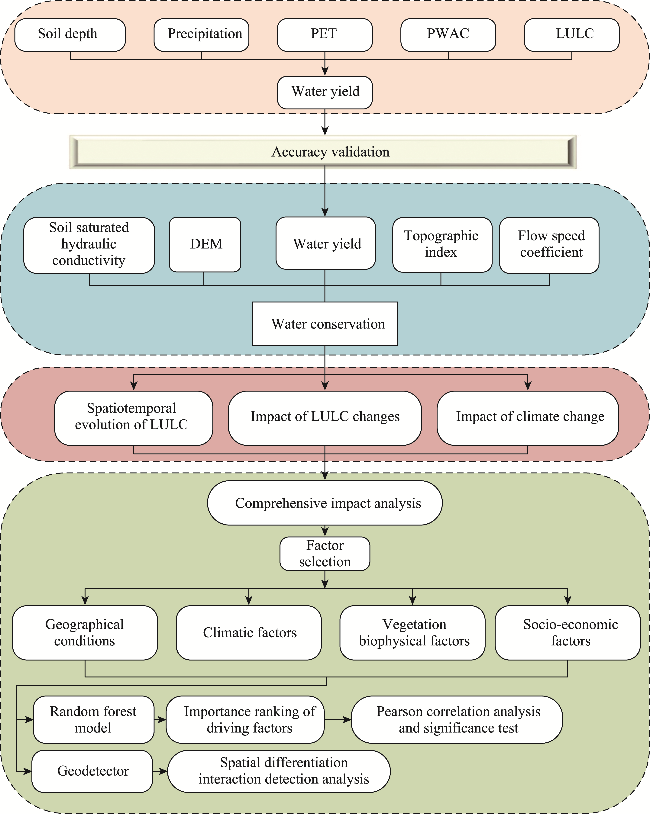
Fig. 2 Research framework of this study. PET, potential evapotranspiration; PAWC, plant available water content; LULC, land use/land cover.

2.3.1 InVEST model

The InVEST water yield model is based on the Budyko theory and the concept of water balance. It incorporates variables such as soil depth, precipitation, evapotranspiration, and plant available water content (PAWC) to simulate surface runoff, soil water content, and water yield. The calculation formulas are expressed as:
$ Y(x)=\left[1-\frac{\operatorname{AET}(x)}{P(x)}\right] \times P(x)$,
$ \frac{\operatorname{AET}(x)}{P(x)}=\frac{1+\omega(x) R(x)}{1+\omega(x) R(x)+1 / R(x)}$,
$ \omega(x)=Z \times \frac{\operatorname{AWC}(x)}{P(x)},$
$ R(x)=\frac{K_{\mathrm{c}}(x) \times \mathrm{ET}_{0}}{P(x)}$,
where Y(x) is the annual water yield depth of the raster x (mm); AET(x) is the actual evapotranspiration of the raster x for the year (mm), which is based on the Budyko equation of hydrothermal balance; P(x) is the annual precipitation of the raster x (mm); ω(x) is the nonphysical parameter of soil properties under natural climatic conditions of the raster x (dimensionless); R(x) is the Budyko dryness index; Z is the seasonal constant of the raster x; AWC(x) is the volumetric plant available water content of the raster x (mm); and Kc(x) is the vegetation transpiration coefficient of the raster x; and ET0 is the evapotranspiration of the raster x (mm).
Upon employing the InVEST model to determine the water yield, we made adjustments based on topographic features, surface runoff, and soil permeability coefficients to derive the water conservation. The calculation formulas are outlined as follows:
$ \mathrm{WC}=\min \left(1, \frac{249}{\text { velocity }}\right) \times \min \left(1, \frac{0.9 \times \mathrm{TI}}{3}\right) \times \min \left(1, \frac{K_{\mathrm{sat}}}{300}\right) \times Y,$
$ \mathrm{TI}=\lg \left(\frac{\mathrm{DA}}{\mathrm{SD} \times \mathrm{PS}}\right),$
where WC is the water conservation depth (mm); velocity is the flow speed coefficient; Ksat is the saturated hydraulic conductivity of the soil (mm/d); TI is the topographic index; DA is the number of grid cells in the catchment area; SD is the soil depth (mm); and PS is the percentage slope (%).
This study categorized the water conservation depth into five levels (level I (WC<20 mm), level II (20≤WC<60), level III (60≤WC<100), level IV (100≤WC<140), and level V (WC≥140)) via the natural breakpoint method in ArcGIS.

2.3.2 Selection of driving factors

This study selected cropland, forest land, and grassland as key indicators influence the water conservation function. Due to global warming, the Qinghai-Xizang Plateau has recently experienced a warming trend, intensifying the hydrological cycle in the Huangshui River Basin (Wu et al., 2023). This study took the spatial drought index (SDI) as an indicator of climatic conditions, which is a crucial parameter in the water cycle and closely associated with various surface processes (Zhao et al., 2022). Additionally, vegetation in a basin is highly sensitive to climate change, thus the normalized difference vegetation index (NDVI) was selected as an indicator of vegetation, which can effectively reflect surface vegetation coverage (Meng et al., 2020; Wu et al., 2023). Gross domestic product (GDP) is a primary driving force behind changes in land use and NDVI (Guo et al., 2016), and there is a strong correlation between nighttime light index (NLI) and GDP (Qin et al., 2023). Consequently, GDP and NLI were chosen as socio-economic factors. The input parameters in the InVEST model including precipitation, PET, topographic index, digital elevation model (DEM), slope, PAWC, and plant root depth (R_depth) were also selected as indicators. In summary, 14 indicators were selected as driving factors for further impact analysis from four aspects, including geographical conditions, climatic factors, vegetation biophysical factors, and socio-economic factors.

2.3.3 Random forest model

Random forest, a supervised machine learning algorithm, consists of multiple decision trees, with output categories determined by the plurality of categories each tree produces. Initially, random forest is known for its high accuracy, adaptability, and robustness against multicollinearity. They are suitable for both classification and regression tasks, and can effectively handle diverse datasets and scenarios. This study constructed a random forest regression model using a dataset of 15,390 matched samples, where 14 driving factors were considered explanatory variables, and the multi-year average of water conservation depth served as the dependent variable. Pearson correlation coefficient was utilized to assess the impact of explanatory variables on water conservation. The dataset was divided into training and testing sets at an 8:2 ratio, with the optimal model identified through parameter optimization techniques. The key parameters for the random forest model are the number of variables preselected at each node of a regression tree (mtry) and the number of trees generated in the forest (ntree). These parameters were determined experimentally. For the 2000 data, the model prediction error was minimized when mtry=5. For the 2020 data, the error was minimized when mtry=6. Additionally, when ntree exceeded 150, the model stabilized. Therefore, we chose mtry=5 (for 2000), mtry=6 (for 2020), and ntree=200 as the key parameters for constructing the random forest model in this study.

2.3.4 Geodetector

The Geodetector is a statistical technique used to identify spatial heterogeneity and elucidate underlying causal factors (Wang and Xu, 2017). It encompasses factor identification, interaction analysis, risk assessment, and ecological evaluation. This study employed the factor identification and interaction analysis components of the Geodetector to examine the determinants influencing the water conservation function within the study area. In this context, the water conservation depth was designated as the dependent variable Y, whereas 12 driving factors (with LULC taken as a driving factor in place of cropland, forest land, and grassland) were discretized using the R programming language to form the independent variable X. Subsequently, the Geodetector was used to compute the statistical parameter q, which elucidated the influence and strength of different factors and their interactions on the spatial differentiation of water conservation function (Gao et al., 2023). The interaction types are detailed in Table 2.
Table 2 Criteria for factor interactions in this study
Criterion Interaction type
q(X1X2)<min[q(X1), q(X2)] Nonlinear reduction
min[q(X1), q(X2)]<q(X1X2)<max[q(X1), q(X2)] Single-factor nonlinearity reduction
q(X1X2)>max[q(X1), q(X2)] dual-factor enhancement
q(X1X2)=q(X1)+q(X2) Independent
q(X1X2)>q(X1)+q(X2) Nonlinear enhancement

Note: q represents the explanatory power of driving factors to the spatial differentiation of water conservation; X1 and X2 represent the factors involved in interaction.

3 Results

3.1 Model validation

This study initially calibrated the parameter Z with annual average runoff from the Qinghai Provincial Water Resources Bulletin (2000-2020), and computed the water yield of the Huangshui River Basin in the InVEST model (Fig. 3). The simulated multi-year average water yield depth from 2000 to 2020 was 157.32 mm, closely approximating the observed multi-year average of 161.86 mm, with an average error rate of 2.80%, which suggested that the simulation results were highly accurate and the Z values were appropriately set in the study.
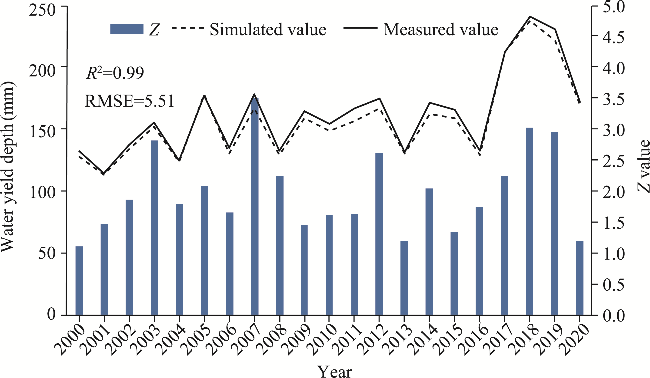
Fig. 3 Calibration of the parameter Z and validation of the simulated water yield depth in the Huangshui River Basin from 2000 to 2020. Z, seasonal constant; RMSE; root mean square error.

3.2 Spatiotemporal evolution of water conservation function

3.2.1 Inter-annual variability in water conservation function

Figure 4 shows the temporal variation in water conservation depth of the Huangshui River Basin from 2000 to 2020. The results revealed that the multi-year average water conservation depth was 103.79 mm. The maximum depth of 164.39 mm occurred in 2018 and the minimum depth of 68.13 mm occurred in 2000. Over the 21-a period, the overall trend indicated an increase in water conservation depth, with a rate of 26.16 mm/10a.
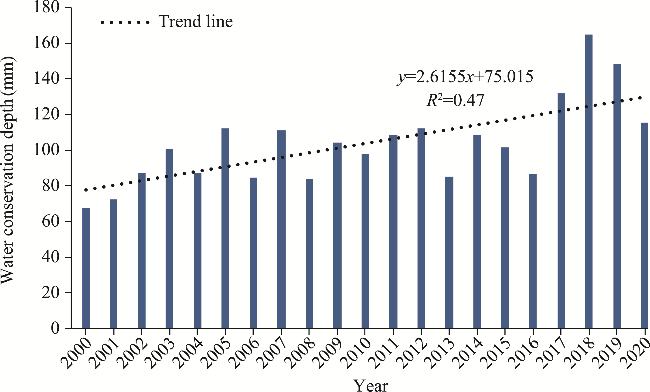
Fig. 4 Temporal variation in water conservation depth of the Huangshui River Basin from 2000 to 2020

3.2.2 Spatial variation in water conservation function

Spatially, the regions with high water conservation capacity (levels IV and V) were predominantly located in the northern high-latitude areas, particularly in the upper basin regions (Fig. 5a and b). Conversely, regions with low water conservation capacity (levels I, II, and III) were clustered in the southeastern low-latitude areas, particularly in the middle and lower basin regions. Several factors contributed to the high water conservation capacity in the northern high-latitude areas. First, these areas exhibited high vegetation coverage, enhancing the water conservation capability. Second, the northern high-latitude areas received ample annual precipitation with low evaporation, unlike southeastern low-latitude areas characterized by low precipitation and high evaporation. Third, the northern high-latitude areas served as the source of upstream rivers in the Huangshui River Basin, which boast significant water volume and flow, thereby demonstrating a distinct water conservation capacity. Conversely, the middle and lower basin regions experienced substantial surface runoff and exhibited poor water conservation function. The total water conservation across different levels ranked as III>II>IV>V>I in 2000, whereas in 2020, the order shifted to V>III>IV>II>I (Fig. 5c). Notably, the changes observed in levels IV and V surpassed those in other levels, with levels IV and V increasing by 65.32% and 328.80%, respectively; this underscored the pivotal role of levels IV and V in driving alterations in total water conservation. The total water conservation in 2000 reached 1125.11×106 m3, representing an increase of 60.07% to 675.92×10⁶ m3 two decades later, indicating a notable increase in total water conservation following the implementation of the Grain for Green project. Structural changes in water conservation function are depicted in Figure 5d, which illustrated a shift from predominantly levels I, II, and III in 2000 to levels III, IV, and V in 2020. The transition of levels I, II, and III to higher levels was more pronounced, suggesting that these levels possess a greater dynamic range and potentially exert a greater influence on water conservation alterations.
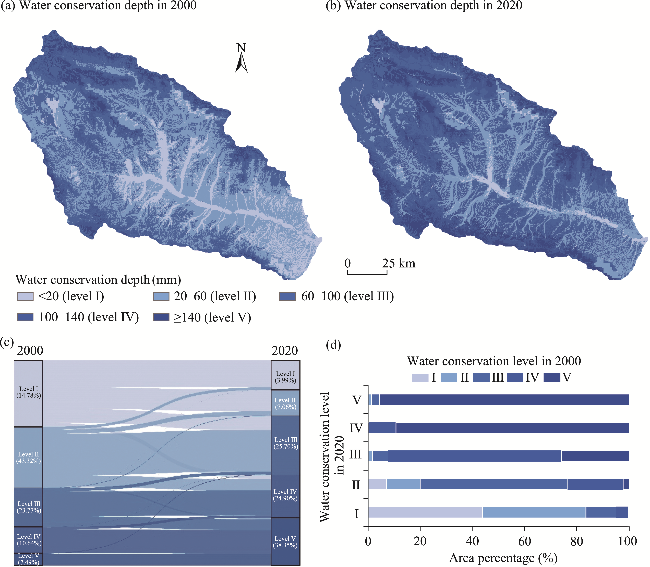
Fig. 5 Spatial variation in water conservation depth (a and b) and area transfer among different water conservation levels (c and d) in the Huangshui River Basin from 2000 to 2020

3.3 Spatial evolution of LULC

The spatial distribution patterns of LULC within the Huangshui River Basin in 2000 and 2020 are illustrated in Figure 6a and b. Notably, cropland and grassland exhibited the most extensive distributions and significant changes across the Huangshui River Basin. Cropland, forest land, and grassland constituted larger area proportions in the Huangshui River Basin, whereas other LULC types represented smaller proportions. Over the 21-a period, there was a notable decrease in cropland, which was juxtaposed with a significant increase in grassland. Moreover, substantial changes were observed in water body, construction land, and unused land. Figure 6c and d indicate that the order of area changes for each land cover type from 2000 to 2020 is cropland> grassland>forest land>unused land>construction land>water body, whereas that for the area percentage change is construction land>unused land>water body>cropland>grassland>forest land. The results underscored the substantial alterations in the LULC patterns within the Huangshui River Basin following the initiation of projects in Qinghai Province aimed at converting cropland to forest land and grassland since 2000. Changes in cropland and grassland areas were most pronounced, while construction land and unused land experienced the greatest area percentage changes. The regional water conservation function is anticipated to be significantly impacted by these changes.
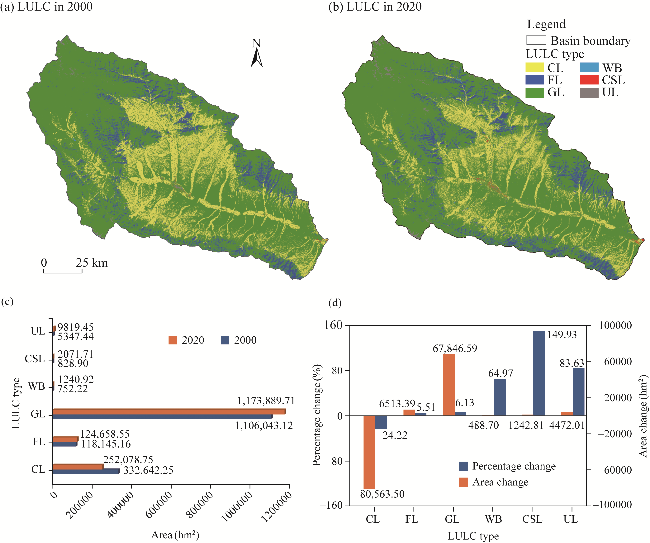
Fig. 6 Spatial variation in LULC (a and b) and changes in area of each LULC type (c and d) in the Huangshui River Basin from 2000 to 2020. CL, cropland; FL, forest land; GL, grassland; WB, water body; CSL, construction land; UL, unused land.
As shown in Table 3, the conversion rates of other LULC types to grassland and forest land were relatively high during 2000-2020, with 32.53% of cropland, 13.36% of forest land, 20.15% of water body, and 18.46% of construction land converted to grassland, and 0.35% of cropland, 1.92% of grassland, and 0.11% of water body converted to forest land. This indicated that the conversion between grassland and cropland may be the main factor driving the changes in the LULC pattern. Figure 7a and b exhibit significant variations in LULC structure over the 21-a period, which may be a key factor affecting changes in water conservation function.
Table 3 LULC transfer matrix of the Huangshui River Basin from 2000 to 2020 (unit: hm2)
2020
CL FL GL WB CSL UL
2000 CL 222,192.00 1155.96 108,218.00 211.68 351.72 513.81
FL 45.18 102,311.00 15,785.50 1.08 0.00 2.79
GL 29,797.00 21,191.20 1,048,750.00 502.47 712.35 5093.46
WB 18.72 0.81 151.56 457.56 5.76 117.81
CSL 0.63 0.00 1.17 7.38 819.72 0.00
UL 25.65 0.00 987.30 60.75 182.16 4091.58
Total 252,079.18 124,658.97 1,173,893.53 1240.92 2071.71 9819.45

Note: CL, cropland; FL, forest land; GL, grassland; WB, water body; CSL, construction land; UL, unused land.

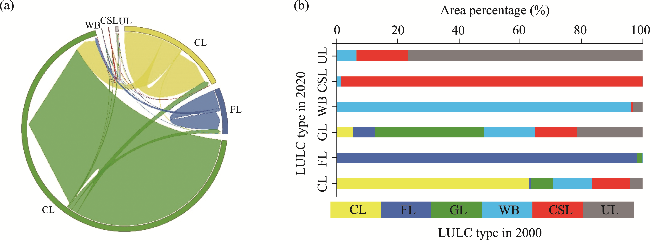
Fig. 7 Structure chart (a) and area percentage (b) showing the transfers among different LULC types in the Huangshui River Basin from 2000 to 2020

3.4 Impact of LULC changes on water conservation function

Variation in total water conservation with the transfers among different LULC types from 2000 to 2020 indicated several key observations (Table 4). First, alterations in LULC led to shifts in total water conservation by facilitating water redistribution. The transitions across various LULC types consistently demonstrated a positive impact on water conservation function. Notably, the transitions of grassland with other LULC types increased the total water conservation by 498.87×10⁶ m3, constituting 73.89% of the total water conservation transfer. Second, in 2020, the increase in total water conservation resulting from the transitions of different LULC types to cropland, forest land, and grassland were recorded at 69.71×10⁶, 62.44×10⁶, and 541.39×10⁶ m3, respectively, constituting 10.33%, 9.25%, and 80.19% of the total water conservation transfer, respectively. These outcomes suggested that the transitions of different LULC types to cropland, grassland, and forest land have been the primary drivers of the observed increase in total water conservation of the basin.
Table 4 Variation in total water conservation with the transfers among different LULC types in the Huangshui River Basin from 2000 to 2020 (unit: ×106 m3)
2020
CL FL GL WB CSL UL Total
2000 CL 59.92 0.59 55.16 0.01 0.11 0.23 116.01
FL 0.01 50.49 9.07 0.00 0.00 0.00 59.57
GL 9.78 11.36 476.88 0.03 0.14 0.68 498.87
WB 0.00 0.00 0.03 0.04 0.00 -0.01 0.06
CSL 0.00 0.00 0.00 0.00 0.14 0.00 0.14
UL 0.01 0.00 0.26 0.01 0.02 0.18 0.48
Total 69.71 62.44 541.39 0.09 0.41 1.09 675.13
Table 5 shows the distribution of the total water conservation among various LULC types in the Huangshui River Basin. Notable shifts in total water conservation were observed in cropland and grassland. In 2020, a decrease of 3.04% in proportion of total water conservation was observed in cropland compared with that in 2000, whereas the proportion increased by 3.32% in grassland. Conversely, the proportions for water body, construction land, and unused land remained consistently low, with insignificant changes noted over the 21-a period. By integrating the findings from Table 3, it was evident that the reduction in cropland area was associated with a decline in proportion of total water conservation in cropland, whereas an expansion in grassland area was correlated with an increase in proportion of total water conservation in grassland. These outcomes underscored that the transition from cropland to forest land and grassland was the primary factor in augmenting water conservation function, whereas changes in areas of water body, construction land, and unutilized land had minimal impacts on water conservation dynamics.
Table 5 Variation in proportion of total water conservation for each LULC type in the Huangshui River Basin from 2000 to 2020
Year Proportion (%)
CL FL GL WB CSL UL
2000 12.32 8.20 79.18 0.01 0.02 0.27
2020 9.28 7.78 82.50 0.02 0.01 0.41
Change -3.04 -0.42 3.32 0.01 -0.01 0.14

3.5 Impact of climatic factors on water conservation function

Climate change plays a crucial role in affecting the water conservation dynamics. Figure 8 shows the spatial distribution of the correlation of water conservation depth with precipitation, potential evapotranspiration (PET), and temperature in the Huangshui River Basin during 2000-2020. The correlation coefficients between water conservation depth and precipitation ranged from -0.50 to 1.00, with an average value of 0.74, indicating an overall positive correlation (Fig. 8a1). Conversely, the correlation coefficients between water conservation depth and PET ranged from -0.79 to 0.37, with an average value of -0.52, demonstrating an overall negative correlation (Fig. 8b1). Furthermore, the correlation coefficients between water conservation depth and temperature varied from -0.86 to 0.79, with an average value of -0.01, indicating nonsignificant correlation (Fig. 8c1). Notably, the regions where water conservation depth was significantly positively correlated with precipitation represented 88.81% of the study area (Fig. 8a2). Similarly, the regions where water conservation depth was significantly negatively correlated with PET covered 88.26% of the study area (Fig. 8b2). Moreover, the regions where water conservation depth was significantly positively correlated with temperature constituted 7.05% of the study area (Fig. 8c2). The findings indicated that precipitation and PET were the primary climatic factors affecting water conservation dynamics in the Huangshui River Basin. Specifically, the regions where water conservation depth was significantly positively correlated with precipitation were predominantly concentrated in the middle and upper reaches of the basin with abundant vegetation, thick soil layers, and high precipitation storage capacity. Conversely, the regions where water conservation depth was significantly negatively correlated with PET were situated mainly in the northern and southern regions in the middle and lower reaches of the basin, where dense forest cover led to an increase in evapotranspiration and a reduction in water conservation capacity.
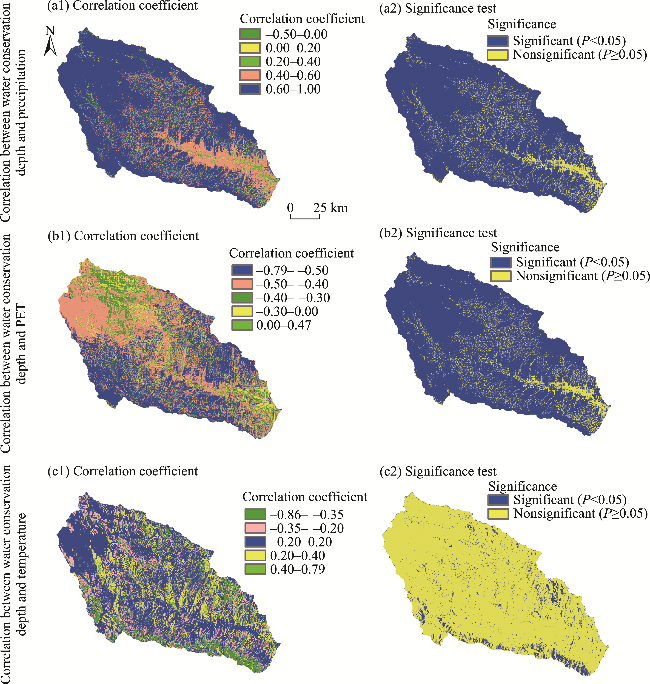
Fig. 8 Correlation of water conservation depth with precipitation (a1 and a2), PET (b1 and b2), and temperature (c1 and c2) in the Huangshui River Basin during 2000-2020

3.6 Comprehensive impact analysis for water conservation function

3.6.1 Single-factor impact analysis

The outcomes regarding the importance of driving factors in 2000 are illustrated in Figure 9a. In conjunction with the cross-validation curve results, it was observed that with mtry=5, the random forest exhibited the lowest prediction error rate, achieving a regression accuracy of 88.32%. The top five indicators in terms of the importance (precipitation, PAWC, grassland, GDP, and forest land) were the most critical driving factors for water conservation function in the Huangshui River Basin in 2000. Figure 9b shows the importance ranking of driving factors in 2020. Considering the cross-validation findings, when mtry=6, the random forest displayed the lowest prediction error rate, achieving a regression accuracy of 91.34%. The top six indicators in terms of importance (grassland, GDP, forest land, PAWC, precipitation, and R_depth) were the most influential factors for water conservation function in the Huangshui River Basin in 2020. The correlation analysis results for 2000 and 2020 showed significant consistency (Fig. 9c and d). Among the climatic factors, precipitation exhibited a strong positive correlation with water conservation, while PET demonstrated a statistically significant negative correlation with water conservation. This suggested that precipitation and PET are responsive to water conservation function, with increased precipitation promoting water conservation and PET hindering it. Grassland and forest land were notably positively correlated with water conservation, emphasizing that increasing the coverage of forest land and grassland can improve water conservation function. SDI was strongly negatively correlated with water conservation, suggesting that regions with drier climate tend to have poor water conservation function. Conversely, DEM exhibited a substantial and favorable correlation with water conservation. Among the biophysical indicators related to vegetation, PAWC had a strong positive correlation with water conservation, implying that increasing the R_depth and PAWC can be advantageous for bolstering water conservation efforts. Among socio-economic factors, GDP was negatively correlated with water conservation, indicating that economic progress may come at the expense of environmental preservation, leading to a decrease in water conservation.
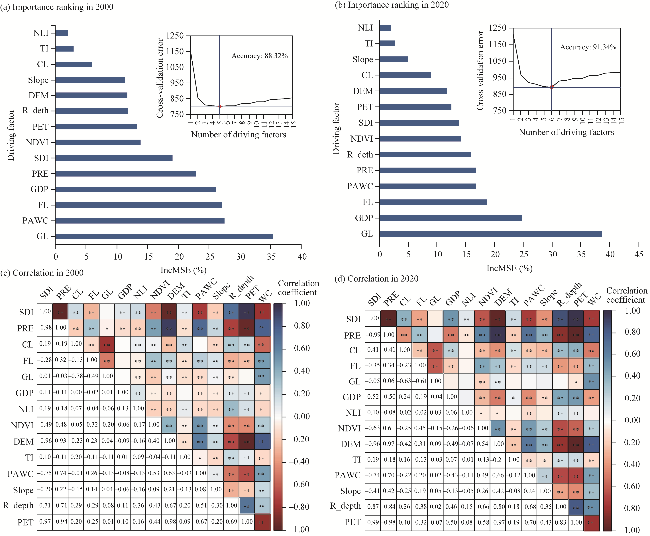
Fig. 9 Importance ranking of driving factors and corresponding cross-validation curve (a and b) and results of Pearson correlation analysis (c and d) in 2000 and 2020. NLI, nighttime light index; TI, topographic index; R_depth, plant root depth; NDVI, normalized difference vegetation index; SDI, spatial drought index; PRE, precipitation; GDP, gross domestic product; WC, water conservation depth; IncMSE, percentage of increase of mean square error. *, P<0.05 level; **, P<0.01 level.

3.6.2 Factor interactions driving the spatial differentiation of water conservation function

Factor detection highlighted the explanatory power of driving factors concerning the spatial differentiation of water conservation function (Table 6). For example, in 2000, the q-values of driving factors ranked in descending order as: SDI, PET, DEM, precipitation, R_depth, LULC, topographic index, GDP, PAWC, slope, NDVI, and NLI. With the exception of NLI, all other driving factors significantly impacted the water conservation function (P<0.01). Notably, the SDI, PET, DEM, precipitation, R_depth, and LULC exhibited relatively high q-values, indicating that these six factors played pivotal roles in impacting the spatial differentiation of water conservation function. This finding closely aligns with the correlation analysis results in Section 3.6.1, underscoring the methodological reliability of this study. Furthermore, the q-value of LULC increased from 0.396 to 0.444 between 2000 and 2020, suggesting that policy initiatives involving the conversion of cropland to forest land and grassland effectively enhanced the water conservation function in the Huangshui River Basin. Geographical and climatic conditions emerged as the primary factors influencing the water conservation function in the basin, followed by socio-economic factors and vegetation biophysical factors. Interaction detection consistently demonstrated that the combined impact of any two factors on the spatial differentiation of water conservation function was more significant than the individual impact of each factor (Fig. 10). The interactions primarily exhibited two forms: dual-factor enhancement and nonlinear enhancement. In case of 2000, the q-values of LULC and precipitation were 0.396 and 0.607, respectively, whereas the q-value of the combination of LULC and precipitation reached 0.878, thus demonstrating a dual-factor enhancement. Similarly, the q-values of PAWC and GDP were 0.105 and 0.151, whereas the q-value of the combination of PAWC and GDP was 0.244, indicating a dual-factor enhancement. In summary, the spatial differentiation of water conservation function in the Huangshui River Basin was determined by the synergistic effects of multiple factors.
Table 6 Explanatory power (q) of driving factors concerning the spatial differentiation of water conservation in the Huangshui River Basin in 2000 and 2020
Indicator type Driving factor 2000 2020
q Sort q Sort
Geographical conditions LULC 0.396 6 0.444 6
Slope 0.068 10 0.078 10
TI 0.163 7 0.183 7
DEM 0.730 3 0.623 2
Climatic factors Precipitation 0.607 4 0.553 4
PET 0.751 2 0.621 3
SDI 0.758 1 0.662 1
Vegetation biophysical factors PAWC 0.105 9 0.114 9
R_depth 0.507 5 0.497 5
NDVI 0.065 11 0.042 11
Socio-economic factors GDP 0.151 8 0.183 8
NLI 0.013 12 0.081 12
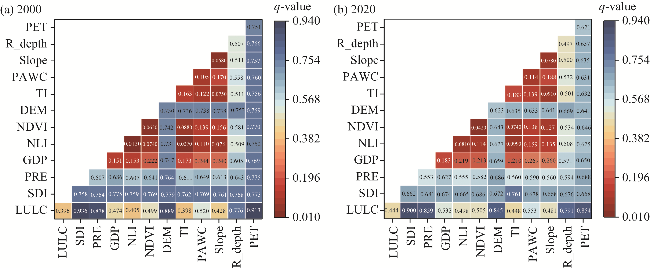
Fig. 10 Results of interaction detection showing the combined effect of any two driving factors on the spatial differentiation of water conservation in the Huangshui River Basin in 2000 (a) and 2020 (b). q-value represents the explanatory power of driving factors.

4 Discussion

4.1 Spatiotemporal evolution characteristics of water conservation function

From 2000 to 2020, the multi-year average water conservation depth was 103.79 mm. The maximum depth of 164.39 mm occurred in 2018, whereas the minimum depth of 68.13 mm occurred in 2000. Over the 21-a period, the overall trend indicated an increase in water conservation depth. This finding aligns with recent studies (Li et al., 2022a; Liu et al., 2023; Yan et al., 2023), highlighting the efficacy of ecological conservation projects. The water conservation in the basin showed lower levels in the southeast and higher levels in the northwest, attributed to two primary factors. First, climatic conditions vary across regions, and a strong correlation between precipitation and water conservation can be observed (Fig. 8a). This perspective is supported by previous research (Eekhout et al., 2020; Li et al., 2021b; Liu et al., 2023). As the main source of water conservation, precipitation plays a crucial role in shaping water distribution across different regions. Second, vegetation types and LULC indirectly affect the water conservation function through alterations in soil properties (Yan et al., 2023). The northwest of the basin, dominated by forest and alpine meadow ecosystems, features fine soil particles and rich organic content, offering excellent water-holding capacity. Additionally, higher soil moisture supports plant growth and robust vegetation effectively retains moisture, leading to increased water conservation. In contrast, sparse forests and alpine meadows in the southeast of the basin result in lower water conservation levels.

4.2 Ecological effects of the Grain for Green project on water conservation function

The initiation of the Grain for Green project in the Huangshui River Basin has significantly altered the local land use patterns and facilitated improvements in water conservation function. From 2000 to 2020, the cropland area decreased by 5.15%, whereas the forest land and grassland areas increased by 0.42% and 4.34%, respectively. The proportion of total water conservation for cropland decreased by 3.04%, whereas the proportions for forest land and grassland increased by 0.42% and 3.32%, respectively. In the study area, forest land and grassland are predominantly located in the northwestern part of the basin. These regions exhibit high vegetation coverage, resulting in strong interception and relatively enhanced water conservation function. Conversely, cropland is located mainly in the southeast of the basin. Compared with forest land and grassland, cropland has lower vegetation coverage, weaker interception, and diminished water conservation capacity (Chen et al., 2020). Research findings indicated that transitioning other LULC types to forest land and grassland can effectively enhance regional water conservation function. Scholars have observed that following ecological restoration efforts in the Three Rivers Source area of China in 2005, the expansion of forest land and grassland, among other LULC alterations, emerged as primary factors enhancing the water conservation function (Zhou et al., 2023). Research on water conservation changes in Heilongjiang Province of China found a direct relationship between water conservation, precipitation, and forest and grass coverage (Qiao et al., 2023), aligning with the conclusions drawn in this study.

4.3 Main driving factors of water conservation function

Between 2000 and 2020, the key factors influencing the water conservation function in the Huangshui River Basin remained consistent. The results indicated a significant positive correlation between water conservation depth and precipitation, and a significant negative correlation between water conservation depth and PET, aligning with previous research (Wei et al., 2021; Pan and Yin, 2023; Wen et al., 2023; Yan et al., 2023). Additionally, the findings revealed that grassland, forest land, and PAWC were also crucial factors influencing the water conservation function. This conclusion is consistent with analyses of the Yellow River Basin, Yangtze River Basin, and Qilian Mountains in China (Hu et al., 2020; Jia et al., 2022; Sun et al., 2023). Variations in vegetation morphology and structure, R_depth, and water conservation function exist among different LULC types (Wu et al., 2023), with forest land exhibiting the strongest water conservation function, followed by grassland and cropland (Hu et al., 2022). In the Huangshui River Basin, the extensive conversion of cropland to forest land and grassland over the 21-a period has substantially increased vegetation coverage. The restoration of forest land and grassland has the potential to enhance R_depth, thereby playing a pivotal role in soil stabilization (Guan et al., 2020) and increasing the PAWC (McLauchlan et al., 2006). Vegetation restoration and increased R_depth can enhance soil water conservation capacity and boost water conservation function of the basin. Zhou et al. (2024) analyzed the driving factors of water conservation function in the coastal areas of China, revealing a significant negative correlation between water conservation and GDP. Our study indicated that GDP in the Huangshui River Basin was a major driving factor for water conservation function, showing a negative correlation with water conservation. Notably, the negative impact of GDP on water conservation function became more pronounced in 2020 compared with 2000. The increase in GDP has led to changes in the LULC pattern, including the expansion of impermeable surfaces, degradation of natural vegetation, reduced soil permeability and water conservation capacity, increased surface runoff and soil erosion, and a decline in water conservation function of the basin. Since the 1970s, various ecological protection and development initiatives, such as the conversion of cropland to forest land and the afforestation of the northern and southern mountains, have been progressively implemented, resulting in incremental achievements. Nevertheless, the ecological landscape of the Huangshui River Basin remains highly delicate and vulnerable. The basin is characterized by low vegetation coverage, severe soil erosion, and persistent issues of soil and water loss. It is imperative to intensify efforts towards the protection and rehabilitation of the Huangshui River Basin. Governmental authorities should prioritize land use planning and structural adjustments in their decision-making processes. It is suggested to emphasize the establishment of sponge cities, enhance vegetation coverage, and further advance the development of floodplains and green infrastructure to effectively enhance water conservation function within the basin.

4.4 Factor interactions driving the spatial differentiation of water conservation function

The water conservation function in a region can be influenced by climate, vegetation, and human activities, as well as their interactions (Gao et al., 2023; Pan and Yin, 2023). This study revealed that the most significant interactive combinations affecting water conservation in the Huangshui River Basin were LULC and SDI, LULC and precipitation, and LULC and PET (all with q-values greater than 0.85). These findings indicated that changes in water conservation in the Huangshui River Basin were driven primarily by both climate and LULC. Therefore, ecological restoration planning and specific engineering measures can be optimized based on these significant interactions. Refining project zoning based on regional climate elements and optimizing forest and grass species based on precipitation and evapotranspiration can increase vegetation diversity. Increasing the proportion of measures that promote the interception capacity can increase water conservation in a region (Levia and Herwitz, 2005). From 2000 to 2020, there was a significant improvement in the interaction impact of LULC with factors such as NDVI, PWAC, and R_depth on water conservation function in the Huangshui River Basin. The intentional transition of certain land areas from cropland to forest land and grassland resulted in increased NDVI, PAWC, and R_depth over the 21-a period. This observation aligns with the findings of random forest analysis that emphasized the positive impact of LULC alterations on enhancing water conservation function. In contrast, the interaction impact of GDP with factors such as NDVI and R_depth significantly decreased. This decline suggested that urban economic expansion and development resulted in the conversion of certain original cropland and grassland into construction land, thereby reducing water conservation capacity in these regions. Therefore, it is crucial for urban economic development strategies to prioritize ecological preservation efforts and enhance the diversity of forest land, grassland, and wetland ecosystems within the Huangshui River Basin. The synergistic effects of various driving factors had a greater impact on the spatial differentiation of water conservation in the Huangshui River Basin. In practice, it is essential to consider these interactions comprehensively (Chen et al., 2020).

4.5 Limitations and prospects

This study validated the water yield calculated by the InVEST model using data from the Qinghai Province Water Resources Bulletin, and corrected the water yield based on terrain characteristics, soil permeability, and surface runoff coefficients, resulting in improved research accuracy. Furthermore, this study explored the driving factors of water conservation in the Huangshui River Basin and investigated the interactions among these factors. The comprehensive nature of the study enhanced the objectivity of the research findings. The InVEST model was employed to quantify water conservation, predominantly focusing on vertical water quantity changes while insufficiently accounting for horizontal changes such as surface runoff. The input parameters relied on multi-year averages and failed to incorporate the effects of climate change. The soil properties in the study were derived from a 1:1,000,000 soil map of China, which lacks the resolution necessary for research at the basin scale, thus impacting the accuracy of water conservation assessments. The upper Huangshui River Basin is sustained by snowmelt runoff; however, the InVEST model overlooks critical factors such as permafrost and ice melt. An integrated approach that combines ecological, hydrological, lake, permafrost, and snowmelt models can provide a comprehensive framework for studying water conservation function, thereby addressing the limitations of a single-model approach (Liu et al., 2024). The study integrated geographical conditions, climatic factors, vegetation biophysical factors, and socio-economic factors, and employed advanced analytical methods such as random forest, Pearson correlation analysis, and Geodetector to evaluate the key driving factors of water conservation, thereby enhancing the scientific rigor of the study on driving mechanisms of water conservation function. However, the need to discretize continuous data in the Geodetector model may lead to information loss. Temporally, the analysis was limited to interaction detection in 2000 and 2020, which might be influenced by abrupt climate change. Future research should consider long-term interactions among driving factors, and investigate long-term water conservation changes to elucidate the driving mechanisms of water conservation function comprehensively. The study also failed to fully consider the impact of LULC changes on the soil physical properties and eco-hydrological processes in the Huangshui River Basin. The soil parameters input into the model did not account for their temporal variations. Moreover, influenced by global warming, glacier meltwater and permafrost degradation serve as significant supplementary sources of runoff in the Huangshui River Basin, constituting crucial factors affecting the water conservation function of the basin. These aspects were not explicitly quantified in the InVEST model and warrant further in-depth investigation in the future.

5 Conclusions

This study utilized the InVEST model in conjunction with random forest, Pearson correlation analysis, and Geodetector to analyze the spatiotemporal evolution characteristics of water conservation function and identify its key driving factors in the Huangshui River Basin. Overall, during the period 2000-2020, water conservation function in the basin exhibited significant variations in terms of its spatiotemporal distribution and the hierarchical ordering of driving factors. The initiation of the Grain for Green project has positively impacted water conservation function in the basin. The driving factor analysis indicated that besides direct driving factors such as precipitation and PET related to climate change, transitions in LULC types and socio-economic factors also played crucial roles. The combination of geographical conditions, climatic factors, vegetation biophysical factors, and socio-economic factors typically led to increased explanatory power to the spatial differentiation of water conservation. It is noteworthy that against the backdrop of global climate change, the government aiming to maximize regional water conservation function should focus on the protection of existing high water conservation areas, while enhancing vegetation restoration in areas severely affected by land fragmentation. In addition to continuing the implementation of the Grain for Green Project, there is a continuous need to strengthen ecological protection.

Conflict of interest

The authors declare that they have no known competing financial interests or personal relationships that could have appeared to influence the work reported in this paper.

Acknowledgements

This research was funded by the National Key R&D Program of China (2023YFC3008502), the National Natural Science Foundation of China (52309103), the Major Science and Technology Programs of the Ministry of Water Resources (MWR) (SKS-2022002), the Chengde Applied Technology Research and Development and Sustainable Development Agenda Innovation Demonstration Zone Special Science and Technology Plan Project (202305B009), and the Qinghai Province Applied Basic Research Program (2024-ZJ-773).

Author contributions

Conceptualization: YUAN Ximin, SU Zhiwei; Methodology: YUAN Ximin, SU Zhiwei; Formal analysis: TIAN Fuchang, WANG Pengquan; Writing - original draft preparation: SU Zhiwei; Writing - review and editing: SU Zhiwei, TIAN Fuchang; Funding acquisition: YUAN Ximin, WANG Pengquan; Resources: YUAN Ximin; Supervision: TIAN Fuchang, WANG Pengquan. All authors approved the manuscript.
[1]
Awotwi A, Anornu G K, Quaye-Ballard J, et al. 2017. Analysis of climate and anthropogenic impacts on runoff in the Lower Pra River Basin of Ghana. Heliyon, 3(12): e00477, doi: 10.1016/j.heliyon.2017.e00477.

[2]
Azimi M, Barzali M, Abdolhosseini M, et al. 2021. Examining the impact of rangeland condition on water conservation by using an integrated modelling approach. Land Degradation & Development, 32(13): 3711-3719.

[3]
Che X C, Jiao L, Qin H J, et al. 2022. Impacts of climate and land use/cover change on water yield services in the upper Yellow River Basin in Maqu County. Sustainability, 14(16): 10363, doi: 10.3390/su141610363.

[4]
Chen G, Zuo D P, Xu Z X, et al. 2024. Changes in water conservation and possible causes in the Yellow River Basin of China during the recent four decades. Journal of Hydrology, 637: 131314, doi: 10.1016/j.jhydrol.2024.131314.

[5]
Chen J H, Wang D C, Li G D, et al. 2020. Spatial and temporal heterogeneity analysis of water conservation in Beijing-Tianjin-Hebei urban agglomeration based on the geodetector and spatial elastic coefficient trajectory models. GeoHealth, 4(8): e2020GH000248, doi: 10.1029/2020GH000248.

[6]
Chen Q R, Xu X, Wu M Y, et al. 2022. Assessing the water conservation function based on the InVEST model: Taking Poyang Lake region as an example. Land, 11(12): 2228, doi: 10.3390/land11122228.

[7]
Eekhout J P, Boix-Fayos C, Pérez-Cutillas P, et al. 2020. The impact of reservoir construction and changes in land use and climate on ecosystem services in a large Mediterranean catchment. Journal of Hydrology, 590(8): 125208, doi: 10.1016/j.jhydrol.2020.125208.

[8]
Gao T, Li Y C, Zhao C Z, et al. 2023. Factors driving changes in water conservation function from a geospatial perspective: case study of Jilin Province. Frontiers in Ecology, 11: 1303957, doi: 10.3389/fevo.2023.1303957.

[9]
Gong J, Xie Y C, Cao E J, et al. 2019. Integration of InVEST-habitat quality model with landscape pattern indexes to assess mountain plant biodiversity change: A case study of Bailongjiang watershed in Gansu Province. Journal of Geographical Sciences, 29: 1193-1210.

[10]
Gong S H, Xiao Y, Zheng H, et al. 2017. Spatial patterns of ecosystem water conservation in China and its impact factors analysis. Acta Ecologlca Sinica, 37(7): 2455-2462. (in Chinese)

[11]
Guan P T, Yang J J, Yang Y R, et al. 2020. Land conversion from cropland to grassland alleviates climate warming effects on nutrient limitation: Evidence from soil enzymatic activity and stoichiometry. Global Ecology and Conservation, 24: e01328, doi: 10.1016/j.gecco.2020.e01328.

[12]
Guo Y D, Gao G H, Ma H B. 2016. Spatial correlation analysis of Suomi-NPP nighttime light data and GDP data. Journal of Tsinghua University, 56(10): 1122-1130. (in Chinese)

[13]
Hu W M, Li G, Gao Z H, et al. 2020. Assessment of the impact of the Poplar Ecological Retreat Project on water conservation in the Dongting Lake wetland region using the InVEST model. Science of the Total Environment, 733: 139423, doi: 10.1016/j.scitotenv.2020.139423.

[14]
Hu W M, Li G, Li Z N. 2021. Spatial and temporal evolution characteristics of the water conservation function and its driving factors in regional lake wetlands-Two types of homogeneous lakes as examples. Ecological Indicators, 130: 108069, doi: 10.1016/j.ecolind.2021.108069.

[15]
Hu Y X, Yu X X, Liao W, et al. 2022. Spatio-temporal patterns of water yield and its influencing factors in the Han River Basin. Resources and Environment in the Yangtze Basin, 31(1): 73-82. (in Chinese)

[16]
Huang T, Yu D Y. 2021. Water-soil conservation services dynamic and its implication for landscape management in a fragile semiarid landscape. Ecological Indicators, 130: 108150, doi: 10.1016/j.ecolind.2021.108150.

[17]
Jia G Y, Hu W M, Zhang B, et al. 2022. Assessing impacts of the Ecological Retreat project on water conservation in the Yellow River Basin. Science of the Total Environment, 828: 154483, doi: 10.1016/j.scitotenv.2022.154483.

[18]
Levia D, Herwitz S. 2005. Interspecific variation of bark water storage capacity of three deciduous tree species in relation to stemflow yield and solute flux to forest soils. Catena, 64(1): 117-137.

[19]
Li G Y, Jiang C H, Zhang Y H, et al. 2021a. Whether land greening in different geomorphic units are beneficial to water yield in the Yellow River Basin? Ecological Indicators, 120: 106926, doi: 10.1016/j.ecolind.2020.106926.

[20]
Li G Y, Jiang C H, Gao Y, et al. 2022a. Natural driving mechanism and trade-off and synergy analysis of the spatiotemporal dynamics of multiple typical ecosystem services in Northeast Qinghai-Tibet Plateau. Journal of Cleaner Production, 374: 134075, doi: 10.1016/j.jclepro.2022.134075.

[21]
Li M Y, Liang D, Xia J, et al. 2021b. Evaluation of water conservation function of Danjiang River Basin in Qinling Mountains, China based on InVEST model. Journal of Environmental Management, 286: 112212, doi: 10.1016/j.jenvman.2021.112212.

[22]
Li X, Zou C X, Chen Y M, et al. 2022b. Spatio-temporal pattern changes and driving factors of water conservation function in Beijing-Tianjin-Hebei region from 2000 to 2019. Bulletin of Soil Water Conservation, 42(5): 265-274. (in Chinese)

[23]
Lin F, Chen X W, Yao W Y, et al. 2020. Multi-time scale analysis of water conservation in a discontinuous forest watershed based on SWAT model. Acta Geographica Sinica, 75(5): 1065-1078.

[24]
Liu C J, Zou L, Xia J, et al. 2023. Spatiotemporal heterogeneity of water conservation function and its driving factors in the upper Yangtze River Basin. Remote Sensing, 15(21): 5246, doi: 10.3390/rs15215246.

[25]
Liu M Z, Min L, Zhao J J, et al. 2021. The impact of land use change on water-related ecosystem services in the Bashang area of Hebei Province, China. Sustainability, 13(2): 716, doi: 10.3390/su13020716.

[26]
Liu Y S, Hou P, Wang P, et al. 2024. Research advance on quantitative assessment methods of ecosystem water conservation service functions. Chinese Journal of Applied Ecology, 35(1): 275-288. (in Chinese)

[27]
Liu Y X, Zhao M Y. 2023. Linking ecosystem service supply and demand to landscape ecological risk for adaptive management: The Qinghai-Tibet Plateau case. Ecological Indicators, 146: 109796, doi: 10.1016/j.ecolind.2022.109796.

[28]
Liu Z, Cuo L, Li Q J, et al. 2020. Impacts of climate change and land use/cover change on streamflow in Beichuan River Basin in Qinghai Province, China. Water, 12(4): 1198, doi: 10.3390/w12041198.

[29]
Lv M X, Ma Z G, Li M X, et al. 2019. Quantitative analysis of terrestrial water storage changes under the Grain for Green program in the Yellow River basin. Journal of Geophysical Research: Atmospheres, 124(3): 1336-1351.

[30]
McLauchlan K K, Hobbie S E, Post W M. 2006. Conversion from agriculture to grassland builds soil organic matter on decadal timescales. Ecological Applications, 16(1): 143-153.

[31]
Meng X Y, Gao X, Li S Y, et al. 2020. Spatial and temporal characteristics of vegetation NDVI changes and the driving forces in Mongolia during 1982-2015. Remote Sensing, 12(4): 603, doi: 10.3390/rs12040603.

[32]
Pan Y, Yin Y H. 2023. Spatial and temporal evolution characteristics of water conservation in the Three-Rivers Headwater Region and the driving factors over the past 30 years. Atmosphere, 14(9): 1453, doi: 10.3390/atmos14091453.

[33]
Qiao Y J, Zhang H, Han X Y, et al. 2023. Exploring drivers of water conservation function variation in Heilongjiang Province from a geospatial perspective. Acta Ecologica Sinica, 43(7): 2711-2721. (in Chinese)

[34]
Qin J B, Ye H, Lin K, et al. 2024. Assessment of water-related ecosystem services based on multi-scenario land use changes: focusing on the Poyang Lake Basin of southern China. Ecological Indicators, 158: 111549, doi: 10.1016/j.ecolind.2024.111549.

[35]
Qin Z, Yang J M, Qiu M Y, et al. 2023. Spatial-temporal distribution and the influencing factors of water conservation function in Yunnan, China. Applied Sciences, 13(21): 11720, doi: 10.3390/app132111720.

[36]
Scordo F, Lavender T M, Seitz C, et al. 2018. Modeling water yield: Assessing the role of site and region-specific attributes in determining model performance of the InVEST seasonal water yield model. Water, 10(11): 1496, doi: 10.3390/w10111496.

[37]
Sun J Y, Ni C R, Wang M M. 2023. Analysis of water conservation trends and drivers in an alpine region: A case study of the Qilian Mountains. Remote Sensing, 15(18): 4611, doi: 10.3390/rs15184611.

[38]
Wang J F, Xu C D. 2017. Geodetector: Principle and prospective. Acta Geographica Sinica, 72(1): 116-134. (in Chinese)

[39]
Wang J R, Zhou J J, Ma D M, et al. 2023. Impact of ecological restoration project on water conservation function of Qilian Mountains based on InVEST model—A case study of the upper reaches of Shiyang River Basin. Land, 12(10): 1850, doi: 10.3390/land12101850.

[40]
Wang Y F, Ye A Z, Peng D Z, et al. 2022. Spatiotemporal variations in water conservation function of the Tibetan Plateau under climate change based on InVEST model. Journal of Hydrology: Regional Studies, 41(4): 101064, doi: 10.1016/j.ejrh.2022.101064.

[41]
Wei P J, Chen S Y, Wu M H, et al. 2021. Using the InVEST model to assess the impacts of climate and land use changes on water yield in the upstream regions of the Shule River Basin. Water, 13(9): 1250, doi: 10.3390/w13091250.

[42]
Wen X, Shao H Y, Wang Y, et al. 2023. Assessment of the spatiotemporal impact of water conservation on the Qinghai-Tibet Plateau. Remote Sensing, 15(12): 3175, doi: 10.3390/rs15123175.

[43]
Wu G L, Liu Y, Fang N F, et al. 2016. Soil physical properties response to grassland conversion from cropland on the semi-arid area. Ecohydrology, 9(8): 1471-1479.

[44]
Wu K, Chen J H, Yang H, et al. 2023. Spatiotemporal variations in the sensitivity of vegetation growth to typical climate factors on the Qinghai-Tibet Plateau. Remote Sensing, 15(9): 2355, doi: 10.3390/rs15092355.

[45]
Xia R, Zhang Y, Yang C, et al. 2019. Hydrological adjusting service function and value assessment in Wuyishan City based on distributed hydrological model. Research of Environmental Sciences, 32(6): 1033-1042. (in Chinese)

[46]
Xue J, Li Z X, Feng Q, et al. 2022. Spatiotemporal variations of water conservation and its influencing factors in ecological barrier region, Qinghai-Tibet Plateau. Journal of Hydrology: Regional Studies, 42: 101164, doi: 10.1016/j.ejrh.2022.101164.

[47]
Yan X, Cao G C, Cao S K, et al. 2023. Spatiotemporal variations of water conservation and its influencing factors in the Qinghai Plateau, China. Ecological Indicators, 155: 111047, doi: 10.1016/j.ecolind.2023.111047.

[48]
Yang H F, Nie S N, Deng S Q, et al. 2023. Evaluation of water yield and its driving factors in the Yangtze River Basin, China. Environmental Earth Sciences, 82(18): 429, doi: 10.1007/s12665-023-11113-9.

[49]
Yang J, Huang X. 2021. The 30m annual land cover dataset and its dynamics in China from 1990 to 2019. Earth System Science Data, 13(8): 3907-3925.

[50]
Zhang X, Zhang G S, Long X, et al. 2021. Identifying the drivers of water yield ecosystem service: A case study in the Yangtze River Basin, China. Ecological Indicators, 132: 108304, doi: 10.1016/j.ecolind.2021.108304.

[51]
Zhang Y W, Zhang B, Ma B, et al. 2022. Evaluation of the water conservation capacity of the Weihe River Basin based on the Integrated Valuation of Ecosystem Services and Tradeoffs model. Ecohydrology, 15(8): e2465, doi: 10.1002/eco.2465.

[52]
Zhao F B, Ma S, Wu Y P, et al. 2022. The role of climate change and vegetation greening on evapotranspiration variation in the Yellow River Basin, China. Agricultural Forest Meteorology, 316: 108842, doi: 10.1016/j.agrformet.2022.108842.

[53]
Zhou L Y, Cui W L, Yang F. 2024. Spatiotemporal variations and driving forces analysis of ecosystem water conservation in coastal areas of China. Ecological Indicators, 162: 112019, doi: 10.1016/j.ecolind.2024.112019.

[54]
Zhou X T, Sun W Y, Mu X M, et al. 2023. Spatiotemporal variation and influencing factors of water conservation capacity in Three-River Headwaters region from 1990 to 2020. Acta Ecologica Sinica, 43(23): 9844-9855. (in Chinese)

[55]
Zuo D P, Chen G, Wang G Q, et al. 2023. Assessment of changes in water conservation capacity under land degradation neutrality effects in a typical watershed of Yellow River Basin, China. Ecological Indicators, 148: 110145, doi: 10.1016/j.ecolind.2023.110145.

Outlines

/