
Non-stationary characteristics and causes of extreme precipitation in a desert steppe in Inner Mongolia, China
Received date: 2024-09-01
Revised date: 2025-01-12
Accepted date: 2025-01-16
Online published: 2025-08-12
Recent years have witnessed increasingly frequent extreme precipitation events, especially in desert steppes in the semi-arid and arid transition zone. Focusing on a desert steppe in western-central Inner Mongolia Autonomous Region, China, this study aimed to determine the principle time-varying pattern of extreme precipitation and its dominant climate forcings during the period 1988-2017. Based on the generalized additive models for location, scale, and shape (GAMLSS) modeling framework, we developed the best time-dependent models for the extreme precipitation series at nine stations, as well as the optimized non-stationary models with large-scale climate indices (including the North Atlantic Oscillation (NAO), Atlantic Multidecadal Oscillation (AMO), Southern Oscillation (SO), Pacific Decadal Oscillation (PDO), Arctic Oscillation (AO), and North Pacific Oscillation (NPO)) as covariates. The results indicated that extreme precipitation remained stationary at more than half of the stations (Hailisu, Wuyuan, Dengkou, Hanggin Rear Banner, Urad Front Banner, and Yikewusu), while linear and non-linear time-varying patterns were quantitatively identified at the other stations (Urad Middle Banner, Linhe, and Wuhai). These non-stationary behaviors of extreme precipitation were mainly reflected in the mean value of extreme precipitation. The optimized non-stationary models performed best, indicating the significant influences of large-scale climate indices on extreme precipitation. In particular, the NAO, NPO, SO, and AMO remained as covariates and significantly influenced the variations in the extreme precipitation regime. Our findings have important reference significance for gaining an in-depth understanding of the driving mechanism of the non-stationary behavior of extreme precipitation and enable advanced predictions of rainstorm risks.
LI Wei , WANG Yixuan , DUAN Limin , TONG Xin , WU Yingjie , ZHAO Shuixia . Non-stationary characteristics and causes of extreme precipitation in a desert steppe in Inner Mongolia, China[J]. Journal of Arid Land, 2025 , 17(5) : 590 -604 . DOI: 10.1007/s40333-025-0078-7
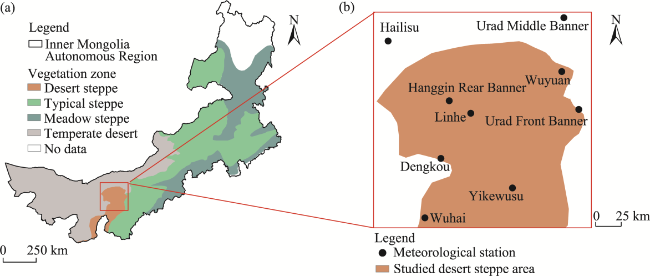
Fig. 1 Overview of the vegetation zones in Inner Mongolia Autonomous Region, northern China and location of the studied desert steppe area (a) and distribution of the selected meteorological stations in and around the studied desert steppe area (b). Note that the boundary of Inner Mongolia Autonomous Region is based on the standard map (GS(2020)4619) of the Map Service System (https://bzdt.ch.mnr.gov.cn/), and the boundary has not been modified. The data for the vegetation zones were obtained from the Resource and Environmental Science Data Platform (https://www.resdc.cn/). |
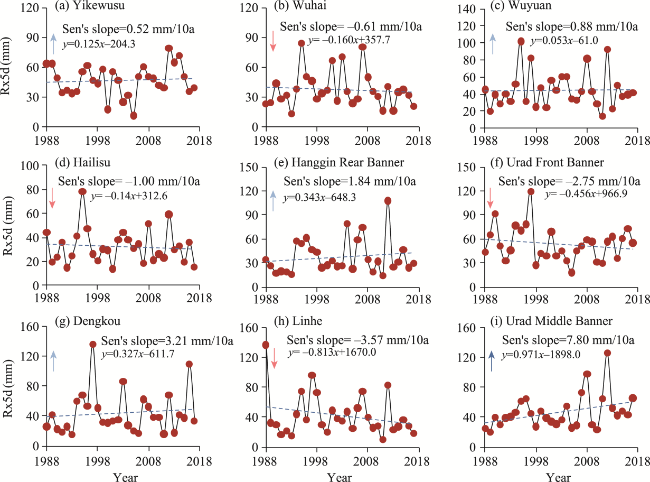
Fig. 2 Results of linear regression, Mann-Kendall statistical test, and Theil-Sen approach for the Rx5d series at the nine stations from 1988 to 2017. (a), Yikewusu; (b), Wuhai; (c), Wuyuan; (d), Hailisu; (e), Hanggin Rear Banner; (f), Urad Front Banner; (g), Dengkou; (h), Linhe; (i), Urad Middle Banner. Rx5d indicates the maximum precipitation during five consecutive days. The pink downward pointing arrow indicates a decreasing trend. The light blue upward pointing arrow indicates an increasing trend, and the dark blue upward pointing arrow indicates a significant increasing trend (α=0.01). |
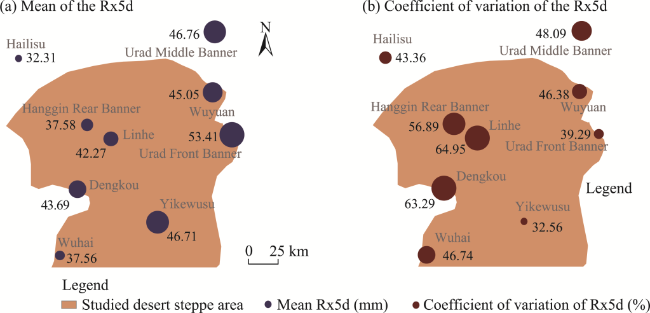
Fig. 3 Spatial variations in mean (a) and coefficient of variation (b) of the Rx5d series at the nine stations during 1988-2017. Circle size represents the magnitude of the value at each station. |
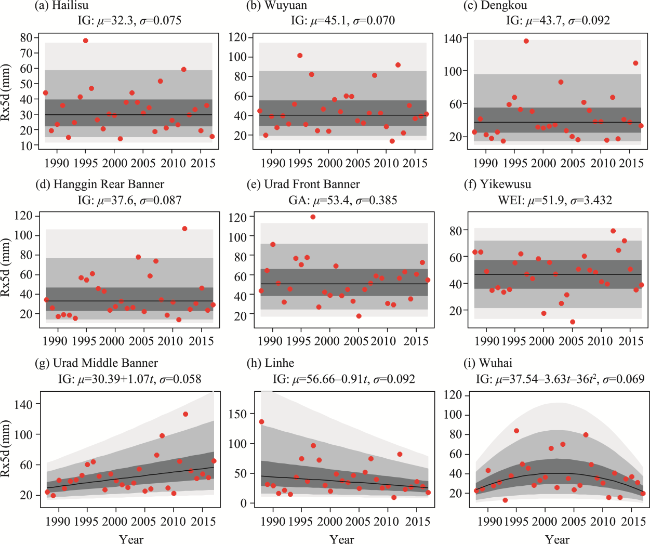
Fig. 4 Distribution selection, parameter estimation, and modeling results of the best time-dependent model for extreme precipitation at each station from 1988 to 2017. (a), Hailisu; (b), Wuyuan; (c), Dengkou; (d), Hanggin Rear Banner; (e), Urad Front Banner; (f), Yikewusu; (g), Urad Middle Banner; (h), Linhe; (i), Wuhai. The red circles represent the measured annual Rx5d values. The light gray region represents the area between the 0.01 and 0.99 quantiles, the dark gray region represents the area between the 0.05 and 0.95 quantiles, the black region represents the area between the 0.25 and 0.75 quantiles, and the black line represents the median (0.50 quantile). IG, GA, and WEI denote the Inverse Gaussian, Gamma, and Weibull distributions, respectively. μ and σ are the location and scale parameters, respectively. |
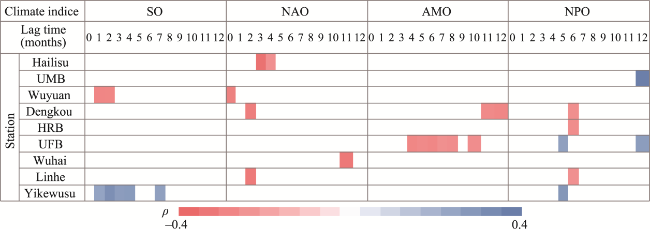
Fig. 5 Concurrent and lagging correlation between the Rx5d and large-scale climate indices at the nine stations during 1988-2017. SO, Southern Oscillation; NAO, North Atlantic Oscillation; AMO, Atlantic Multidecadal Oscillation; NPO, North Pacific Oscillation. UMB, HRB, and UFB denote the Urad Middle Banner, Hanggin Rear Banner, and Urad Front Banner, respectively. ρ is the Spearman's rank order correlation coefficient. |
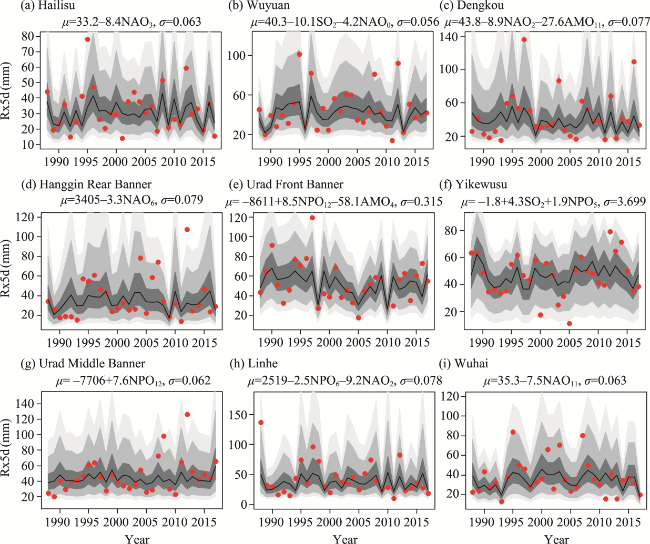
Fig. 6 Parameter estimation and modeling results of the best non-stationary model for extreme precipitation at each station from 1988 to 2017. (a), Hailisu; (b), Wuyuan; (c), Dengkou; (d), Hanggin Rear Banner; (e), Urad Front Banner; (f), Yikewusu; (g), Urad Middle Banner; (h), Linhe; (i), Wuhai. The red circles are the measured annual RX5d values. The light gray shading represents the area between the 0.01 and 0.99 quantiles, the dark gray shading represents the area between the 0.05 and 0.95 quantiles, the black shading represents the area between the 0.25 and 0.75 quantiles, and the black line represents the median (0.50 quantile). The subscript number of the climate index represents the corresponding lag time. |
| [1] |
|
| [2] |
|
| [3] |
|
| [4] |
|
| [5] |
|
| [6] |
|
| [7] |
|
| [8] |
|
| [9] |
|
| [10] |
|
| [11] |
|
| [12] |
|
| [13] |
|
| [14] |
|
| [15] |
|
| [16] |
|
| [17] |
|
| [18] |
|
| [19] |
|
| [20] |
|
| [21] |
|
| [22] |
IPCC (Intergovernmental Panel on Climate Change). 2021. Annex VI:Climatic Impact-driver and Extreme Indices. In Climate Change 2021: The Physical Science Basis. Contribution of Working Group I to the Sixth Assessment Report of the Intergovernmental Panel on Climate Change. Cambridge, United Kingdom and New York, NY, USA: Cambridge University Press, 2205-2214.
|
| [23] |
|
| [24] |
|
| [25] |
|
| [26] |
|
| [27] |
|
| [28] |
|
| [29] |
|
| [30] |
|
| [31] |
|
| [32] |
|
| [33] |
|
| [34] |
|
| [35] |
|
| [36] |
|
| [37] |
|
| [38] |
|
| [39] |
|
| [40] |
|
| [41] |
|
| [42] |
|
| [43] |
|
| [44] |
|
| [45] |
|
| [46] |
|
| [47] |
|
| [48] |
|
| [49] |
|
| [50] |
|
| [51] |
|
| [52] |
|
| [53] |
|
| [54] |
|
| [55] |
|
| [56] |
|
| [57] |
|
| [58] |
|
| [59] |
|
| [60] |
|
| [61] |
|
| [62] |
|
| [63] |
|
| [64] |
|
| [65] |
|
| [66] |
|
| [67] |
|
| [68] |
|
| [69] |
|
/
| 〈 |
|
〉 |